. 2022 Oct 30;13(1):6497.
doi: 10.1038/s41467-022-34255-z.

Defining cellular complexity in human autosomal dominant polycystic kidney disease by multimodal single cell analysis

Affiliations

Defining cellular complexity in human autosomal dominant polycystic kidney disease by multimodal single cell analysis

Yoshiharu Muto et al. Nat Commun. .

Abstract

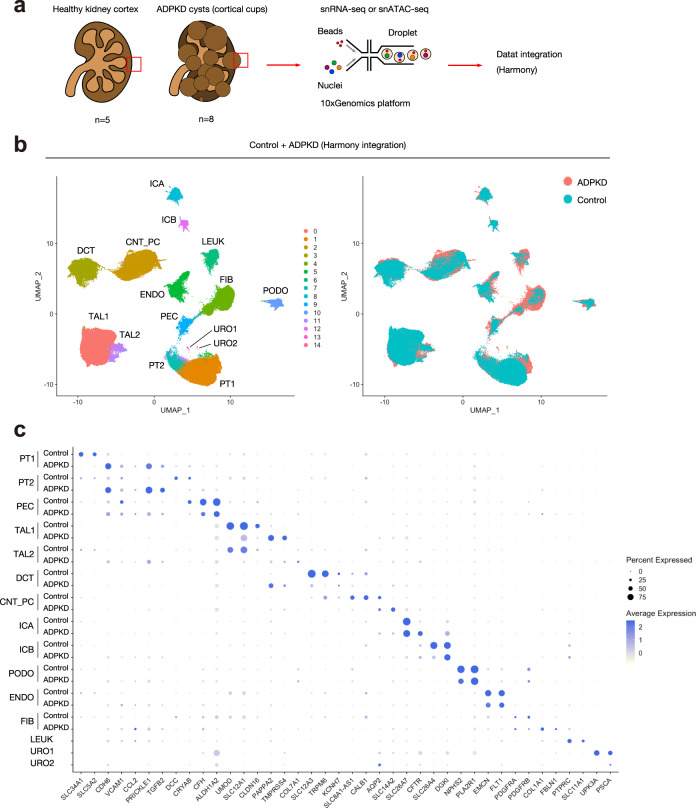
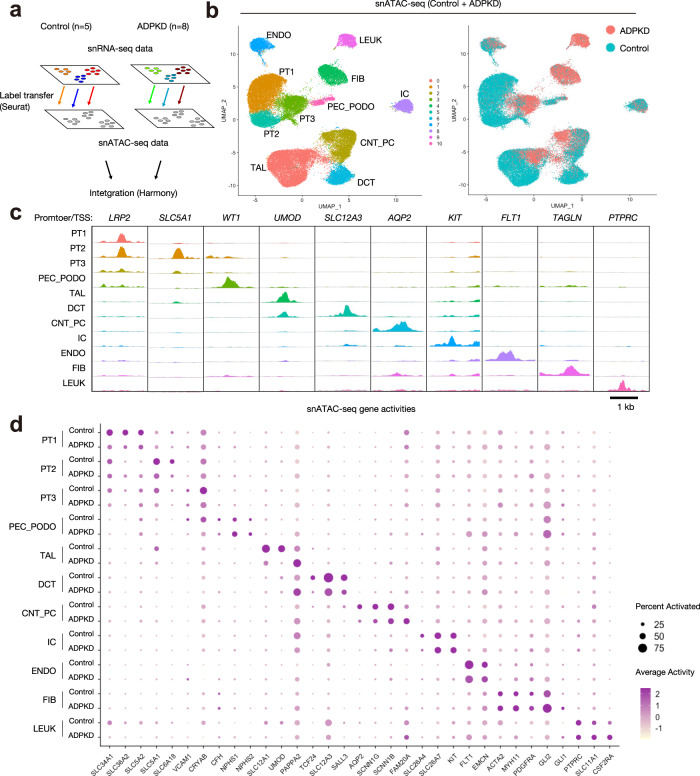
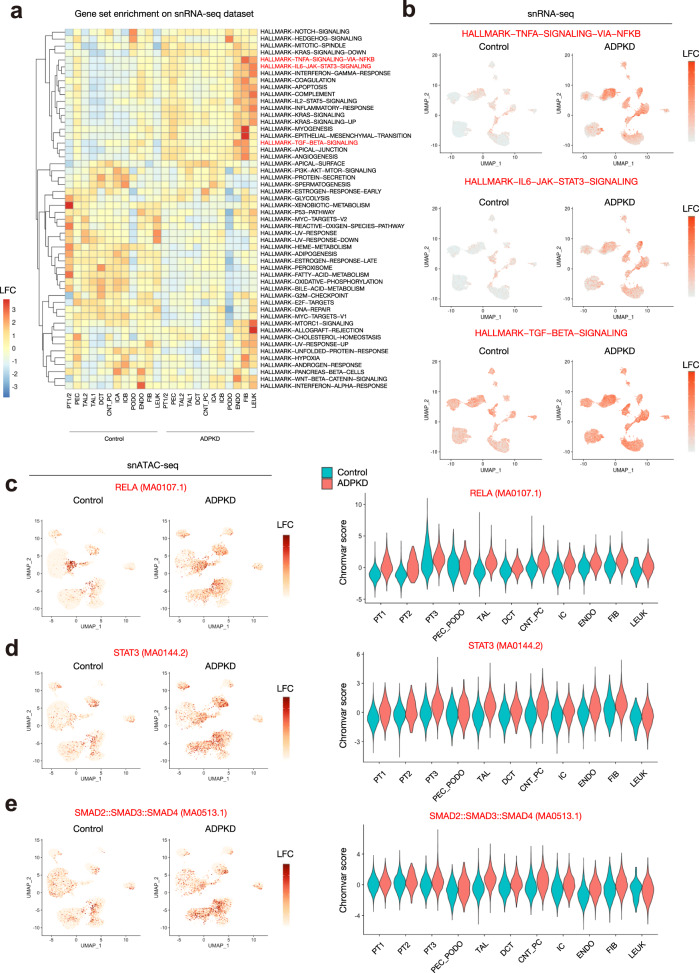
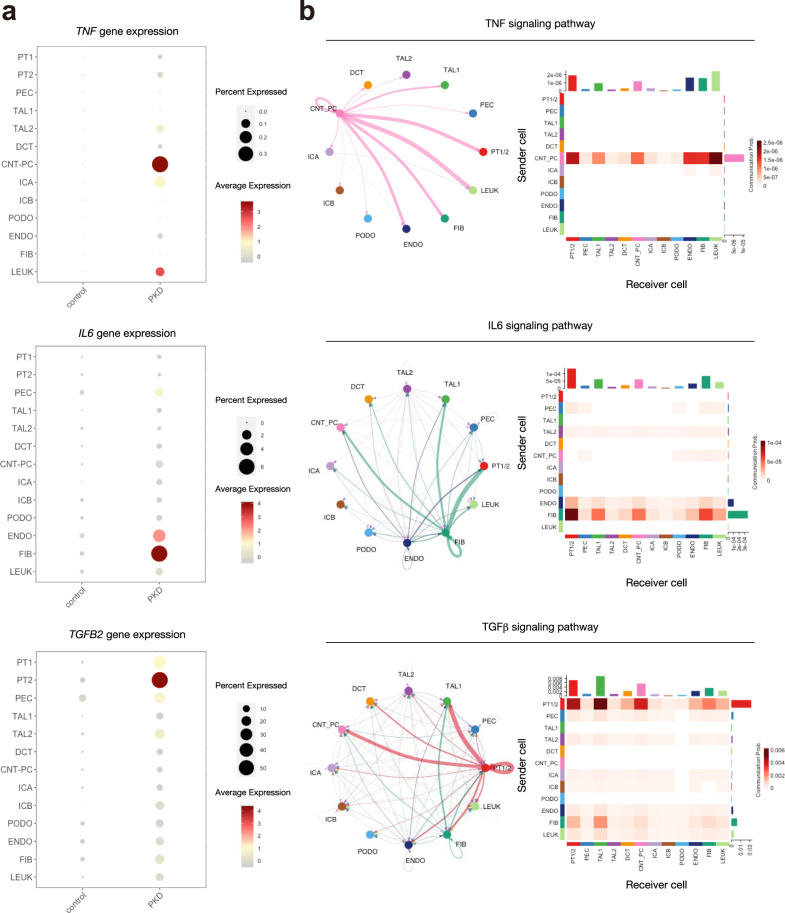
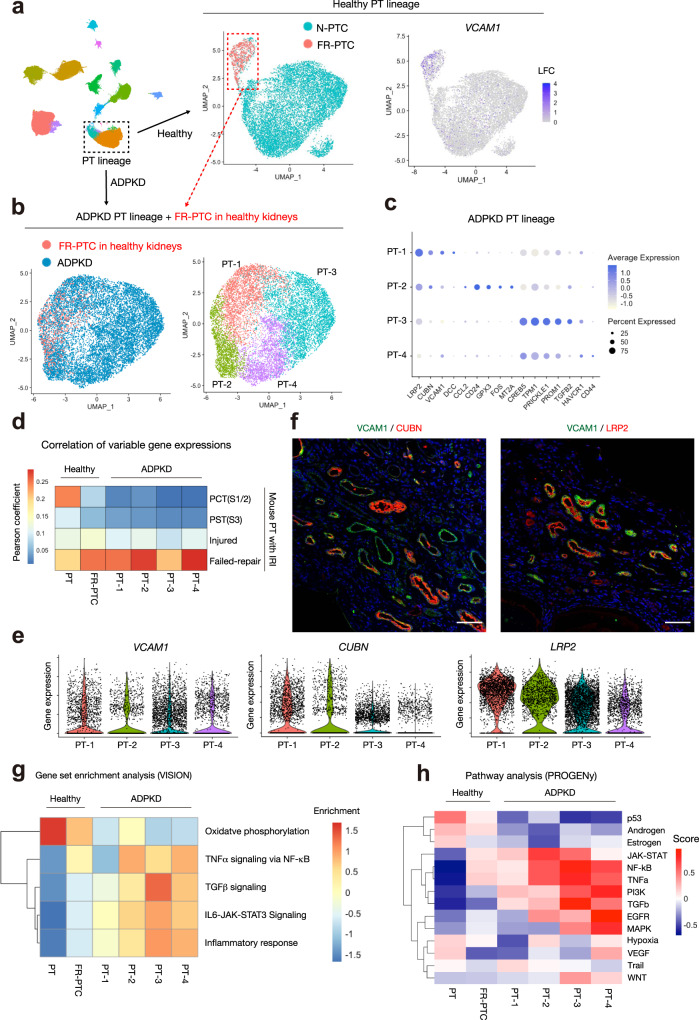
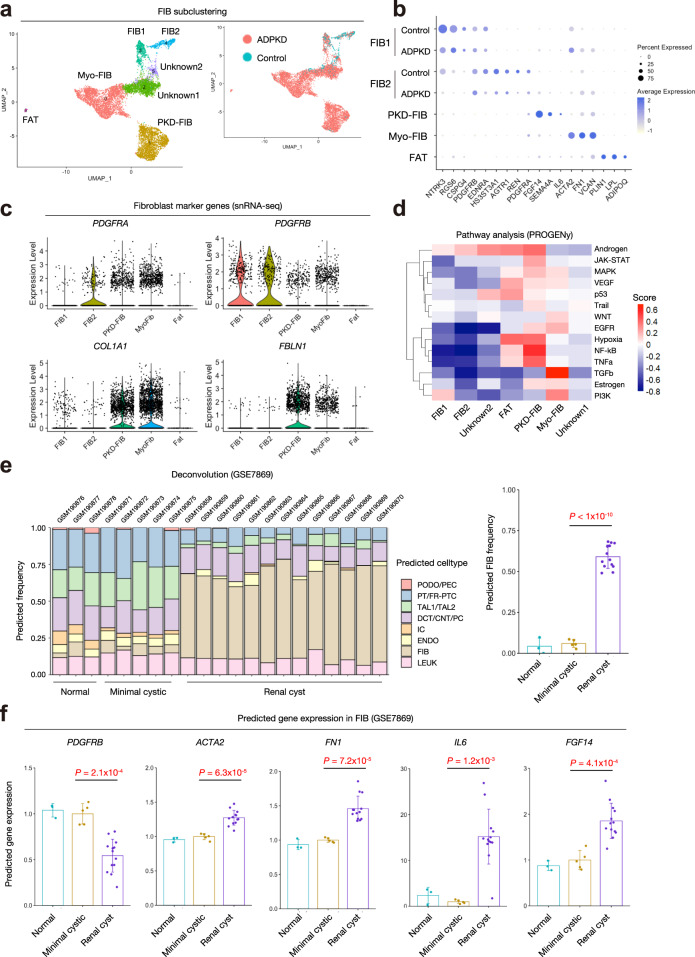
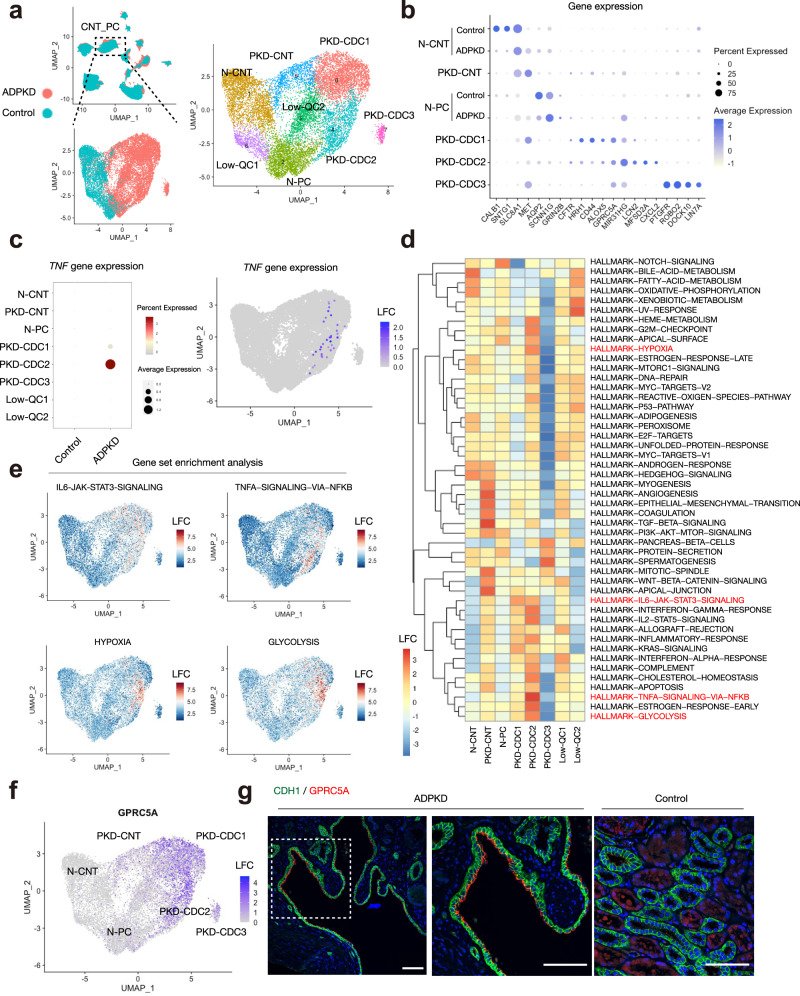
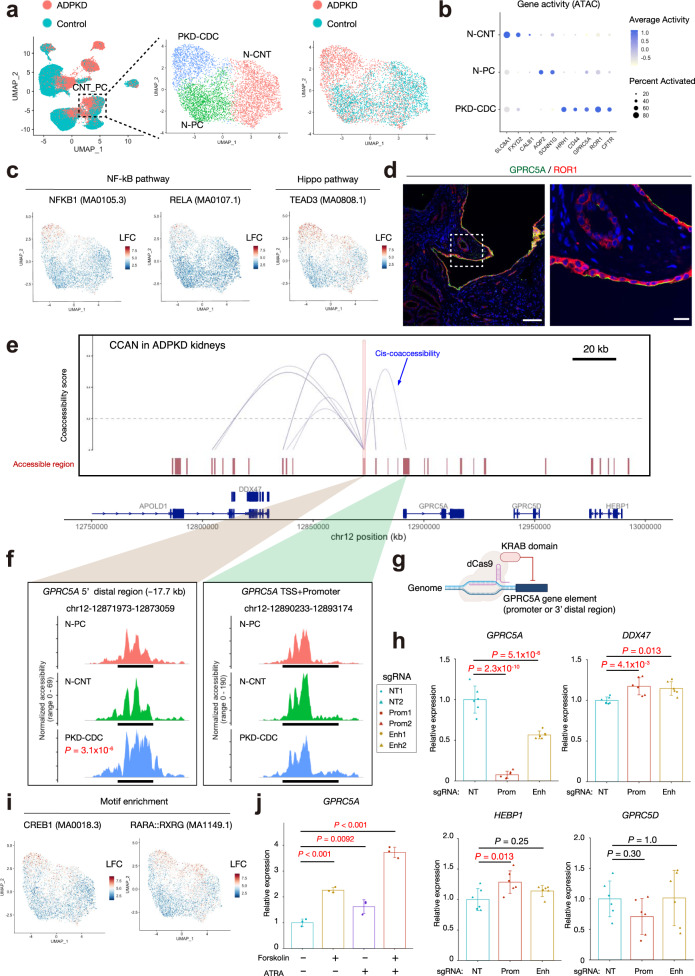
Autosomal dominant polycystic kidney disease (ADPKD) is the leading genetic cause of end stage renal disease characterized by progressive expansion of kidney cysts. To better understand the cell types and states driving ADPKD progression, we analyze eight ADPKD and five healthy human kidney samples, generating single cell multiomic atlas consisting of ~100,000 single nucleus transcriptomes and ~50,000 single nucleus epigenomes. Activation of proinflammatory, profibrotic signaling pathways are driven by proximal tubular cells with a failed repair transcriptomic signature, proinflammatory fibroblasts and collecting duct cells. We identify GPRC5A as a marker for cyst-lining collecting duct cells that exhibits increased transcription factor binding motif availability for NF-κB, TEAD, CREB and retinoic acid receptors. We identify and validate a distal enhancer regulating GPRC5A expression containing these motifs. This single cell multiomic analysis of human ADPKD reveals previously unrecognized cellular heterogeneity and provides a foundation to develop better diagnostic and therapeutic approaches.


Conflict of interest statement

B.D.H. is a consultant for Janssen Research & Development, LLC, Pfizer and Chinook Therapeutics, holds equity in Chinook Therapeutics and grant funding from Chinook Therapeutics and Janssen Research & Development, LLC. O.M.W. has received grants from AstraZeneca unrelated to the current work. J.H.M. has received funding from Chinook Therapeutics unrelated to the current work. S.S. has received grant funding from Otsuka, Palladio Biosciences, Kadmon Corporation, Sanofi, and Reata Pharmaceuticals. A.J.K., E.O., M.G., J.K., and J.H.C. are employees and stock holders of Chinook Therapeutics. The remaining authors declare no competing interests.

Figures

Fig. 1
Fig. 1. Single-nucleus transcriptional profiling on human ADPKD kidneys.
a Overview of experimental methodology. n = 8 human ADPKD kidneys and n = 5 control kidneys were analyzed with snRNA-seq and snATAC-seq. Batch effect on the integrated datasets was corrected with Harmony. See Method section for detail. b UMAP plot of integrated snRNA-seq dataset with annotation by cell type (left) or disease condition (right). PT proximal tubule, PEC parietal epithelial cells, TAL thick ascending limb of Henle’s loop, DCT distal convoluted tubule, CNT_PC connecting tubule and principal cells, ICA Type A intercalated cells, ICB Type B intercalated cells, PODO podocytes, ENDO endothelial cells, FIB fibroblasts, LEUK leukocytes, URO uroepithelium. c Dot plot of snRNA-seq dataset showing gene expression patterns of cluster-enriched markers for ADPKD or control kidneys. For LEUK and URO1/2 clusters, data from ADPKD kidneys were shown. The diameter of the dot corresponds to the proportion of cells expressing the indicated gene and the intensity of the dot corresponds to average expression relative to all cell types.
Fig. 2
Fig. 2. Single-nucleus chromatin accessibility profiling on human ADPKD kidneys.
a Graphical abstract of multimodal integration strategy for the snATAC-seq datasets. The integrated ADPKD or control snATAC-seq datasets were label-transferred from cognate snRNA-seq datasets, and the snATAC-seq datasets were filtered using an 80% prediction score threshold for cell-type assignment. After filtering, control and ADPKD datasets were merged, and batch effect was corrected with Harmony. See Supplementary Fig. 7 and Method section for detail. b UMAP plot of snATAC-seq dataset with gene activity-based cell-type assignments (left) or annotation by disease condition (right). c Fragment coverage (frequency of Tn5 insertion) around the differentially accessible regions (DAR) around each cell type at lineage marker gene transcription start sites. Scale bar indicates 1 Kb. d Dot plot of snATAC-seq dataset showing gene activity patterns of cluster-enriched markers for control or ADPKD kidneys. The diameter of the dot corresponds to the proportion of cells with detected activity of indicated gene and the intensity of the dot corresponds to average gene activity relative to all cell types.
Fig. 3
Fig. 3. Activation of proinflammatory, profibrotic pathways in ADPKD kidneys.
a Heatmap showing enrichment of hallmark genesets of the Molecular Signatures Database (MsigDB) in each cell type of ADPKD or control kidneys. Source data are provided as a Source Data file. b UMAP displaying enrichment of genes regulated by NF-κB pathway in response to TNFα (upper), genes upregulated by IL6 via STAT3 (middle) or genes upregulated in response to TGFβ signaling (lower) in snRNA-seq dataset. ce UMAP displaying enrichment of transcription factor binding motifs in control or ADPKD kidneys (left) and violin plot showing the relative motif enrichment scores in each cell type (right) for RELA (c), STAT3 (d), or SMAD2/SMAD3/SMAD4 complex (e). The color scale represents a normalized log-fold-change (LFC).
Fig. 4
Fig. 4. Ligand-receptor analysis identified proinflammatory, profibrotic signaling network.
a Dot plot showing gene expression of TNF (upper), IL6 (middle), or TGFB2 (lower) in each cell type in ADPKD or control kidneys. The diameter of the dot corresponds to the proportion of cells expressing the indicated gene and the intensity of the dot corresponds to average expression relative to all cell types. b Ligand-receptor analysis with CellChat. Circle plot showing an inferred network (left) or heatmap (right) showing communication probabilities from senders (secretors) to receivers (targets) for TNF signaling pathway (upper), IL6 signaling pathway (middle), or TGFβ signaling pathway (lower). Thickness of an arrow in a circle plot indicates interaction strength.
Fig. 5
Fig. 5. Proximal tubular cells express a failed-repair molecular signature in ADPKD kidneys.
a Subclustering of healthy control PT lineage on the UMAP plot of snRNA-seq dataset, colored by subtypes (left and middle) or VCAM1 expression level (right). N-PTC normal proximal tubular cells, FR-PTC failed-repair proximal tubular cells. b Subclustering of healthy control FR-PTC and ADPKD PT cells on the UMAP, colored by disease (left) or subtypes (PT-1/2/3/4, right). c Dot plot showing gene expression patterns of the genes enriched in each of PT subtypes in ADPKD kidneys. The diameter of the dot corresponds to the proportion of cells expressing the indicated gene and the intensity of the dot corresponds to average expression relative to all ADPKD PT cells. d Pearson correlations of the averaged expressions of highly variable genes between PT subtypes in ischemia reperfusion injury (IRI) model mouse kidneys (GSE139107) and those of human ADPKD dataset. The highly variable genes among IRI mouse PT cells that also exist in human dataset were analyzed (1648 genes). The heatmap shows Pearson correlation coefficients (R). Source data are provided as a Source Data file. e Violin plot showing VCAM1, CUBN, or LRP2 gene mRNA expression among PT subtypes of ADPKD kidneys. f Immunohistochemistry analysis on human ADPKD kidney for VCAM1 (green) and CUBN (red, left) or LRP2 (red, right). Representative images of n = 3 samples. Scale bar indicates 50 µm. g Heatmap showing enrichment of hallmark genesets of the Molecular Signatures Database (MsigDB) for oxidative phosphorylation or inflammatory pathways. Source data are provided as a Source Data file. h Heatmap showing pathway enrichment on PT subpopulations with PROGENy.
Fig. 6
Fig. 6. Expansion of proinflammatory, profibrotic fibroblast subtypes in ADPKD kidneys.
a Subclustering of FIB on the UMAP plot of snRNA-seq dataset with annotation by subtype (left) or disease condition (right). MyoFIB Myofibroblast, PKD-FIB ADPKD-specific fibroblast subtype, FAT adipocytes. b Dot plot showing gene expression patterns of the genes enriched in each of FIB subpopulations. For FIB1 and FIB2, control and ADPKD data were individually shown. The diameter of the dot corresponds to the proportion of cells expressing the indicated gene and the intensity of the dot corresponds to average expression relative to all FIB cells. c Violin plot showing fibroblast marker gene expression among FIB subclusters; PDGFRA (upper left), PDGFRB (upper right), COL1A1 (lower left), and FBLN1 (lower right). d Heatmap showing pathway enrichment on FIB subpopulations with PROGENy. The color scale represents pathway enrichment score. e Predicted frequencies of cell types in each dataset of normal kidney cortex (n = 3) of healthy control, and minimal cystic tissue (n = 5) or renal cyst (n = 13) of ADPKD patients in deconvolution analysis of human ADPKD kidney datasets (GSE7869) with CIBERSORTx. The predicted FIB frequencies in each group are also shown (right). Source data are provided as a Source Data file. f Predicted relative gene expressions of PDGFRB, ACTA2, FN1, IL6, or FGF14 in FIB of each group with CIBERSORTx. Each dot represents a biological replicate for normal kidney cortex (n = 3) of healthy control, and minimal cystic tissue (n = 5) or renal cyst (n = 13) of ADPKD patients. Bar graphs represent the mean and error bars are the s.d. One-way ANOVA with post hoc Dunnett’s multiple comparisons test. Source data are provided as a Source Data file.
Fig. 7
Fig. 7. Transcriptomic characterization of cyst-lining cells originated from collecting duct.
a Subclustering of CNT_PC on the UMAP plot of snRNA-seq dataset with annotation by disease condition (left) or subtype (right). N-CNT normal CNT, N-PC normal PC, PKD-CNT ADPKD-specific CNT, PKD-CDC ADPKD-specific collecting duct cells, LowQC low-quality cells. b Dot plot showing gene expression patterns of the genes enriched in each subpopulation. For N-PC and N-CNT, control and ADPKD data were individually shown. The diameter of the dot corresponds to the proportion of cells expressing the indicated gene and the intensity of the dot corresponds to average expression relative to all CNT_PC cells. c Dot plot showing TNF expression among subclusters (left). The diameter of the dot corresponds to the proportion of cells expressing the indicated gene and the density of the dot corresponds to average expression relative to all CNT_PC cells. UMAP plot displaying TNF expression (right). The color scale represents a normalized log-fold-change (LFC). d Heatmap showing enrichment of hallmark genesets in each cell type in CNT_PC clusters. Source data are provided as a Source Data file. e UMAP displaying enrichment of genes upregulated by IL6 via STAT3 (upper left), genes regulated by NF-κB pathway in response to TNFα (upper right), genes upregulated in response to hypoxia (lower left) and genes encoding proteins involved in glycolysis and gluconeogenesis (lower right) in snRNA-seq dataset. f UMAP plot displaying GPRC5A gene expression in CNT_PC subtypes. The color scale represents a normalized LFC. g Representative immunofluorescence images of CDH1 (green) and GPRC5A (red) in the ADPKD (left and middle, n = 3) or control kidneys (right, n = 3). Scale bar indicates 50 µm.
Fig. 8
Fig. 8. Multimodal approach revealed epigenetic alterations in ADPKD cyst cells.
a Subclustering of CNT_PC on the UMAP plot of the snATAC-seq dataset with annotation by subtype (left) or disease condition (right). b Dot plot showing gene activity patterns of the genes enriched in each of CNT_PC subpopulations. The diameter of the dot corresponds to the proportion of cells with detected activity of indicated gene and the intensity of the dot corresponds to average gene activity relative to all CNT_PC nuclei. c UMAP plot showing enrichment of transcription factor binding motifs for NF-κB pathway; NFKB1 (left) and RELA (middle), or Hippo pathway; TEAD3 (right). The color scale represents a normalized log-fold-change (LFC). d Representative immunofluorescence images of ROR1 (red) and GPRC5A (green) in the ADPKD kidneys (n = 3). Scale bar indicates 50 µm (left) or 10 µm (right). e Cis-coaccessibility network (CCAN, gray arcs) among accessible regions (red boxes) around the GPRC5A locus is shown. f Fragment coverage (frequency of Tn5 insertion) around TSS (middle right, chr12:12890233–12893174) or 5’ distal differentially accessible region (middle left, chr12:12871973–12873059) are shown (peak ±1 Kb). Bonferroni-adjusted p-values were used to determine significance for differential accessibility. g Graphic methodology showing CRISPR interference. Schematic was created with BioRender. h RT and real-time PCR analysis of mRNAs for GPRC5A or its surrounding genes (DDX47, HEBP1, and GPRC5D) in WT9-12 cells with CRISPR interference targeting the promoter (Prom) or 5’ distal potential enhancer (Enh) for GPRC5A gene. NT nontargeting control. Each group consists of n = 6 data (2 sgRNAs with 3 biological replicates). i UMAP plot showing enrichment of transcription factor binding motifs for CREB1 (left) or retinoic acid receptor (RARA::RXRG, right). The color scale represents a normalized LFC. j RT and real-time PCR analysis of mRNAs for GPRC5A in WT9-12 cells treated with forskolin (10 μM) with or without all-trans retinoic acid (ATRA, 1 μM) for 6 h (n = 3 biological replicates). Bar graphs represent the mean and error bars are the s.d. One-way ANOVA with post hoc Dunnett’s multiple comparisons test. Source data are provided as a Source Data file (h, j).

References

    1. Torres VE, Harris PC, Pirson Y. Autosomal dominant polycystic kidney disease. Lancet. 2007;369:1287–1301. doi: 10.1016/S0140-6736(07)60601-1. - DOI - PubMed
    1. Fedeles SV, Gallagher A-R, Somlo S. Polycystin-1: a master regulator of intersecting cystic pathways. Trends Mol. Med. 2014;20:251–260. doi: 10.1016/j.molmed.2014.01.004. - DOI - PMC - PubMed
    1. Torres VE, et al. Tolvaptan in patients with autosomal dominant polycystic kidney disease. N. Engl. J. Med. 2012;367:2407–2418. doi: 10.1056/NEJMoa1205511. - DOI - PMC - PubMed
    1. Wu H, Kirita Y, Donnelly EL, Humphreys BD. Advantages of single-nucleus over single-cell RNA sequencing of adult kidney: rare cell types and novel cell states revealed in fibrosis. J. Am. Soc. Nephrol. 2019;30:23–32. doi: 10.1681/ASN.2018090912. - DOI - PMC - PubMed
    1. Park J, et al. Single-cell transcriptomics of the mouse kidney reveals potential cellular targets of kidney disease. Science. 2018;360:758–763. doi: 10.1126/science.aar2131. - DOI - PMC - PubMed

Publication types

MeSH terms

Substances