. 2022 Nov 5:1267:133574.
doi: 10.1016/j.molstruc.2022.133574. Epub 2022 Jun 23.

Anti-fibrillization effects of sulfonamide derivatives on α-synuclein and hyperphosphorylated tau isoform 1N4R

Affiliations

Anti-fibrillization effects of sulfonamide derivatives on α-synuclein and hyperphosphorylated tau isoform 1N4R

Jessica S Fortin et al. J Mol Struct. .

Abstract

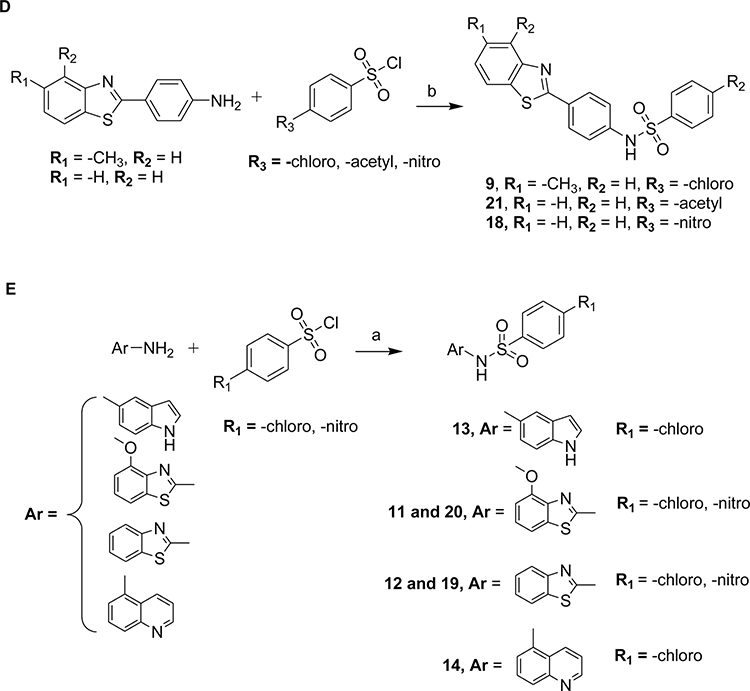
In contrast to Aβ plaques, the spatiotemporal distribution of neurofibrillary tangles of hyperphosphorylated tau (p-tau) predicts cognitive impairment in Alzheimer's disease (AD), underscoring the key pathological role of p-tau and the utmost need to develop AD therapeutics centering upon the control of p-tau aggregation and cytotoxicity. Our drug discovery program is focused on compounds that prevent the aggregation and cytotoxicity of p-tau moieties of the tau isoform 1N4R due to its prevalence (1 N) and long-distance trans-synaptic propagation (4R). We prepared and tested twenty-four newly synthesized small molecules representing the urea (1, 2, 3), sulfonylurea (4), and sulfonamide (5-24) series and evaluated their anti-aggregation effects with biophysical methods (thioflavin T and S fluorescence assays, transmission electron microscopy) and intracellular inclusion cell-based assays. Pre-evaluation was performed on alpha-synuclein (α-syn) to identify molecules to be challenged with p-tau. The sulfonamide derivatives 18 and 20 exhibited an anti-fribrillization activity on α-syn and p-tau. Sulfonamide compounds 18 and 20 reduced inclusion formation in M17D neuroblastoma cells that express inclusion-prone αSynuclein3K::YFP. This project advances new concepts in targeting prone-to-aggregate proteins such as α-syn and p-tau, and provides a molecular scaffold for further optimization and pre-clinical studies focused on AD drug development.

Keywords: Alpha-synuclein; Alzheimer’s disease; Fibrils; Hyperphosphorylated tau; Isoform 1N4R; Neuroblastoma cells; Sulfonamides.


Conflict of interest statement

Declaration of Competing Interest The authors declare no competing interest.

Figures

Fig. 1.
Fig. 1.
Kinetics of α-synuclein (α-syn) fibril formation obtained with different compounds monitored using the thioflavin T (ThT) fluorescence assays. The compounds were tested at a final concentration of 100 μM in presence of α-syn at 6 μM. Molar ratio of peptide: compound was ~1:16.
Fig. 2.
Fig. 2.
Kinetics of p-tau isoform 1N4R fibril formation obtained with different compounds monitored using the thioflavin S (ThS) fluorescence assays. The compounds were tested at a final concentration of 50 μM in presence of α-synuclein at 6 μM. Molar ratio of peptide: compound was ~1:8.
Fig. 3.
Fig. 3.
Compound 18 and 20 reduces α-synuclein (α-syn) and p-tau fibril formation as validated by transmission electron microscopy (TEM). α-Syn (60 μM) was incubated with DMSO (<0.1%) or compounds 9, 11, 18 and 20 (600 μM) for 24 hours prior TEM visualization (molar ratio 1:10). P-tau (10 μM) was incubated with DMSO (<0.1%) or compounds 9, 11, 18 and 20 (50 μM) for 24 hours prior TEM visualization (molar ratio 1:5). High (40 K) magnifications show less fibrils with compound 18 and 20 in comparison with DMSO (<0.1%). Scale bare: 200 nm (40 K).
Fig. 4.
Fig. 4.
Compounds 7, 8, 5, 21 and 15 reduce inclusion formation in M17D neuroblastoma cells that express inclusion-prone αSynuclein3K::YFP. (A) M17D cells that express an αS3K::YFP fusion protein (dox-inducible) were treated with 0.1% DMSO (vehicle), 40 μM 7, 40 μM 8, 40 μM 5, 40 μM 21, 40 μM 15 at t = 24 hrs. Cells were induced with dox at t = 48 hours. Punctate YFP signals were measured and normalized to 0.1% DMSO at t = 96 hours. Eight independent experiments (N = 8; n = 14; except DMSO, n = 30) were performed. Data are presented as fold-change relative to 0.1% DMSO. Ordinary one-way ANOVA plus Dunnett’s multiple comparison test (***, p < 0.001, ****, p < 0.0001). (B) Same as panel A, but confluence was plotted. None of the compounds appears to be toxic at 40 μM. (C) Same experiments as panel A, but Western blot analysis for total αS, normalized to calnexin (loading control). Compounds 7 and 8 reduce αS levels. (D) Representative images (YFP and Bright-Field) for the indicated compounds and concentrations; scale bar = 50 μm.
Fig. 5.
Fig. 5.
Compound 18 reduces inclusion formation in M17D neuroblastoma cells that express inclusion-prone αSynuclein3K::YFP. (A) M17D cells that express an αS3K::YFP fusion protein (dox-inducible) were treated with 0.1% DMSO (vehicle), or compound 18 at 3.75, 7.5, 15, and 30 μM at t = 24 hrs after plating. Then cells were induced with doxycycline at t = 48 hrs. Incucyte-based analysis of punctate YFP signals, normalized to 0.1% DMSO at t = 96 hrs. 6 independent experiments (N = 6) were performed. The data are presented as average ± standard deviation. One-Way ANOVA plus Dunnett’s multiple comparisons test (*, p < 0.1, ***, p < 0.001, ****, p < 0.0001). (B) Same as panel A, but the cell confluence percentage was plotted. Compound 18 does not appear to be toxic at the concentrations tested. (C) Western blot for αS and calnexin (loading control). Total αS/calnexin ratios were plotted, normalized to 0.1% DMSO (N = 2; n = 6, except DMSO, n = 2). Compound 18 affects total αS levels only at 30 μM. D) Representative images (YFP and Bright-Field) for the indicated treatments; scale bar = 50 μm.
Fig. 6.
Fig. 6.
Compound 20 reduces inclusion formation in M17D neuroblastoma cells that express inclusion-prone αSynuclein3K::YFP. (A) M17D cells that express an αS3K::YFP fusion protein (dox-inducible) were treated with 0.1% DMSO (vehicle) or 3.75, 7.5, 15, and 30 μM of compound 20 at t = 24 hrs after plating. Then cells were induced with doxycycline at t = 48 hrs. Incucyte-based analysis of punctate YFP signals, normalized to 0.1% DMSO at t = 96 hrs. 6 independent experiments (N = 6) were performed. The data are presented as average ± standard deviation. One-Way ANOVA plus Dunnett’s multiple comparisons test (*, p < 0.1, **, p < 0.01). (B) Same as panel A, but the cell confluence percentage was plotted. Compound 20 does not appear to be toxic at the concentrations tested. (C) Western blot for αS and calnexin (loading control). Total αS/calnexin ratios were plotted, normalized to 0.1% DMSO (N = 2; n = 6, except DMSO, n = 2). (D) Representative images (YFP and Bright-Field) for the indicated treatments; scale bar = 50 μm.
Fig. 7.
Fig. 7.
Binding poses (top) of ligands (a) 18 and (b) 20 with Tau (PDB ID: 1QAB) plasmid and their 2D representation (bottom) of interaction with amino acids (c and d, respectively).
Scheme 1.
Scheme 1.
Reagents and conditions. 2-Aminofluorene (1 equiv), substituted isocyanate (1.1 equiv), anhydrous dichloromethane, room temperature, 18 h.
Scheme 2.
Scheme 2.
Reagents and conditions: (a) Amine or aniline (1 equiv), substituted aromatic sulfonyl chlorides (1 equiv), triethylamine (1 equiv), anhydrous dichloromethane, room temperature, 8–10 h. (b) Commercially available aniline derivatives (1 equiv), substituted benzene sulfonyl chloride (1.5 equiv), anhydrous pyridine, reflux, 8 h.
Scheme 2.
Scheme 2.
Reagents and conditions: (a) Amine or aniline (1 equiv), substituted aromatic sulfonyl chlorides (1 equiv), triethylamine (1 equiv), anhydrous dichloromethane, room temperature, 8–10 h. (b) Commercially available aniline derivatives (1 equiv), substituted benzene sulfonyl chloride (1.5 equiv), anhydrous pyridine, reflux, 8 h.

References

    1. Hickman S, Izzy S, Sen P, Morsett L, El Khoury J, Microglia in neurodegeneration, Nat. Neurosci. 21 (10) (2018) 1359–1369. - PMC - PubMed
    1. Arriagada PV, Marzloff K, Hyman BT, Distribution of Alzheimer-type pathologic changes in nondemented elderly individuals matches the pattern in Alzheimer’s disease, Neurology 42 (9) (1992) 1681–1688. - PubMed
    1. Braak H, Alafuzoff I, Arzberger T, Kretzschmar H, Del Tredici K, Staging of Alzheimer disease-associated neurofibrillary pathology using paraffin sections and immunocytochemistry, Acta Neuropathol. 112 (4) (2006) 389–404. - PMC - PubMed
    1. Cummings J, Lee G, Mortsdorf T, Ritter A, Zhong K, Alzheimer’s disease drug development pipeline: 2017, Alzheimers Dement 3 (3) (2017) 367–384. - PMC - PubMed
    1. Mehta D, Jackson R, Paul G, Shi J, Sabbagh M, Why do trials for Alzheimer’s disease drugs keep failing? A discontinued drug perspective for 2010–2015, Expert Opin. Investig. Drugs 26 (6) (2017) 735–739. - PMC - PubMed

LinkOut - more resources