. 2022 Oct 20:22:404-422.
doi: 10.1016/j.bioactmat.2022.10.009. eCollection 2023 Apr.

Remodeling of the osteoimmune microenvironment after biomaterials implantation in murine tibia: Single-cell transcriptome analysis

Affiliations

Remodeling of the osteoimmune microenvironment after biomaterials implantation in murine tibia: Single-cell transcriptome analysis

Jia Li et al. Bioact Mater. .

Abstract

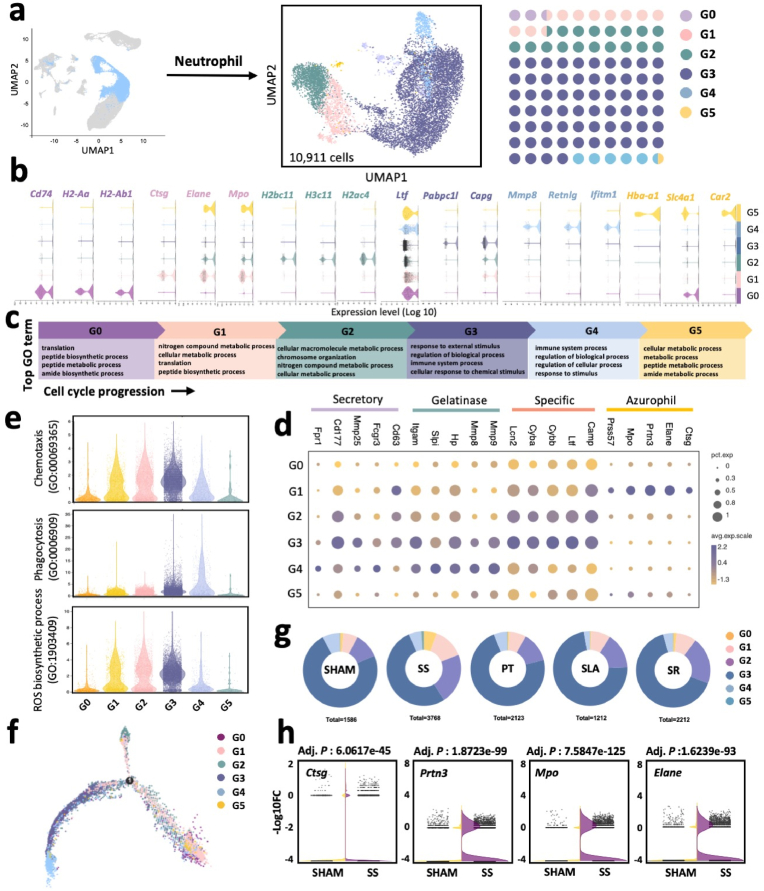
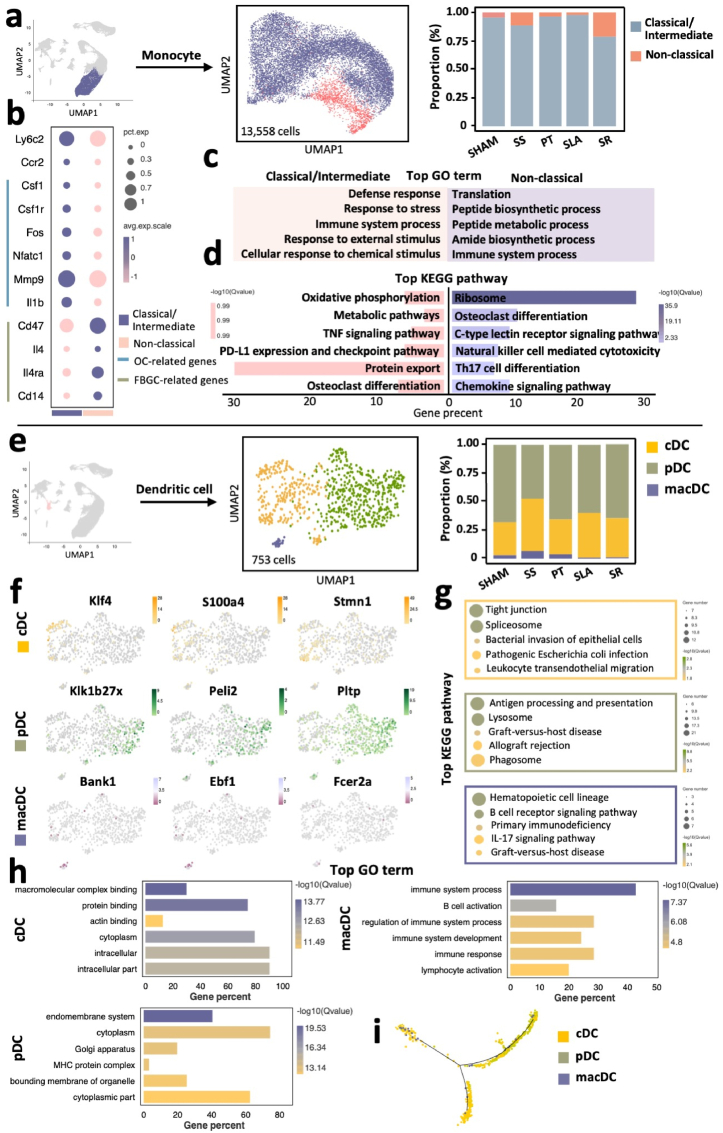
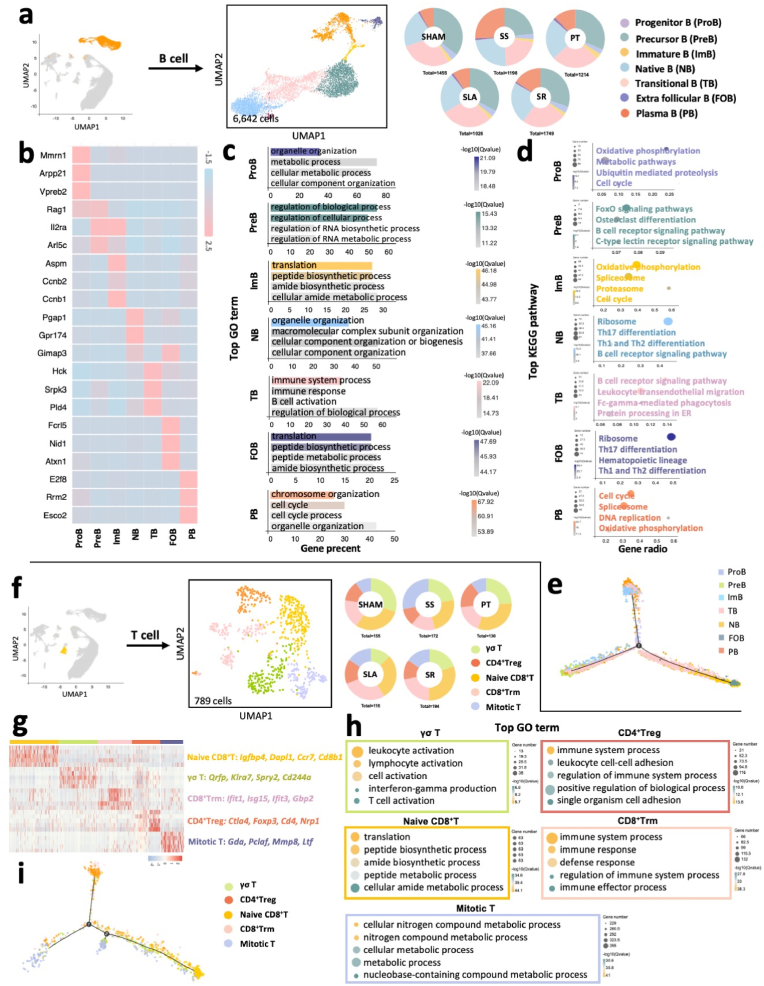
Osseointegration seems to be a foreign body reaction equilibrium due to the complicated interactions between the immune and skeletal systems. The heterogeneity of the osteoimmune microenvironment in the osseointegration of implant materials remains elusive. Here, a single-cell study involving 40043 cells is conducted, and a total of 10 distinct cell clusters are identified from five different groups. A preliminary description of the osteoimmune microenvironment revealed the diverse cellular heterogeneity and dynamic changes modulated by implant properties. The increased immature neutrophils, Ly6C + CCR2hi monocytes, and S100a8hi macrophages induce an aggressive inflammatory response and eventually lead to the formation of fibrous capsule around the stainless steel implant. The enrichment of mature neutrophils, FcgR1hi and differentiated immunomodulatory macrophages around the titanium implant indicates favorable osseointegration under moderate immune response. Neutrophil-depletion mice are conducted to explore the role of neutrophils in osseointegration. Neutrophils may improve bone formation by enhancing the recruitment of BMSCs via the CXCL12/CXCR3 signal axis. These findings contribute to a better knowledge of osteoimmunology and are valuable for the design and modification of 'osteoimmune-smart' biomaterials in the bone regeneration field.

Keywords: BMP2, Bone Morphogenetic Proteins 2; CXCL12, Chemokine (C-X-C mode) Ligand 12; CXCR, CXC Chemokine Receptor; FcgR, Fc Gamma Receptor; IFN-γ, Interferon-gamma; IL-1β, Interleukin-1 beta; Implant; MHC, Major Histocompatibility Complex; MIP, Macrophage inflammatory cytokines; MPO, Myeloperoxidase; NE, Neutrophil Elastase; NF-κB, Nuclear Factor Kappa-light-chain-enhancer of Activated B cells; NOD, Nucleotide Binding Oligomerization Domain; Neutrophil; OPG, Osteoprotegerin; Osseointegration; Osteoimmunology; RANKL, Nuclear Factor B receptor Activator Ligand; RUNX2, Runt-related Transcription Factor 2; S100a8, S100 Calcium Binding Protein A8; SDF-1α, Stromal Cell-derived Factor-1 alpha; STAT, Signal Transduction and Transcription Activator; Single-cell transcriptomics; TLR, Toll Like Receptor; TNFα, Tumor Necrosis Factor-alpha; TRAP, Tartrate Resistant Acid Phosphatase.


Conflict of interest statement

The authors declare that they have no known competing financial interests or personal relationships that could have appeared to influence the work reported in this paper.

Figures

Image 1
Graphical abstract
Fig. 1
Fig. 1
Evaluation of the osseointegration and immunomodulatory property of murine tibiae implanted with four types of implants. a Surface morphology of SS, PT, SLA, SR surfaces. Scale bar: 500 nm b Representative images of hydrophilicity measurement of the SS, PT, SLA, SR surfaces. c Cumulative release profile of Ni2+, Cr2+, Ti2+, and Sr2+ ions from SS, PT, SLA and SR implants after incubation for 21 days. d Workflow of evaluating bone healing of different implants in murine tibiae. e Histological images of the implants (black) and peri-implant bone (pink) formed at 7 and 14 days after implantation. Scale bar: 500 μm f Quantitative analysis of bone-implant contact rate (BIC%). g,h Immunohistochemistry staining of osteogenic-related proteins BMP2 and RUNX2 (brown) after 14 days post-implantation. Scale bar: 100 μm; 250 μm (insert). i,j Semiquantitative analysis of the immunohistochemistry staining of BMP2 and RUNX2. k Principal component analysis (PCA) plot showing the distribution of differentially expressed genes (DEGs) of the bone marrow of the SHAM, SS, PT, SLA, and SR groups (n = 3). l Gene ontology (GO) analysis showing the differentially expressed gene sets enriched in GO term of SR group compared with the SS group. Circle size denotes the gene number in each GO term. m The up-regulated genes of SR group were enriched in osteogenesis-related biological processes, while the immune response-related functions were enhanced in the SS group.
Fig. 2
Fig. 2
Overview of cell heterogeneity in bone marrow three days after implantation by scRNA-seq. a Schematic flow of bone marrow cell collection, cell isolation, capture by droplet-based device, and sequencing. b Three-dimensional scatter diagram visualizing epigenomic profiles at the sample level. c Circle diagram displaying the unsupervised hierarchical cell clusters. In total, 40043 single-cell transcriptomes were collected and classified into 10 cell types. d UMAP plot revealing cell heterogeneity with 10 distinct clusters after cells annotation. General identity and proportion of each cell cluster is defined on the right. e Bar plot showing the proportion of each cell cluster among five groups. f Heatmap of differentially expressed genes. Selected genes for each cluster were color-coded and shown on the right. g Feature plots of expression distribution for cluster-specific genes. Expressed cells were color-coded and overlaid onto the t-SNE plots. Unexpressed cells were colored gray.
Fig. 3
Fig. 3
Transcriptomic analysis reveals distinct expression signatures during neutrophil development. a Subclustering of neutrophils further identified six distinct subclusters. Color-coded UMAP plot showing the definition of each neutrophil subcluster. b Violin plot of differentially expressed marker genes for six neutrophil subclusters. c Enriched gene sets in GO analysis for each neutrophil subcluster. d Expression of genes encoding granule production, assessed in neutrophil subclusters. e Violin plot of chemotaxis (GO:00069365), phagocytosis (GO:0006909), and ROS biosynthetic process (GO: 1903409) scores for subclusters. f Pseudo-temporal ordering of neutrophil subclusters along the trajectory with the distinctly differentiated cell subcluster. Different colors represent different subclusters. g Circle diagrams depicting the percentage of each neutrophil subcluster in the SHAM, SS, PT, SLA, and SR groups. h Gene pod plot showing the different expression levels between SS and SHAM groups.
Fig. 4
Fig. 4
Subclustering of macrophages reveals cell heterogeneity induced by implant materials. a Subclustering of macrophages further identified five distinct subclusters. Visualized UMAP plot of macrophages is shown color-coded. b Violin plots of distinct phenotypic signatures for each macrophage subcluster. c Expression of canonical phenotype marker genes of inflammatory, tissue repair, and resolving macrophages. d Circle diagrams depicting the proportion of each macrophage subcluster in the SHAM, SS, PT, SLA, and SR groups. e Pseudo-temporal ordering of macrophages and the definition of subcluster along the trajectory with the pseudo-time information (up), distinctly differentiated subcluster (middle), and sample information (down), respectively. f,g Up-regulated genes in the IL-17 signaling pathway, oxidative phosphorylation, necroptosis, chemokine signaling pathway, phagosome, antigen process and presentation among macrophages, each point is depicted as a single cell. Cells with indicated signaling activation were colored in shades of purple-red, and those without signaling activation were colored in yellow. Boxplots between the targeted macrophages subcluster and the remaining four subclusters were shown on the right, the lists of genes used to compute enrichment are according to KEGG: ko00190 (oxidative phosphorylation), ko04657 (IL-17signaling pathway), ko04217 (necroptosis), ko04062 (chemokine signaling pathway), ko04145 (phagosome), ko04612 (antigen process and presentation).
Fig. 5
Fig. 5
Monocytes and DCs accelerated the differentiation process after implantation. a Subclustering of monocytes further identified two distinct subclusters. Color-coded UMAP plot was shown and each monocyte subcluster was defined on the right. b Dot plot of specially expressed genes for monocyte subclusters. c, d Enriched gene sets of classical/intermediate and non-classical monocytes in top GO term (c) and top KEGG pathway (d). e Subclustering of DCs further identified three distinct subclusters with visualized UMAP plot. f Feature plots depicting single cell expression of identified genes in DCs. g Enriched gene sets of DCs in top KEGG pathway. h Top GO terms of DC subclusters. i Pseudo-temporal ordering of three subclusters of DCs along the trajectory.
Fig. 6
Fig. 6
B and T lymphocytes harbor various distinct types. a Visualized UMAP plot of B cell subclusters and circle diagrams depicting the component of B cell subclusters in the SHAM, SS, PT, SLA, and SR groups. b Heatmap of marker genes transcription for each B subcluster. c,d Enriched gene sets of B cell subclusters in GO analysis (c) and KEGG pathway (d). e Pseudo-temporal ordering of seven B cell subclusters along the trajectory. f Visualized UMAP plot of T cell subclusters with circle diagrams depicting the composition of T cell subclusters. g Heatmap of marker gene transcription for each T subcluster. h GO enrichment analysis of the biological functions of each T subcluster. i Pseudo-temporal ordering of five T cell subclusters along the trajectory.
Fig. 7
Fig. 7
Cell-cell interaction analysis builds a bridge between neutrophils and hematopoietic stem cells and neutrophils play a promotive role in osseointegration. a Heatmap showing the number of interactions among ten cell clusters. b Chord diagram of cellular communication relationship among ten cell clusters. Networks depicting cell types as nodes and interactions as edges. Edge thickness is proportional to the number of interactions between the connecting types. c Chord diagram visualizing the top 10 ligand-receptor pairs between neutrophils and HSCs. d Three-dimensional reconstruction images of the bone formation after implantation in vivo, green volumes represented bone tissue. e, f Analysis of BV/TV (e), Tb.Th (f) in each group. *P < 0.05, **P < 0.01, ***P < 0.001 compared with the Ctrl group (n = 5). BV/TV, bone volume/total volume; Tb.Th, trabecular thickness. g Representative images of Masson staining showing the bone regeneration after implantation. Scale bar: 250 μm; 750 μm (insert). h Immunohistochemistry staining of RUNX2 (brown) at the implantation site after 14 days. Scale bar: 100 μm; 250 μm (insert). i Semiquantitative analysis of the immunohistochemistry staining of RUNX2. j Secretion of CXCL12 in the extract from neutrophils cultured on the glass (as Ctrl), SS, PT, SLA, and SR surfaces was detected by ELISA assay. k Representative images of the transwell assay. BMSCs were treated with neutrophil extracts with or without a CXCR3 receptor antagonist (SCH546738). Scale bar: 200 μm l Quantitative analysis of migrated cells among different groups. m Representative images of immunofluorescence staining showing the expression of CXCR3 of BMSCs after 24 h cultured with neutrophils extracts. Scale bar: 20 μm; 100 μm (insert). n Semiquantitative analysis of the mean immunofluorescence intensity of CXCR3. o Western blotting of CXCR3 and β-Actin of BMSCs after 24 h cultured with neutrophils extracts. p Quantitative analysis of the relative level of CXCR3/β-Actin.
Fig. 8
Fig. 8
Cell mapping centered on the osteoimmune microenvironment after implantation. a Sc-RNA seq analysis of cell heterogeneity and temporal changes in the osteoimmune microenvironment after implantation. b Bone immune responses and prognosis of SS and SR implants. In this figure, major differences in innate immune cell subclusters were shown. Neutrophils may promote the effective homing of BMSCs through the CXCL12-CXCR3 signaling axis. OC: osteoclast; OB: osteoblast; FBGC: foreign body giant cell; BMSC: bone mesenchymal stem cell.

References

    1. Wang J.L., Xu J.K., Hopkins C., Chow D.H., Qin L. Biodegradable magnesium-based implants in orthopedics-A general review and perspectives. Adv. Sci. 2020;7 doi: 10.1002/advs.201902443. - DOI - PMC - PubMed
    1. Trindade R., Albrektsson T., Tengvall P., Wennerberg A. Foreign body reaction to biomaterials: on mechanisms for buildup and breakdown of osseointegration. Clin. Implant Dent. Relat. Res. 2016;18:192–203. doi: 10.1111/cid.12274. - DOI - PubMed
    1. Ley K. M1 means kill; M2 means heal. J. Immunol. 2017;199:2191–2193. doi: 10.4049/jimmunol.1701135. - DOI - PubMed
    1. Fridlender Z.G., Sun J., Kim S., Kapoor V., Cheng G., Ling L., Worthen G.S., Albelda S.M. Polarization of tumor-associated neutrophil phenotype by TGF-beta: "N1" versus "N2" TAN. Cancer Cell. 2009;16:183–194. doi: 10.1016/j.ccr.2009.06.017. - DOI - PMC - PubMed
    1. Olmsted-Davis E., Mejia J., Salisbury E., Gugala Z., Davis A.R. A population of M2 macrophages associated with bone formation. Front. Immunol. 2021;12 doi: 10.3389/fimmu.2021.686769. - DOI - PMC - PubMed