. 2022 Oct;2(10):1282-1292.
doi: 10.1158/2767-9764.crc-22-0314. Epub 2022 Oct 27.

Uterine lavage identifies cancer mutations and increased TP53 somatic mutation burden in individuals with ovarian cancer

Affiliations

Uterine lavage identifies cancer mutations and increased TP53 somatic mutation burden in individuals with ovarian cancer

Talayeh S Ghezelayagh et al. Cancer Res Commun. 2022 Oct.

Abstract

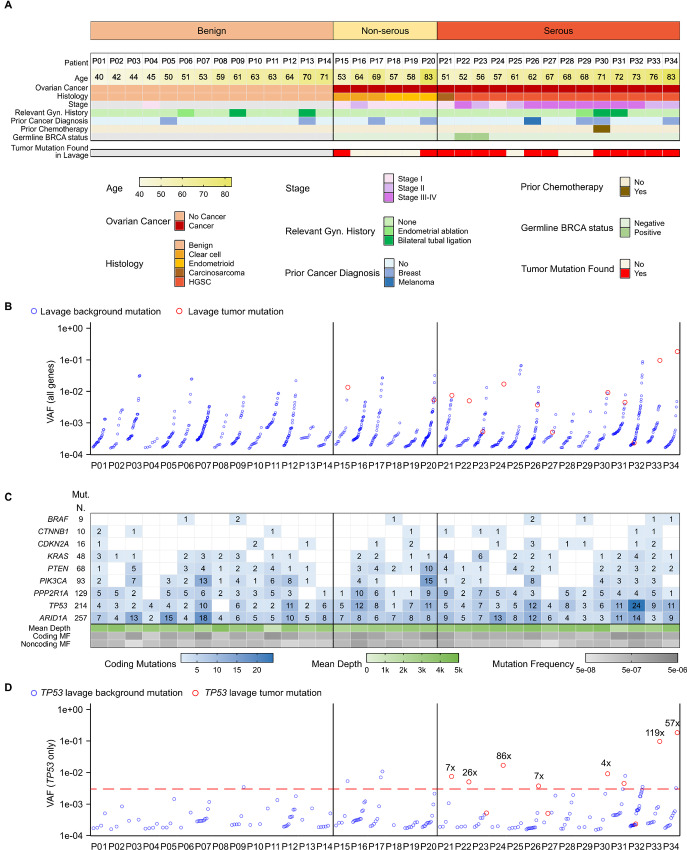
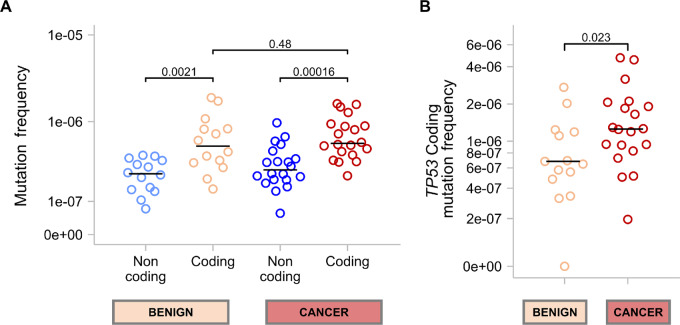
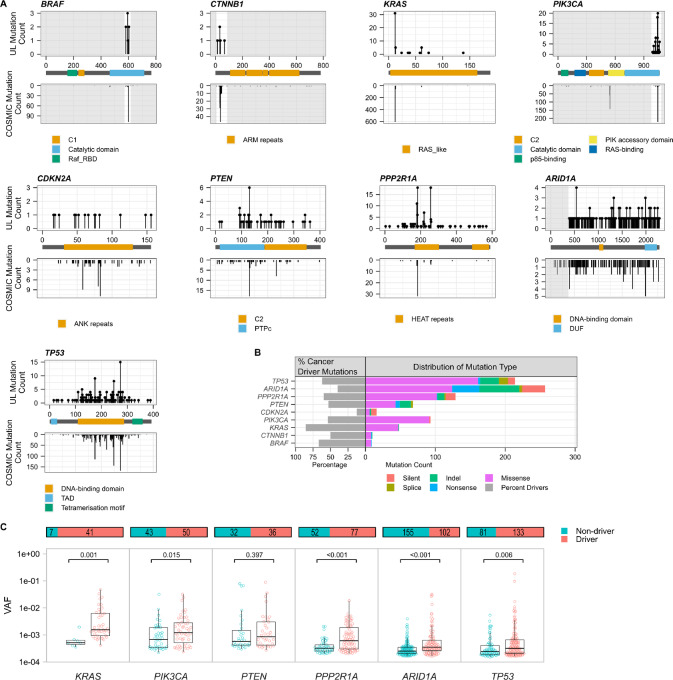
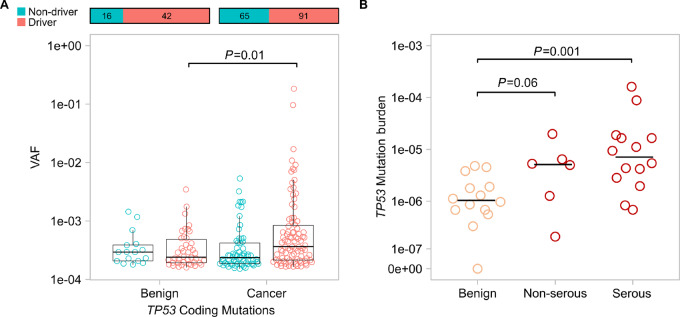
Current screening methods for ovarian cancer (OC) have failed to demonstrate a significant reduction in mortality. Uterine lavage combined with TP53 ultra-deep sequencing for the detection of disseminated OC cells has emerged as a promising tool, but this approach has not been tested for early-stage disease or non-serous histologies. In addition, lavages carry multiple background mutations, the significance of which is poorly understood. Uterine lavage was collected preoperatively in 34 patients undergoing surgery for suspected ovarian malignancy including 14 patients with benign disease and 20 patients with OC (6 non-serous and 14 high grade serous-like (serous)). Ultra-deep duplex sequencing (~3000x) with a panel of common OC genes identified the tumor mutation in 33% of non-serous (all early stage) and in 79% of serous cancers (including four early stage). In addition, all lavages carried multiple somatic mutations (average of 25 mutations per lavage), more than half of which corresponded to common cancer driver mutations. Driver mutations in KRAS, PIK3CA, PTEN, PPP2R1A and ARID1A presented as larger clones than non-driver mutations and with similar frequency in lavages from patients with and without OC, indicating prevalent somatic evolution in all patients. Driver TP53 mutations, however, presented as significantly larger clones and with higher frequency in lavages from individuals with OC, suggesting that TP53-specific clonal expansions are linked to ovarian cancer development. Our results demonstrate that lavages capture cancer cells, even from early-stage cancers, as well as other clonal expansions and support further exploration of TP53 mutation burden as a potential OC risk factor.

Keywords: Uterine lavage; clonal expansions; ovarian cancer; somatic evolution.


Conflict of interest statement

H.J. Gray reports other from UpToDate outside the submitted work. J.B. Liao reports grants from Merck, Precigen, AstraZeneca, Forty-Seven, Sumitomo Dainippon Pharma Oncology, Laekna Therapeutics, Instil Bio, Harpoon Therapeutics, and Genentech outside the submitted work. P. Speiser reports a patent to Three Lumen Balloon Catheter Apparatus US2015305725 issued and a patent to Non-Invasive Cancer Diagnosis EP51899 20130131 issued; and is shareholder of OVARTEC GmbH. E.M. Swisher reports grants from NIH during the conduct of the study. R.A. Risques reports grants from NCI, Rivkin Center, Minnesota Ovarian Cancer Alliance; and personal fees and other from TwinStrand Biosciences during the conduct of the study; grants from NCI and Rivkin Center; other from NanoString Technologies; and personal fees, non-financial support, and other from TwinStrand Biosciences outside the submitted work; in addition, R.A. Risques has a patent to WO/2018/175997 pending, licensed, and with royalties paid. No disclosures were reported by the other authors.

Figures

FIGURE 1
FIGURE 1
Summary of mutations identified in lavages from patients with and without ovarian cancer. A, Clinicopathological characteristics of the patients are color coded according to the legend. Patients are sorted by ascending age within each histologic group. For patients with ovarian cancer, it is indicated whether the tumor mutation was found in the uterine lavage. B, The VAF for all mutations detected in uterine lavage samples is displayed. Red circles correspond to tumor mutations and blue circles correspond to other background mutations, sorted by ascending VAF within each patient. C, The total number of mutations identified for each gene in lavage samples is indicated (Mut. N) as well as the number of mutations in each lavage (blue gradient boxes). The mean depth of sequencing for coding exons is indicated with a gradient scale in green. Coding and noncoding MF, corresponding to the count of unique mutations adjusted by nucleotides sequenced, are indicated with a gradient scale in gray. D, The VAF for all TP53 mutations detected in each uterine lavage sample is displayed, with the red circles indicating tumor mutations. The ratio of the VAF of the tumor mutation to the VAF of the largest background mutation is indicated if >4x. Red line indicates a potential VAF cutoff of 0.003.
FIGURE 2
FIGURE 2
Comparison of MF in patients with and without ovarian cancer. MF is calculated by dividing the number of mutations detected by the number of nucleotides sequenced. Each circle represents the MF for an individual sample. P values for Mann–Whitney U tests are shown for each comparison. The median MF for each group is indicated with a horizontal black bar. A, Comparison of coding and noncoding MF for all sequenced genes combined in uterine lavages from benign and cancer cases. B, Comparison of TP53-specific coding MF between benign and cancer cases.
FIGURE 3
FIGURE 3
Characterization of uterine lavage mutations by gene. A, The location and distribution of mutations in uterine lavage samples mirror those identified in ovarian carcinomas. Top panels show the location by codon position of somatic mutations identified in uterine lavage, with mutation counts plotted on the Y axis. Lower panels show mutations identified in ovarian carcinomas in COSMIC. Indels are excluded as they might span multiple codon locations. Areas of the gene not captured in the DS panel are grayed out. Gene domains are highlighted in the legends. B, Percentage of cancer driver mutations identified for each gene in the entire cohort (left) and distribution of mutation type per gene (right). Cancer driver mutations are defined, in oncogenes, as substitutions occurring in common hotspots codons and, in tumor suppressor genes, as substitutions occurring in common hotspots codons plus insertion/deletions, nonsense, and splice mutations. C, The VAF of driver versus non-driver mutations identified in the entire cohort is displayed by gene. Only genes that exhibited mutations in >50% of the uterine lavage samples are shown. Each circle represents a unique mutation. Overlying box plots display the quartiles with whiskers extending up to 1.5× the interquartile range. Bar plots above display the total number of mutations in each group and the distribution between driver and non-driver. P values correspond to Mann–Whitney U tests.
FIGURE 4
FIGURE 4
Uterine lavages from patients with ovarian cancer carry more large clones with TP53 driver mutations and show higher TP53 mutation burden than lavages from patients without cancer. A, Comparison of VAF of TP53 driver mutations in lavage DNA from patients with and without ovarian cancer. Cancer driver mutations in TP53 include substitutions occurring in common hotspots codons plus insertion/deletions, nonsense, and splice mutations. Each circle corresponds to a unique mutation. Overlying box plot displays the quartiles with whiskers extending up to 1.5× the interquartile range. Bar plots above display the total number of mutations in each group and the distribution between driver and non-driver. P values correspond to Mann–Whitney U test comparing the distribution of VAF of cancer driver mutations between patients with benign and cancer. B,TP53 mutation burden, calculated as the total number of TP53-mutant molecules identified in a lavage divided by the total number of nucleotides sequenced, is compared between patients with benign disease, non-serous ovarian cancer, and serous ovarian cancer (high-grade serous and carcinosarcoma). Each circle corresponds to an individual uterine lavage sample. Horizontal bars indicate the median for each group and P values correspond to Mann–Whitney U tests.

References

    1. Siegel RL, Miller KD, Jemal A. Cancer statistics, 2020. CA Cancer J Clin 2020;70:7–30. - PubMed
    1. Sung H, Ferlay J, Siegel RL, Laversanne M, Soerjomataram I, Jemal A, et al. . Global cancer statistics 2020: GLOBOCAN estimates of incidence and mortality worldwide for 36 cancers in 185 countries. CA Cancer J Clin 2021;71:209–49. - PubMed
    1. Ovary SEER 5-Year Relative Survival Rates, 2012–2018. Surveillance, Epidemiology, and End Results (SEER) Program Populations (1969–2020) (www.seer.cancer.gov/popdata), National Cancer Institute, DCCPS, Surveillance Research Program; 2022.
    1. Buys SS, Partridge E, Black A, Johnson CC, Lamerato L, Isaacs C, et al. . Effect of screening on ovarian cancer mortality: the Prostate, Lung, Colorectal and Ovarian (PLCO) Cancer Screening Randomized Controlled Trial. JAMA 2011;305:2295–303. - PubMed
    1. Jacobs IJ, Menon U, Ryan A, Gentry-Maharaj A, Burnell M, Kalsi JK, et al. . Ovarian cancer screening and mortality in the UK Collaborative Trial of Ovarian Cancer Screening (UKCTOCS): a randomised controlled trial. Lancet 2016;387:945–56. - PMC - PubMed

Publication types

Substances