. 2022 Oct 21:2022:9525227.
doi: 10.1155/2022/9525227. eCollection 2022.

Impact of One-Week Administration of Dihydrotestosterone in Rat Anterior Pituitary Gland

Affiliations

Impact of One-Week Administration of Dihydrotestosterone in Rat Anterior Pituitary Gland

Haruhiko Kanasaki et al. Int J Endocrinol. .

Abstract

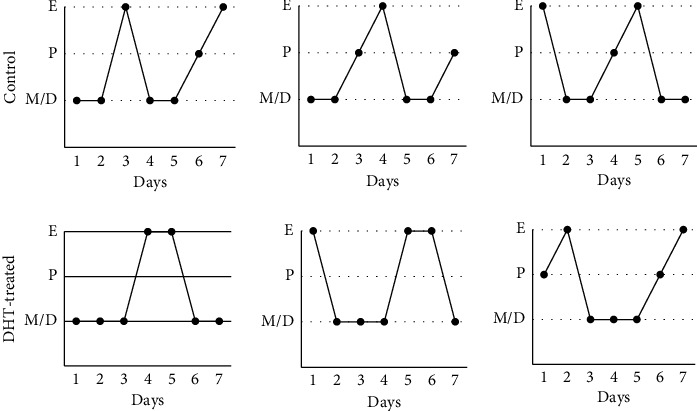
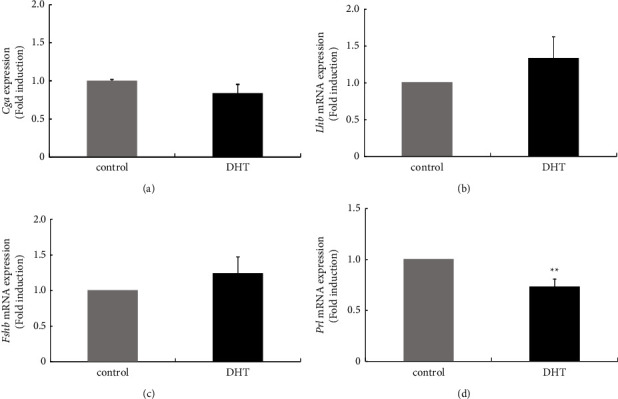
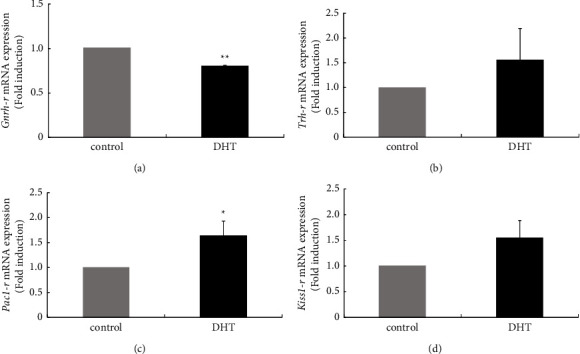
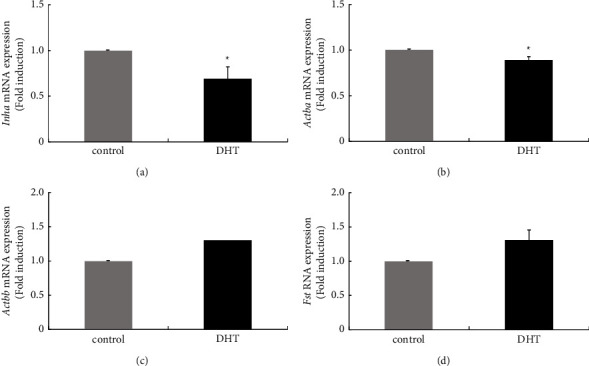
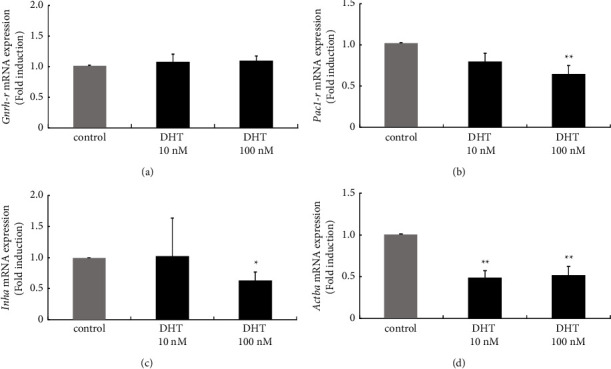
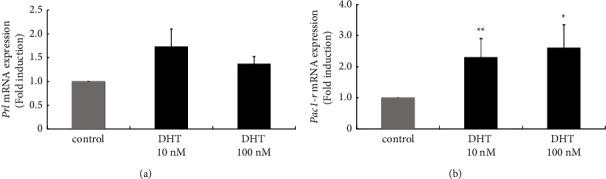
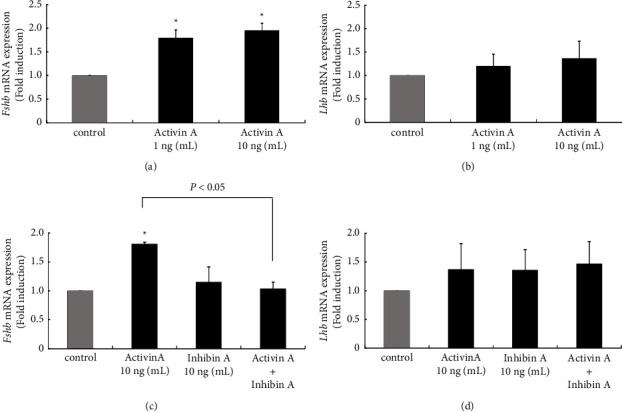
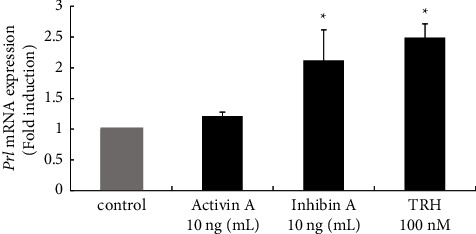
Hyperandrogenism causes dysfunction of the hypothalamic-pituitary-gonadal (HPG) axis in reproductive women. In this study, we examined the effects of dihydrotestosterone (DHT) on characteristic changes in rat anterior pituitary gland samples. DHT was administered to ovary-intact 6-week postnatal female rats for 7 days, after which the anterior pituitary glands were examined and compared with those in control rats. Estrous cyclicity was not drastically disrupted by DHT treatment. Common gonadotropin α subunit (Cga), luteinizing hormone β subunit (Lhb), and follicle-stimulating hormone (FSH) β subunit (Fshb) gene expression levels were not modulated by DHT treatment, while prolactin (Prl) gene expression was significantly repressed by DHT. Gonadotropin-releasing hormone (GnRH) receptor (Gnrh-r) gene expression was significantly inhibited by DHT, whereas pituitary adenylate cyclase-activating polypeptide (PACAP) receptor (Pca1-r) gene expression was increased by DHT. Gene expression levels of the receptors encoded by thyrotropin-releasing hormone (Trh-r) and kisspeptin (Kiss1-r) genes were unchanged. Expression of inhibin α subunit (Inha) and activin βA subunits (Actba) within the pituitary was inhibited by DHT treatment, while activin B subunit (Actbb) and follistatin (Fst) gene expression was unchanged by DHT. In mouse pituitary gonadotroph LβT2 cells, DHT did not modulate the gene expression of Gnrh-r, but it inhibited the expression of Inha and Actba subunits within the LβT2 cells. In rat prolactin-producing GH3 cells, DHT did not modulate prolactin gene expression, but it increased Pac1-r gene expression. The present observations suggest that DHT directly or indirectly affects the anterior pituitary gland and induces characteristic changes in hormone-producing cells.


Conflict of interest statement

The authors declare that there are no conflicts of interest.

Figures

Figure 1
Figure 1
Estrous cyclicity in control and DHT-treated rats. Six-week-old female rats were injected subcutaneously with DHT (5 mg/kg/day) daily. Vaginal smears were collected daily to evaluate estrous cyclicity during treatment. However, DHT-treated rats still showed estrous cyclicity similar to that of control rats. Three representative cycles in control and DHT-treated rats are shown.
Figure 2
Figure 2
Effect of dihydrotestosterone (DHT) administration on gene expression of pituitary gonadotropin subunits and prolactin. Six-week-old female rats were injected subcutaneously with DHT (5 mg/kg/day) daily for 7 days. After the rats were euthanized, the anterior pituitary was removed from nontreated (n = 4) and DHT-treated rats (n = 4), and then, mRNA was extracted from the anterior pituitary tissue and reverse transcribed. The mRNA levels of Cga (a), Lhb (b), and Fshb (c) subunits and prolactin were measured by quantitative RT-PCR. Samples from each experimental group were run in duplicate and normalized to the mRNA levels of the housekeeping gene Gapdh. The results are expressed as fold induction over the control and presented as the mean ± SEM. ∗∗P < 0.01 versus control.
Figure 3
Figure 3
Effect of dihydrotestosterone (DHT) administration on receptor expression of hypothalamic peptides in the pituitary. Six-week-old female rats were injected subcutaneously with DHT (5 mg/kg/day) daily for 7 days. After the rats were euthanized, the anterior pituitary was removed from nontreated (n = 4) and DHT-treated rats (n = 4), and then mRNA was extracted from the anterior pituitary tissue and reverse transcribed. Gnrh-r (a), Trh-r (b), Pac1-r (c), and Kiss1-r (d) mRNA levels were measured by quantitative RT-PCR. Samples from each experimental group were run in duplicate and normalized to the mRNA levels of the housekeeping gene Gapdh. The results are expressed as fold induction over the control and presented as the mean ± SEM. ∗∗P < 0.01, P < 0.05 versus the control.
Figure 4
Figure 4
Effect of dihydrotestosterone (DHT) administration on the gene expression of inhibin/activin subunits and follistatin in the anterior pituitary. Six-week-old female rats were injected subcutaneously with DHT (5 mg/kg/day) daily for 7 days. After the rats were euthanized, the anterior pituitary was removed from nontreated (n = 4) and DHT-treated rats (n = 4), and then mRNA was extracted from the anterior pituitary tissue and reverse transcribed. Inha (a), Actba (b), Actbb (c), and Fst (d) mRNA levels were measured by quantitative RT-PCR. Samples from each experimental group were run in duplicate and normalized to the mRNA levels of Gapdh. The results are expressed as fold induction over the control and presented as the mean ± SEM. P < 0.05 versus the control.
Figure 5
Figure 5
Effect of dihydrotestosterone (DHT) stimulation on the gene expression of GnRHR, PAC1R, and inhibin subunits in gonadotroph LβT2 cells. LβT2 cells were stimulated with the indicated concentrations of DHT for 24 h After stimulation, mRNA was extracted and reverse transcribed, and mRNA levels of Gnrh-r (a), Pac1-r (b), and Inha (c) and Actba were measured by quantitative RT-PCR. Samples from each experimental group were run in duplicate and normalized to the mRNA levels of the housekeeping gene Gapdh. The results are expressed as fold induction over unstimulated cells and presented as the mean ± SEM of three independent experiments. ∗∗P < 0.01, P < 0.05 versus control.
Figure 6
Figure 6
Effect of dihydrotestosterone (DHT) stimulation on Prl and Pac1-r gene expression in rat somatolactotroph GH3 cells. GH3 cells were stimulated with the indicated concentrations of DHT for 24 h After stimulation, mRNA was extracted and reverse transcribed, and Prl (a) and Pac1-r (b) mRNA levels were measured by quantitative RT-PCR. Samples from each experimental group were run in duplicate and normalized to the mRNA levels of the housekeeping gene Gapdh. The results are expressed as fold induction over unstimulated cells and presented as the mean ± SEM of three independent experiments. ∗∗P < 0.01, P < 0.05 versus control.
Figure 7
Figure 7
Effect of activin A and inhibin A on gene expression of gonadotropin subunits in gonadotroph LβT2 cells. LβT2 cells were stimulated with the indicated concentrations of activin (a) inhibin (b) or together with activin A and inhibin B for 24 h After stimulation, mRNA was extracted and reverse transcribed, and mRNA levels of Fshb (A, C) and Lhb (B, D) subunit genes were measured by quantitative RT-PCR. Samples from each experimental group were run in duplicate and normalized to the mRNA levels of the housekeeping gene Gapdh. The results are expressed as fold induction over unstimulated cells and are presented as the mean ± SEM of three independent experiments. P < 0.05 versus the control. The difference between activin A and activin A+ inhibin A on Fshb mRNA was statistically different (P < 0.05).
Figure 8
Figure 8
Effect of activin A and inhibin A on Prl gene expression in lactotroph GH3 cells. GH3 cells were stimulated with the indicated concentrations of activin A or inhibin A for 24 h After stimulation, mRNA was extracted and reverse transcribed, and Prl mRNA levels were measured by quantitative RT-PCR. Samples from each experimental group were run in duplicate and normalized to the mRNA levels of the housekeeping gene Gapdh. The results are expressed as fold induction over unstimulated cells and are presented as the mean ± SEM of three independent experiments. P < 0.05 versus the control.

Similar articles

References

    1. Yildiz B. O. Diagnosis of hyperandrogenism: clinical criteria. Best Practice & Research Clinical Endocrinology & Metabolism . 2006;20(2):167–176. doi: 10.1016/j.beem.2006.02.004. - DOI - PubMed
    1. Matheson E., Bain J. Hirsutism in women. American Family Physician . 2019;100(3):168–175. - PubMed
    1. Skiba M. A., Islam R. M., Bell R. J., Davis S. R. Understanding variation in prevalence estimates of polycystic ovary syndrome: a systematic review and meta-analysis. Human Reproduction Update . 2018;24(6):694–709. doi: 10.1093/humupd/dmy022. - DOI - PubMed
    1. Peigne M., Villers-Capelle A., Robin G., Dewailly D. [Hyperandrogenism in women] Presse Medicale . 2013;42(11):1487–1499. doi: 10.1016/j.lpm.2013.07.016. - DOI - PubMed
    1. Teede H. J., Misso M. L., Costello M. F., et al. Recommendations from the international evidence-based guideline for the assessment and management of polycystic ovary syndrome. Human Reproduction . 2018;33(9):1602–1618. doi: 10.1093/humrep/dey256. - DOI - PMC - PubMed