Review
. 2022 Oct 12;9(10):220792.
doi: 10.1098/rsos.220792. eCollection 2022 Oct.

Distinctive diets of eutherian predators in Australia

Affiliations
Review

Distinctive diets of eutherian predators in Australia

Patricia A Fleming et al. R Soc Open Sci. .

Abstract

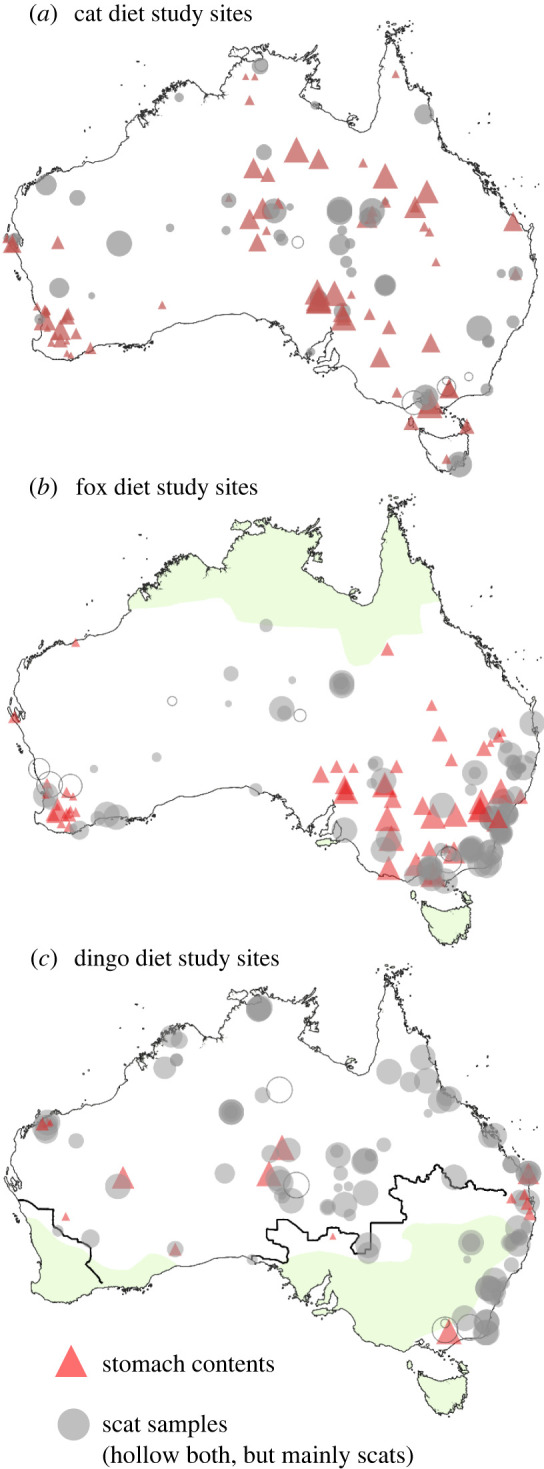
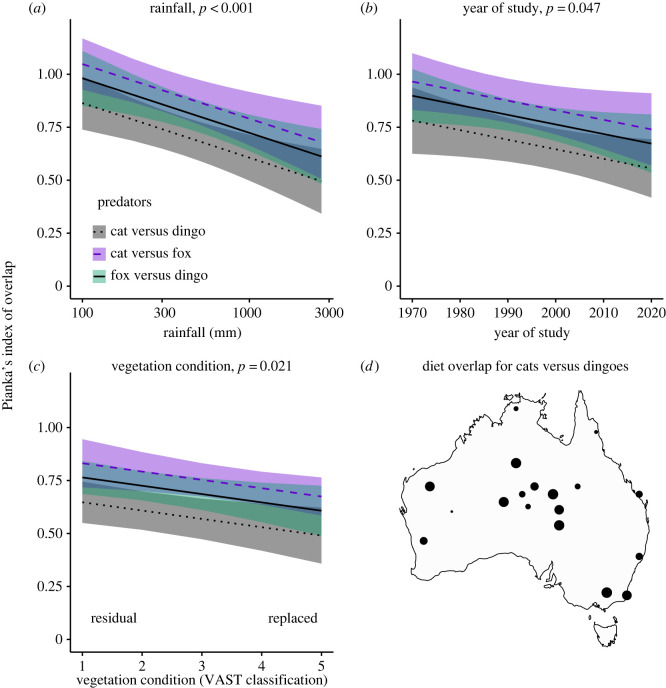
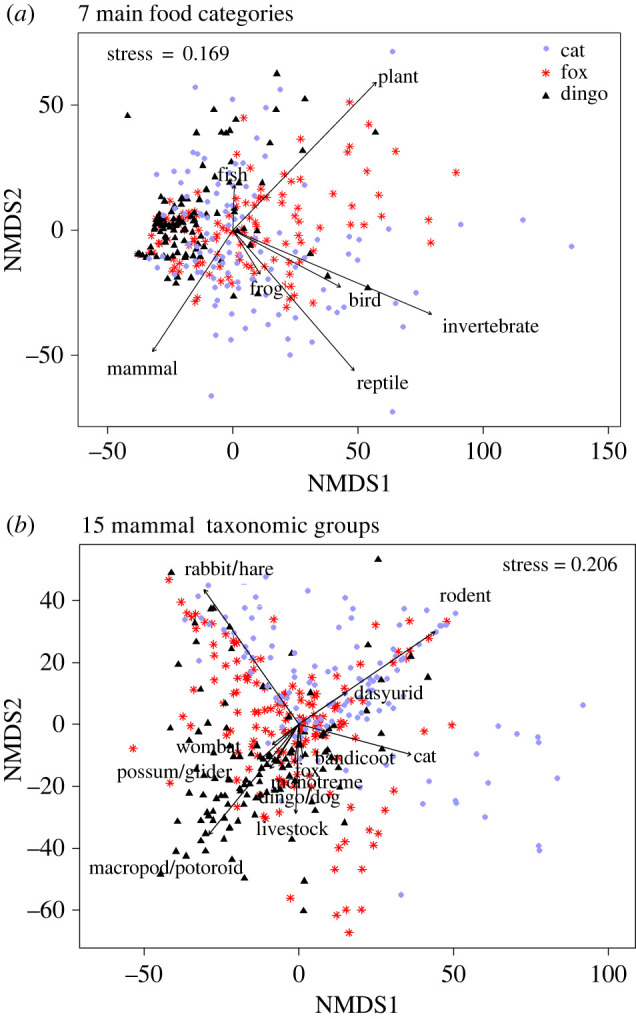
Introduction of the domestic cat and red fox has devastated Australian native fauna. We synthesized Australian diet analyses to identify traits of prey species in cat, fox and dingo diets, which prey were more frequent or distinctive to the diet of each predator, and quantified dietary overlap. Nearly half (45%) of all Australian terrestrial mammal, bird and reptile species occurred in the diets of one or more predators. Cat and dingo diets overlapped least (0.64 ± 0.27, n = 24 location/time points) and cat diet changed little over 55 years of study. Cats were more likely to have eaten birds, reptiles and small mammals than foxes or dingoes. Dingo diet remained constant over 53 years and constituted the largest mammal, bird and reptile prey species, including more macropods/potoroids, wombats, monotremes and bandicoots/bilbies than cats or foxes. Fox diet had greater overlap with both cats (0.79 ± 0.20, n = 37) and dingoes (0.73 ± 0.21, n = 42), fewer distinctive items (plant material, possums/gliders) and significant spatial and temporal heterogeneity over 69 years, suggesting the opportunity for prey switching (especially of mammal prey) to mitigate competition. Our study reinforced concerns about mesopredator impacts upon scarce/threatened species and the need to control foxes and cats for fauna conservation. However, extensive dietary overlap and opportunism, as well as low incidence of mesopredators in dingo diets, precluded resolution of the debate about possible dingo suppression of foxes and cats.

Keywords: Canis familiaris; Felis catus; Vulpes vulpes; invasive species; niche separation; resource partitioning.


Conflict of interest statement

None of the authors have a conflict of interest to declare.

Figures

Figure 1.
Figure 1.
Locations of diet studies examined in this study for the domestic cat (Felis catus), red fox (Vulpes vulpes) and dingo (Canis familiaris) in Australia. Symbol size is proportional to the number of samples. Shaded areas represent absences/scarcity for foxes [16] and dingoes [83]. Studies of cat diet were somewhat uniformly distributed across the mainland and islands. Feral cats are found across the entire continent (except some predator free reserves). Foxes are largely absent from the northern tropics of the continent (green shaded area) and occur at greater densities in southwestern and southeastern forest areas as well as around cities [16]; as a natural consequence of their geographical range, there was a greater density of fox diet studies carried out in these general areas. The dingo has been removed from around sheep production landscapes (green shaded area) and accordingly there were few dingo diet studies in intensive agricultural zones southwest of the State Barrier Fence in Western Australia and south of the Dingo Barrier Fence (dark lines) where dingoes are either absent or scarce as a consequence of widespread intensive control/exclusion [83]. Both foxes and dingoes are absent from Tasmania.
Figure 2.
Figure 2.
Mammal prey traits associated with their average FOO in diets of the (a,b) domestic cat (Felis catus), (c,d) red fox (Vulpes vulpes) and (e,f) dingo (Canis familiaris) in Australia. Predictions are from a regression analysis using the ggpredict function comparing the traits of individual mammal species with their average FOO in the diets of each predator, plotted with all other traits held at their mean or median values. Black lines against the x-axis for the left-hand panel indicate prey body masses that are likely to reflect scavenging of carrion by these predators.
Figure 3.
Figure 3.
Cumulative predicted likelihood (based on presence/absence) for individual (a) mammal, (b) bird and (c) squamate reptile prey species being recorded in diet studies of the domestic cat (Felis catus), red fox (Vulpes vulpes) and dingo (Canis familiaris) in Australia, shown against the prey species' body mass. Predictions are from a logistic regression analysis using the ggpredict function comparing the traits of individual species with the likelihood that they have been reported present in the diets of one of the three predators, plotted with all other traits held at their mean or median values. Black line against the x-axis in (a) indicates the ‘critical weight range’ for mammals (35 g–5.5 kg that are now extinct or threatened [–14]).
Figure 4.
Figure 4.
Summary of top factors correlated with diet overlap (Pianka's index of overlap) for pairs of predators, where 0 = entirely different foods consumed, and 1 = diet is the same. Lines show the predicted relationships (plus 95% confidence intervals) generated using ggpredict. Dots in (d) represent index of dietary overlap.
Figure 5.
Figure 5.
Nonmetric multidimensional scaling plots for dietary composition of the introduced domestic cat (Felis catus), red fox (Vulpes vulpes) and dingo (Canis familiaris) in Australia analysed as (a) seven main food categories and (b) 15 mammal taxonomic groups.
Figure 6.
Figure 6.
Ternary plot of diet composition for the domestic cat (Felis catus), red fox (Vulpes vulpes) and dingo (Canis familiaris) in Australia. Prey in the centre of the plot are consumed by all three species. Those towards each corner of the plot are consumed by one predator more than the other two. Relative size of circles represent relative total abundance in the diets of these three predators. Taxa shown are Ba, Bat; B, Bird; BB, Bandicoot; D, Dasyurid; Fi, Fish; Fr, Frog; I, Invertebrate; IR, Introduced Rodent; K, Koalas; L, Livestock; Mo, Monotreme; MP, Macropod/Potoroid; No, Marsupial moles; NR, Native Rodent; P, Plant; PG, Possum/Glider; R, Reptiles; RH, Rabbit/Hare; W, Wombat.
Figure 7.
Figure 7.
(a) Change over time in the FOO of lagomorphs (principally European rabbit Oryctolagus cuniculus) in the diets of the domestic cat (Felis catus), red fox (Vulpes vulpes) and dingo (Canis familiaris) in Australia. (b) Data shown by periods before and then after the introduction of Rabbit Haemorrhagic Disease Virus (RHDV) in 1996 [65,120], and then after introduction of more lethal strains of the virus since 2010 [121,122] (vertical lines in (a)). Studies that spanned the introduction of RHDV were not included in (b). Letters in (b) link time periods that are not significantly different (Tukey's post-hoc analysis following a generalized linear model).
Figure 8.
Figure 8.
Prey types that are distinctive to the diets of the domestic cat (Felis catus), red fox (Vulpes vulpes) and dingo (Canis familiaris) in Australia. Images show (a) predation on Pilbara leaf-nosed bat (Rhinonicteris aurantia (Pilbara form) (J.E. Gray) ) by a feral cat (Photo credit Biologic Environmental Survey), (b) common ringtail possum (Pseudocheirus peregrinus) by fox (Photo credit Pavel German, australiannature.com) and (c) red kangaroo (Osphranter rufus) by a group of dingoes (Photo credit Peter Adams, Western Australia Department of Primary Industries and Regional Development).

References

    1. Doherty TS, Glen AS, Nimmo DG, Ritchie EG, Dickman CR. 2016. Invasive predators and global biodiversity loss. Proc. Natl Acad. Sci. USA 113, 11 261-11 265. (10.1073/pnas.1602480113) - DOI - PMC - PubMed
    1. Salo P, Korpimäki E, Banks PB, Nordström M, Dickman CR. 2007. Alien predators are more dangerous than native predators to prey populations. Proc. R. Soc. B 274, 1237-1243. (10.1098/rspb.2006.0444) - DOI - PMC - PubMed
    1. Ward M, et al. 2021. A national-scale dataset for threats impacting Australia's imperiled flora and fauna. Ecol. Evol. 11, 11749-11761. (10.1002/ece3.7920) - DOI - PMC - PubMed
    1. Woinarski JCZ, Burbidge AA, Harrison PL. 2014. The Action Plan for Australian Mammals 2012. Collingwood, Victoria: CSIRO Publishing.
    1. Woinarski JCZ, et al. 2019. Reading the black book: the number, timing, distribution and causes of listed extinctions in Australia. Biol. Cons. 239, 108261. (10.1016/j.biocon.2019.108261) - DOI

LinkOut - more resources