

Using electronic admission data to monitor temporal trends in local medication use: Experience from an Australian tertiary teaching hospital
- PMID: 36313311
- PMCID: PMC9614045
- DOI: 10.3389/fphar.2022.888677
Using electronic admission data to monitor temporal trends in local medication use: Experience from an Australian tertiary teaching hospital
Abstract
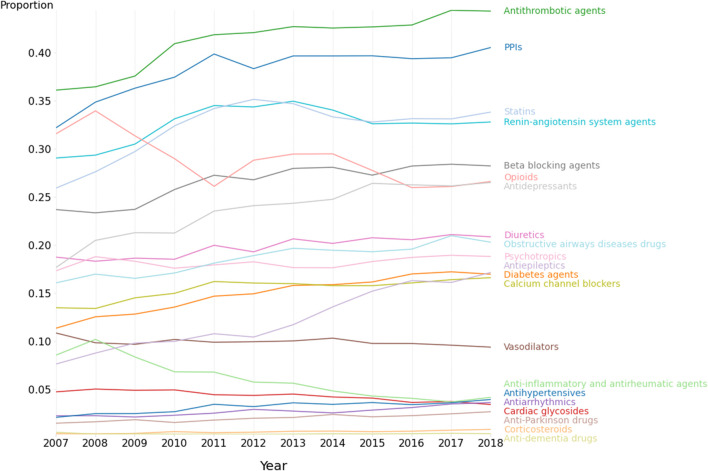
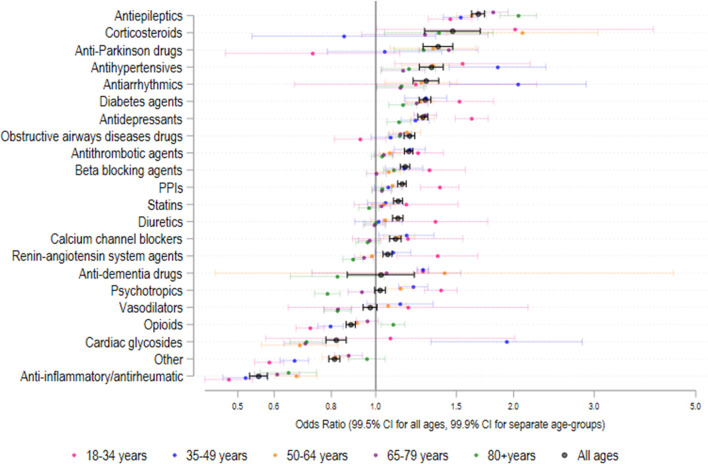
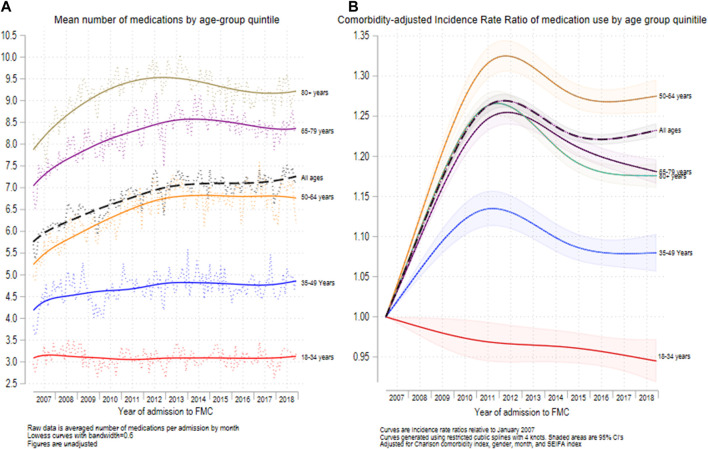
Background and aims: Medication usage varies according to prescribing behavior, professional recommendations, and the introduction of new drugs. Local surveillance of medication usage may be useful for understanding and comparing prescribing practices by healthcare providers, particularly in countries such as Australia that are in the process of enhancing nationwide data linkage programs. We sought to investigate the utility of electronic hospital admission data to investigate local trends in medication use, to determine similarities and differences with other Australian studies, and to identify areas for targeted interventions. Methods: We performed a retrospective longitudinal analysis using combined data from a hospital admissions administrative dataset from a large tertiary teaching hospital in Adelaide, South Australia and a hospital administrative database documenting medication usage matched for the same set of patients. All adult admissions over a 12-year period, between 1 January 2007 and 31st December 2018, were included in the study population. Medications were categorized into 21 pre-defined drug classes of interest according to the ATC code list 2021. Results: Of the 692,522 total admissions, 300,498 (43.4%) had at least one recorded medication. The overall mean number of medications for patients that were medicated increased steadily from a mean (SD) of 5.93 (4.04) in 2007 to 7.21 (4.98) in 2018. Results varied considerably between age groups, with the older groups increasing more rapidly. Increased medication usage was partly due to increased case-complexity with the mean (SD) Charlson comorbidity index increasing from 0.97 (1.66) in 2007-to-2012 to 1.17 (1.72) in 2013-to-2018 for medicated patients. Of the 21 medication classes, 15 increased (p < 0.005), including antithrombotic agents; OR = 1.18 [1.16-1.21], proton pump inhibitors; OR = 1.14 [1.12-1.17], statins; OR = 1.12; [1.09-1.14], and renin-angiotensin system agents; OR = 1.06 [1.04-1.08], whilst 3 decreased (p < 0.005) including anti-inflammatory drugs (OR = 0.55; 99.5% CI = 0.53-0.58), cardiac glycosides (OR = 0.81; 99.5% CI = 0.78-0.86) and opioids (OR = 0.82; 99.5% CI = 0.79-0.83). The mean number of medications for all admissions increased between 2007 and 2011 and then declined until 2018 for each age group, except for the 18-to-35-year-olds. Conclusion: Increased medication use occurred in most age groups between 2007 and 2011 before declining slightly even after accounting for increased comorbidity burden. The use of electronic hospital admission data can assist with monitoring local medication trends and the effects of initiatives to enhance the quality use of medicines in Australia.
Keywords: comorbidity; data management; electronic hospital data; medication usage; pharmacoepidemiology; temporal trends.
Copyright © 2022 Woodman, Horwood, Kunnel, Hakendorf and Mangoni.
Conflict of interest statement
The authors declare that the research was conducted in the absence of any commercial or financial relationships that could be construed as a potential conflict of interest.
Figures
Similar articles
-
Beyond the black stump: rapid reviews of health research issues affecting regional, rural and remote Australia.Med J Aust. 2020 Dec;213 Suppl 11:S3-S32.e1. doi: 10.5694/mja2.50881. Med J Aust. 2020. PMID: 33314144
-
Pharmacist-led admission medication reconciliation before and after the implementation of an electronic medication management system.Int J Med Inform. 2017 May;101:41-49. doi: 10.1016/j.ijmedinf.2017.02.001. Epub 2017 Feb 8. Int J Med Inform. 2017. PMID: 28347446
-
Trends in hospital admissions for hypoglycaemia in England: a retrospective, observational study.Lancet Diabetes Endocrinol. 2016 Aug;4(8):677-685. doi: 10.1016/S2213-8587(16)30091-2. Epub 2016 Jun 9. Lancet Diabetes Endocrinol. 2016. PMID: 27293218
-
Medicare Part D Use of Older Medicare Beneficiaries Admitted to Hospice.J Am Geriatr Soc. 2018 May;66(5):937-944. doi: 10.1111/jgs.15328. Epub 2018 Mar 6. J Am Geriatr Soc. 2018. PMID: 29509282
-
The Extent of Medication-Related Hospital Admissions in Australia: A Review from 1988 to 2021.Drug Saf. 2022 Mar;45(3):249-257. doi: 10.1007/s40264-021-01144-1. Epub 2022 Jan 28. Drug Saf. 2022. PMID: 35089582 Free PMC article. Review.
References
-
- Apenteng P. N., Gao H., Hobbs F. R., Fitzmaurice D. A., Investigators U. G.-A., Committee G.-A. S. (2018). Temporal trends in antithrombotic treatment of real-world UK patients with newly diagnosed atrial fibrillation: Findings from the GARFIELD-AF registry. BMJ Open 8 (1), e018905. 10.1136/bmjopen-2017-018905 - DOI - PMC - PubMed
LinkOut - more resources
Full Text Sources
Research Materials