Review
. 2022 Oct 13:13:906512.
doi: 10.3389/fphar.2022.906512. eCollection 2022.

Advanced targeted nanomedicines for vulnerable atherosclerosis plaque imaging and their potential clinical implications

Affiliations
Review

Advanced targeted nanomedicines for vulnerable atherosclerosis plaque imaging and their potential clinical implications

Xue Li et al. Front Pharmacol. .

Abstract

Atherosclerosis plaques caused by cerebrovascular and coronary artery disease have been the leading cause of death and morbidity worldwide. Precise assessment of the degree of atherosclerotic plaque is critical for predicting the risk of atherosclerosis plaques and monitoring postinterventional outcomes. However, traditional imaging techniques to predict cardiocerebrovascular events mainly depend on quantifying the percentage reduction in luminal diameter, which would immensely underestimate non-stenotic high-risk plaque. Identifying the degree of atherosclerosis plaques still remains highly limited. vNanomedicine-based imaging techniques present unique advantages over conventional techniques due to the superior properties intrinsic to nanoscope, which possess enormous potential for characterization and detection of the features of atherosclerosis plaque vulnerability. Here, we review recent advancements in the development of targeted nanomedicine-based approaches and their applications to atherosclerosis plaque imaging and risk stratification. Finally, the challenges and opportunities regarding the future development and clinical translation of the targeted nanomedicine in related fields are discussed.

Keywords: atherosclerosis; atherosclerosis molecular imaging; imaging biomarkers; targeted nanoparticle-based contrast agents; vulnerable plaques.


Conflict of interest statement

The authors declare that the research was conducted in the absence of any commercial or financial relationships that could be construed as a potential conflict of interest.

Figures

SCHEME 1
SCHEME 1
Key processes of the atherosclerotic plaque development.
FIGURE 1
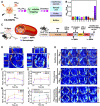
FIGURE 1
(A) Schematic illustration of PIMI. (B) TEM image and (C) elemental mapping images (Fe, Si, and O) of PIMI. (D) T 2 -weighted pseudo-color images after PIMI and IMI nanoparticle injection. (E) Relative MR signal intensity drop of aortic plaques at different time points. (F) Coronal R2* map of aorta. (G) Correlation of fitted curves between aortic R2* changes and nanoparticle deposition. (H) Dual-modal MR, NIRF imaging, and Prussian blue staining of plaques induced by 10 or 20 weeks of HFD. Scale bars: 50 μm (Copyright permission from Elsevier) (Wu et al., 2021).
FIGURE 2
FIGURE 2
(A) Schematic illustration of PNPs targeting different components of atherosclerotic plaques. (B) Macroscopic fluorescent imaging of aortic arches from wild-type (WT) or ApoE KO mice fed on a high-fat western diet after intravenous administration with PEG-NPs, RBCNPs, or PNPs (white = physical outline, red = nanoparticle). Oil Red O staining was used to confirm the presence of plaque for ApoE KO mice (image is representative). (C) Particle size of PNPs and Gd-PNPs in water or PBS (n = 3, mean ± SD). (D) Surface zeta potential of bare PLGA cores, PNPs, and Gd-PNPs (n = 3, mean ± SD). (E) TEM image of Gd-PNPs (scale bar = 100 nm). (F) In vitro T 1 -weighted signal of Gd-PNPs. (G) Bright field image of aortic arch from ApoE−/−mice stained with Oil Red O confirmed the presence of atherosclerotic plaque. (H) T 1 -weighted MR images of ApoE−/− mice before and 1 h after administration with Gd-PNPs (orange arrows = regions of positive contrast along the aortic arch) (Copyright permission from the American Chemical Society) (Wei et al., 2018).
FIGURE 3
FIGURE 3
(A) Summary of the synthesis procedure of the agents. (B) TEM image of particle uptake. (C) T 1 -weighted MR images of the aorta of ApoE−/− mice pre- and 24 h post-injection with Au-HDL, and the corresponding confocal microscopy images. (D) Ex vivo sagittal CT images of the aortas of mice injected with Au-HDL, Au-PEG, and saline (Copyright permission from the American Chemical Society) (Cormode et al., 2008).
FIGURE 4
FIGURE 4
(A) TEM of gold nanoparticle. (B) In vitro photon-counting CT images of tubes containing Au nanoparticles (4 mg/ml), iomeprol (4 mg/ml), or calcium phosphate (1,800 HU). (C) Images show noncalcified plaque with strong circumferential enhancement and mean wall concentration of 4.5 mg/ml of Au nanoparticles. (D) Images show calcified plaque with strong enhancement within and around the calcified area and mean wall concentration of 2.74 mg/ml of Au nanoparticles. (E) Box-and-whisker plot shows quantitative analysis of mean Au concentration found in the whole atherosclerotic rabbit abdominal aortic wall before injection and 2 days after injection. (F–J) Photon-counting CT images of atherosclerotic rabbit aorta before and 2 days after injection of gold nanoparticles. 2D, two-dimensional. 3D, three-dimensional (Copyright permission from the Radiological Society of North America) (Si−Mohamed et al., 2021).
FIGURE 5
FIGURE 5
(A) Synthesis and radiolabeling scheme of 18F-Macroflor. PET/MRI on (B) dynamic light scattering measurement of purified nanoparticle. (C) Size-exclusion chromatogram of purified labeled and unlabeled nanoparticles. (D) Representative PET/CT images of several experiments in ApoE/and wild-type control mice after IV Macroflor injection. PET scale bar is in kBq/ccn ¼ 14. (E) Three-dimensional rendering derived from PET/CT in the ApoE/mouse shows the PET signal in red (arrows). (F) In vivo standard uptake values (SUVs) for aortic roots of wild-type and ApoE/mice (n ¼ 5–7 per group, unpaired t-test). (G) Ex vivo gamma count reports percent injected dose per gram aortic tissue. (H) Correlation of (C, D) for individual wild-type (black) and ApoE/mice (gray), counts per minute (CPM). (I) PET/MR images obtained in rabbits with atherosclerosis and (J) control rabbits. (K) Standard uptake values (SUVs) in the infrarenal aorta after Macroflor injection in control rabbits, rabbits with intermediate and full aortic balloon infrarenal aorta denudation. (L) Autoradiography of the abdominal aorta in a control rabbit and a rabbit with atherosclerosis after Macroflor injection, representative images of 12 autoradiography exposures (n ¼ 4 per group) (M) Ex vivo gamma counting and (N) aortic SUV in infrarenal aorta of the same rabbits 2 days before Macroflor injection. (O) Correlation of 18F-FDG with Macroflor in vivo PET signal. (P) Cardiac PET images with respective agents. (Copyright permission from Springer Nature) (Keliher et al., 2017).
FIGURE 6
FIGURE 6
(A) Representative coronal aortic fused PET/MR images for 18F-FDG (3 h) (left), 68Ga-MMR (2 h) (middle) and 18F-NaF (1.5 h) (right), and (B) representative T 2 W-MRI (left) and DCE-MRI (right) images from healthy and atherosclerotic rabbits (on high-fat diet for 4 months or 8 months, n ≥ 3 per group). (C) Cardiac PET/MR images of the respective tracers and associated aorta-to-heart ratios in rabbits with atherosclerosis (8 HFD). (D) Aortic sections taken from healthy control subjects and atherosclerotic rabbits (4 HFD or 8 HFD) and stained with H&E and RAM-11 (macrophages). *p < 0.05; 18 F-FDG versus 18 F-NaF: # p < 0.05; ## p < 0.01 (Copyright permission from Elsevier) (Senders et al., 2018).
FIGURE 7
FIGURE 7
(A) Two-dimensional ultrasonography images of the abdominal aorta of rabbits in different groups. (B) SonoVue ultrasonic contrast images of the abdominal aorta of rabbits in different groups. (C) ICAM-1-targeted nano ultrasonic contrast images of the abdominal aorta of experiment rabbits in different groups. Five rabbits in each group: control group; week-4 group; week-8 group; week-12 group; week-16 group. The intima-media membrane and the plaque on the wall were indicated by the arrows (Copyright permission from Springer Nature) (Li et al., 2021).
FIGURE 8
FIGURE 8
(A) Diagram of targeted MBVIS. (B) Representative bright-field micrographs of targeted MBs and MBIgG bound to stimulated bEend.3 cells (40 ng/ml TNF-α; scale bar = 10 μm). (C) Representative color-coded ultrasound images after injection of various kinds of MBs at the 10-week feeding time, and (D) the quantitative analysis of ultrasound signal intensities. (E) Representative color-coded images from four groups after injection of MBVIS, and (F) the quantitative analysis of ultrasound signal intensities. Scale bar = 1 mm. (G) Representative H&E images and quantitative analysis of intima-media thickness of ascending aorta sections from ApoE−/− mice-fed atorvastatin or placebo in their daily hypercholesterolemic diets for 8 weeks. Scale bar = 50 μm. *p < 0.05. (H) Representative color-coded images of ascending aorta and quantitative analysis of signal intensities generated from adherent MBVIS or MBIgG. Scale bar = 1 mm *p < 0.05 (Copyright permission from the Ivyspring International Publisher) (Fei et al., 2018).
FIGURE 9
FIGURE 9
(A) Schematic diagram and (B) TEM images and size histograms of the UCNP-anti-OPN probe. (C) Schematic diagram for showing the varied stress-induced plagues in ApoE−/− mice. (D) In vivo upconversion luminescent images captured before and at different time points after intravenous injection of the UCNP-anti-OPN probe. (E,F) Histological analyses and quantified data of the different plaque regions upon various staining (*p < 0.05) (Copyright permission from the American Chemical Society) (Qiao et al., 2017).
FIGURE 10
FIGURE 10
(A) Schematic illustration of CS-RSPN for reliable ratiometric photoacoustic imaging of O2 . (B) Selective response: PA690/PA800 ratios of RSPN. (C) Scheme of RSPN for photoacoustic imaging of atherosclerotic plaques and administration procedure (n = 3). (D) 3D PA image of plaque-bearing mice before and after injection of RSPN. Excitation: 690 nm. Aorta regions are depicted by dotted circles. (E) PA images after injection of RSPN of healthy mice, plaque-bearing mice, and plaque-bearing mice complicated with pneumonia. Data are shown as mean ± SD (n = 3). Aorta regions are depicted by dotted circles. (F–I) Normalized PA690 and PA800 of healthy mice, plaque-bearing mice, and plaque-bearing mice complicated with pneumonia (two-tailed Student’s t test, *p < 0.05, **p < 0.01). (Copyright permission from the American Chemical Society) (Ma et al., 2021).
FIGURE 11
FIGURE 11
In vivo neovessel-targeting behavior of PFP-HMME@PLGA/MnFe2O4-Ram NPs. The bright-field and (A) near-infrared fluorescence images, (B) MRI T 1 images, and (C) US of femoral plaque-bearing rabbits after intravenous injection of targeted NPs and nontargeted NPs at different time points (Copyright permission from Wiley-VCH GmbH) (Yao et al., 2021).
FIGURE 12
FIGURE 12
CCR2/CCL2 is highly expressed in atherosclerosis and a target for CCTV contrast agents. (A) Experimental workflow and generation of the atherosclerosis model. (B) nCounter Nanostring assays enabled quantification of mRNA expression of major chemokines and their receptors in leukocytes isolated from aortas of normal and atherosclerotic mice. (C) Europium (Eu)-enhanced time-resolved fluorescence imaging (TRF) of excised organs from atherosclerotic mice injected with 0.1 mg/kg (based on Eu concentration) of CCTV or VTCC containing 10% (by weight) Eu cryptate-conjugated lipids. (D) Magnetic resonance imaging of atherosclerotic plaque (arrows) with CCTV and VTCC containing gadolinium (Gd) lipid-conjugated chelates (DOTA) at 20% (by weight) and injected at 0.1 mg/kg (based on Gd concentration). (E) Contrast-to-noise ratio (CNR) quantification of gadolinium-enhanced plaque (Copyright permission from the Ivyspring International Publisher) (Mog et al., 2019).
FIGURE 13
FIGURE 13
Targeting and MR imaging ability of IPMT-NP in vivo. (A) Schematic diagram showing the time scale of the in vivo animal experiment. (B) US images monitored atherosclerotic plaques in the aortic arch of model apoE−/− mice (right, red arrowhead) by comparing with age-matched normal mice (left). (C) Gross aortic vessel isolated from age-matched mice (left), representative photographs of Oil Red O-stained aorta form the control group (middle) and the ApoE−/− mice after a 16-week western diet (right). (D) Fluorescence images of aorta and (E) the extracted organs from mice at 6 h post the injection of Dio-labeled Fe-PFP-PLGA NPs or MPmTNs. (F) T 2 -weighted and pseudo-color images, (G,H) CNR, and (I) % NENH of aortic plaques at different points after the injection of MPmTNs or the Fe-PFP-PLGA NPs (**p < 0.01) (Copyright permission from the Royal Society of Chemistry) (Gao et al., 2021).

Similar articles

Cited by

References

    1. Aboyans V., Ricco J. B., Bartelink M. E. L., Björck M., Brodmann M., Cohnert T., et al. (2018). 2017 ESC guidelines on the diagnosis and treatment of peripheral arterial diseases, in collaboration with the European society for vascular surgery (ESVS): Document covering atherosclerotic disease of extracranial carotid and vertebral, mesenteric, renal, upper and lower extremity arteriesEndorsed by: The European stroke organization (ESO) the task force for the diagnosis and treatment of peripheral arterial diseases of the European society of Cardiology (ESC) and of the European society for vascular surgery (ESVS). Eur. Heart J. 39 (9), 763–816. 10.1093/eurheartj/ehx095 PubMed Abstract | 10.1093/eurheartj/ehx095 | Google Scholar - DOI - DOI - PubMed
    1. Aizaz M., Moonen R. P. M., van der Pol J. A. J., Prieto C., Botnar R. M., Kooi M. E. (2020). PET/MRI of atherosclerosis. Cardiovasc. Diagn. Ther. 10 (4), 1120–1139. 10.21037/cdt.2020.02.09 PubMed Abstract | 10.21037/cdt.2020.02.09 | Google Scholar - DOI - DOI - PMC - PubMed
    1. Akyuz A. (2020). Exercise and coronary heart disease. Adv. Exp. Med. Biol. 1228, 169–179. 10.1007/978-981-15-1792-1_11 PubMed Abstract | 10.1007/978-981-15-1792-1_11 | Google Scholar - DOI - DOI - PubMed
    1. Allahverdian S., Chehroudi A. C., Mcmanus B. M., Abraham T., Francis G. A. (2014). Contribution of intimal smooth muscle cells to cholesterol accumulation and macrophage−like cells in human atherosclerosis. Circulation 129, 1551–1559. 10.1161/CIRCULATIONAHA.113.005015 PubMed Abstract | 10.1161/CIRCULATIONAHA.113.005015 | Google Scholar - DOI - DOI - PubMed
    1. Alphandéry E. (2022). Nanomaterials as ultrasound theragnostic tools for heart disease treatment/diagnosis. Int. J. Mol. Sci. 23 (3), 1683. 10.3390/ijms23031683 PubMed Abstract | 10.3390/ijms23031683 | Google Scholar - DOI - DOI - PMC - PubMed

LinkOut - more resources