. 2022 Oct 12:13:1007519.
doi: 10.3389/fgene.2022.1007519. eCollection 2022.

Biphasic cell cycle defect causes impaired neurogenesis in down syndrome

Affiliations

Biphasic cell cycle defect causes impaired neurogenesis in down syndrome

Vishi Sharma et al. Front Genet. .

Abstract

Impaired neurogenesis in Down syndrome (DS) is characterized by reduced neurons, increased glial cells, and delayed cortical lamination. However, the underlying cause for impaired neurogenesis in DS is not clear. Using both human and mouse iPSCs, we demonstrate that DS impaired neurogenesis is due to biphasic cell cycle dysregulation during the generation of neural progenitors from iPSCs named the "neurogenic stage" of neurogenesis. Upon neural induction, DS cells showed reduced proliferation during the early phase followed by increased proliferation in the late phase of the neurogenic stage compared to control cells. While reduced proliferation in the early phase causes reduced neural progenitor pool, increased proliferation in the late phase leads to delayed post mitotic neuron generation in DS. RNAseq analysis of late-phase DS progenitor cells revealed upregulation of S phase-promoting regulators, Notch, Wnt, Interferon pathways, and REST, and downregulation of several genes of the BAF chromatin remodeling complex. NFIB and POU3F4, neurogenic genes activated by the interaction of PAX6 and the BAF complex, were downregulated in DS cells. ChIPseq analysis of late-phase neural progenitors revealed aberrant PAX6 binding with reduced promoter occupancy in DS cells. Together, these data indicate that impaired neurogenesis in DS is due to biphasic cell cycle dysregulation during the neurogenic stage of neurogenesis.

Keywords: Pax6 (RRID: AB_1566562; RRID: AB_2565003; RRID: AB_291612); cell cycle; disease modeling; down syndrome; human iPSCs; mouse iPSCs; neurogenesis; trisomy 21.


Conflict of interest statement

The authors declare that the research was conducted in the absence of any commercial or financial relationships that could be construed as a potential conflict of interest.

Figures
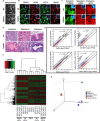
FIGURE 1
FIGURE 1
Mouse iPSCs generation and characterization. (A) Representative images of 2N and Ts65Dn mouse iPSCs (miPSCs) clones on the feeder layer. (B) Pluripotency characterization of miPSCs using ICC for pluripotency-associated markers DPPA2 (green), SOX2 (red), OCT4 (green), and SSEA1 (red). Inserts show corresponding DAPI (blue) staining for each image. (C) In vitro developmental potential of 2N and Ts65Dn miPSCs is characterized by the expression of markers of three germ layers. ICC was done for Tubulin beta 3 (TUBB3) (green) for ectoderm, Smooth muscle actin (SMA) (red) for mesoderm, and Alpha fetal protein (AFP) (red) for endoderm. Inserts show corresponding DAPI (blue) staining for each image. (D) Representative images of ectodermal (skin epithelium), mesodermal (muscle), and endodermal (cuboidal epithelium) lineage tissues in teratomas were used to assess in vivo developmental potential of 2N and Ts65Dn miPSCs. (E) Pairwise correlation plots of the global gene expression of ESD3 with 2N miPSCs, ESD3 with Ts65Dn miPSCs, 2N MEFs with 2N miPSCs, Ts65Dn MEFs with Ts65Dn miPSCs. The black line indicates log2 two-fold changes in gene expression levels between the paired cell types. Upregulated genes in ordinate samples compared with abscissa samples are shown in blue; those downregulated are shown in red. The positions of pluripotent genes (Pou5f1/Oct4, Sox2, Nanog, Klf4, and Lin28) are shown as green dots. The gene expression levels are in the log2 scale. (F) Heat map of global gene expression. On the top is depicted the gene expression color key. Samples labels are shown at the bottom. (G) Principal component analysis (PCA) of global gene expression among replicates from the 2N MEFs, 2N miPSCs, Ts65Dn MEFs, Ts65Dn miPSCs, and ESD3.
FIGURE 2
FIGURE 2
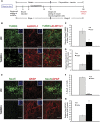
Analysis of monolayer-mediated neural differentiation of 2N and Ts65Dn miPSCs. (A) Schematic representation of neural differentiation protocol for miPSCs. Stage 1 is defined as the differentiation of iPSCs to neural progenitors, and stage 2 is defined as the differentiation of neural progenitors to postmitotic neural differentiation. (B) Representative images of TUBB3 (green) and ALDH1L1 (red) expressing cells and overlays of TUBB3 and ALDH1L1 images at DIV 26. Corresponding DAPI (blue) images have been shown as inserts (C) Quantification of TUBB3 expression in 2N and Ts65Dn cells normalized by DAPI staining. (D) Quantification of ALDH1L1 expression in 2N and Ts65Dn cells normalized by DAPI staining. (E) Representative images of NeuN (green) and GFAP (red) expressing cells and overlays of NeuN and GFAP images. Corresponding DAPI (blue) images have been shown as inserts. (F) Quantification of NeuN + nuclei in 2N and Ts65Dn cells against a total number of nuclei identified by DAPI staining. (G) Quantification of GFAP expression in 2N and Ts65Dn cells normalized by DAPI staining. Data are represented as mean ± SEM. A total of three independent experiments were performed using the same batch of iPSCs (N = 3). *p < 0.05, **p < 0.01, ***p < 0.001, n.s. non-significant. The scale bar is 50 µm. (See also Supplementary Figure S1).
FIGURE 3
FIGURE 3
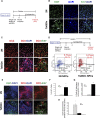
Analysis of mouse progenitor cells during neural differentiation. (A) Schematic representation of progenitor differentiation from mouse iPSCs. (B) Ki67 staining and its overlay with DAPI stained nuclei on DIV 7. Cells in the M phase of the cell cycle show whole nuclei expression, while cells in the interphase (G1/S/G2 phase) show a punctate pattern. Examples of Ki67 + cells with punctate expression patterns are shown with an arrow. (C) Progenitor cells were stained with Doublecortin (DCX) at DIV 7 of differentiation. Representative images showing DCX (red) expression. DCX-DAPI image overlay shows perinuclear staining of DCX in 2N cells and diffused staining in Ts65Dn cells. Overlay of DCX and Ki67 shows that cells with Ki67 punctate expression pattern have diffused DCX expression patterns, as indicated by an arrow. (D) Cells were labeled with BrdU on DIV 12 of differentiation. BrdU labeled cells were stained with anti-BrdU FITC antibody and DAPI before FACS analysis. The percentage of cells in each phase of the cell cycle is shown. (E) Representative images showing an overlay of Ki67 (green) overlaid with DAPI (blue), DCX (red) overlaid with DAPI (blue), and DCX (red) overlaid with Ki67(green) expressing cells. Cells with a Ki67 punctate pattern are shown with an arrow (F). Quantification of Ki67 + nuclei in 2N and Ts65Dn cells against a total number of nuclei identified by DAPI staining and (G) quantification of Ki67 + cells with punctate expression against a total number of Ki67 + cells (H) Quantification of DCX expression in 2N and Ts65Dn cells normalized by DAPI staining. Data are represented as mean ± SEM, where three independent experiments were performed using the same batch of iPSCs (N = 3). *p < 0.05, **p < 0.01, ***p < 0.001, n.s. non-significant. The scale bar is 50 µm. (See also Supplementary Figure S2).
FIGURE 4
FIGURE 4
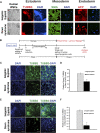
Monolayer-mediated differentiation of Down syndrome human iPSCs display reduced neural differentiation. (A) Representative images of Down syndrome human iPSCs (hiPSCs), its isogenic euploid hiPSCs, and three germ layer differentiation. Three germ layer analysis was done using ICC for Tubulin beta 3 (TUBB3) (red) for ectoderm, Smooth muscle actin (SMA) (green) for mesoderm, and Alpha fetal protein (AFP) (red) for endoderm. Corresponding DAPI (blue) staining for each image has been shown. Scalebar is 100 μM. (B) Schematics of neural differentiation protocol of hiPSCs on poly Ornithine-Laminin or Matrigel. Stage 1 is defined as the differentiation of iPSCs to neural progenitors, and stage 2 is defined as the differentiation of neural progenitors to postmitotic neural differentiation. (C) Representative images of TUBB3 (green) expressing human cells, corresponding DAPI images, and their overlay and quantification of TUBB3 expression normalized by DAPI staining (D) on poly Ornithine-Laminin. (E) Representative images of TUBB3 (green) expressing cells, corresponding DAPI images, and their overlay and quantification of TUBB3 expression normalized by DAPI staining (F) on Matrigel during phase 2. Data are represented as mean ± SEM A total of three independent experiments were performed using the same batch of iPSCs (N = 3). *p < 0.05, **p < 0.01, ***p < 0.001, n.s. non-significant. The scale bar is 50 µm. (See also Supplementary Figure S3).
FIGURE 5
FIGURE 5
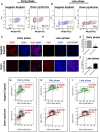
Analysis of human neural progenitor cells during neural differentiation. (A) FACS analysis at the early phase (DIV 18) of stage 1 for quantification of PAX6+ cells. The percentage of PAX6+ cells is shown. (B) FACS analysis at late phase (DIV 28) of stage 1 for quantification of PAX6+ cells. The percentage of PAX6+ cells is shown. (C) Representative image of Ki67 at the early phase (DIV 18) of stage 1 along with corresponding DAPI image and their overlay. (D) Representative image of Ki67 at late phase (DIV 28) of stage 1 along with corresponding DAPI image and their overlay. (E–F) Quantification of Ki67 + nuclei normalized by DAPI. Data are represented as mean ± SEM where N = 3. A total of three independent experiments were performed using the same batch of iPSCs. *p < 0.05, **p < 0.01, ***p < 0.001, n.s. non-significant. Scale bar is 100 μM. (G–I) Cells were labeled with BrdU on DIV10 (G), DIV16 (H), and DIV28 (I) and stained with anti-BrdU-FITC antibody and DAPI, and analyzed by FACS. The percentage of cells in each phase of the cell cycle is shown. (See also Supplementary Figure S4).
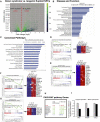
FIGURE 6
FIGURE 6
RNAseq analysis of global gene expression of Down syndrome and isogenic euploid DIV 24 progenitor cells. (A) Volcano plot shows downregulated and upregulated genes in Down syndrome cells compared to isogenic euploid cells. The number of genes is shown in red. (B) Top disease and functions term found through Ingenuity Pathway Analysis (IPA) with differentially expressed gene set in DIV 24 DS cells. The bar chart’s threshold line (orange) represents a p-value of 1.3. (C) Significant canonical pathways are involved in the well-characterized cell signaling and metabolic pathways associated with the differentially expressed genes in DIV 24 Down syndrome cells. The ratio (r) is calculated by the number of genes from the data set of the differentially expressed gene set that participate in a Canonical Pathway and dividing it by the total number of genes in that canonical pathway in IPA analysis. (D,E) Enrichment of Notch (D) and Wnt (E) signaling pathways using hallmark gene set analysis in Gene Set Enrichment Analysis (GSEA). Core genes enriched for indicated pathways are shown on the right. (F,G) Enrichment of Interphase (F) and Chromatin remodeling pathways (G) using gene ontology (GO) gene set analysis in GSEA. Core genes enriched for indicated pathways are shown on the right. FDR, false discovery rate. (H) List of selected genes of PAX6-BAF downstream pathway and downregulated genes of BAF complex. (I) QRT-PCR analysis of PAX6-BAF pathway target genes NFIB, POU3F4, and SOX11. Transcript levels were normalized to GAPDH expression. (See also Supplementary Figure S5).
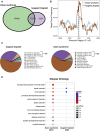
FIGURE 7
FIGURE 7
ChIPseq analysis of global PAX6 binding in DIV 24 Down syndrome and isogenic euploid cells. (A) Venn diagram showing the distribution of PAX6 binding sites in DS and isogenic euploid cells. (B) PAX6 binding profile in Down syndrome and isogenic euploid cells. (C) Pie chart analysis showing PAX6 binding on various genomic regions in DS and isogenic euploid cells. (D) Disease ontology analysis using PAX6 binding sites. (See also Supplementary Figure S6).

Similar articles

Cited by

References

    1. Adorno M., Sikandar S., Mitra S. S., Kuo A., Nicolis Di Robilant B., Haro-Acosta V., et al. (2013). Usp16 contributes to somatic stem-cell defects in Down's syndrome. Nature 501 (7467), 380–384. 10.1038/nature12530 - DOI - PMC - PubMed
    1. Alexandrow M. G., Hamlin J. L. (2005). Chromatin decondensation in S-phase involves recruitment of Cdk2 by Cdc45 and histone H1 phosphorylation. J. Cell Biol. 168 (6), 875–886. 10.1083/jcb.200409055 - DOI - PMC - PubMed
    1. Arai Y., Pulvers J. N., Haffner C., Schilling B., Nusslein I., Calegari F., et al. (2011). Neural stem and progenitor cells shorten S-phase on commitment to neuron production. Nat. Commun. 2, 154. 10.1038/ncomms1155 - DOI - PMC - PubMed
    1. Aziz N. M., Guedj F., Pennings J. L. A., Olmos-Serrano J. L., Siegel A., Haydar T. F., et al. (2018). Lifespan analysis of brain development, gene expression and behavioral phenotypes in the Ts1Cje, Ts65Dn and Dp(16)1/Yey mouse models of Down syndrome. Dis. Model. Mech. 11 (6), dmm031013. 10.1242/dmm.031013 - DOI - PMC - PubMed
    1. Beach R. R., Ricci-Tam C., Brennan C. M., Moomau C. A., Hsu P.-h., Hua B., et al. (2017). Aneuploidy causes non-genetic individuality. Cell 169 (2), 229–242.e221. 10.1016/j.cell.2017.03.021 - DOI - PMC - PubMed