

Alteration of synonymous codon usage bias accompanies polyploidization in wheat
- PMID: 36313462
- PMCID: PMC9614214
- DOI: 10.3389/fgene.2022.979902
Alteration of synonymous codon usage bias accompanies polyploidization in wheat
Abstract
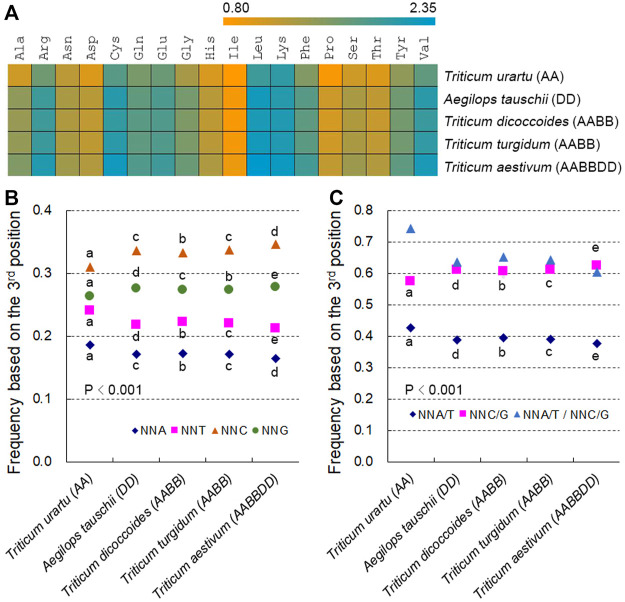
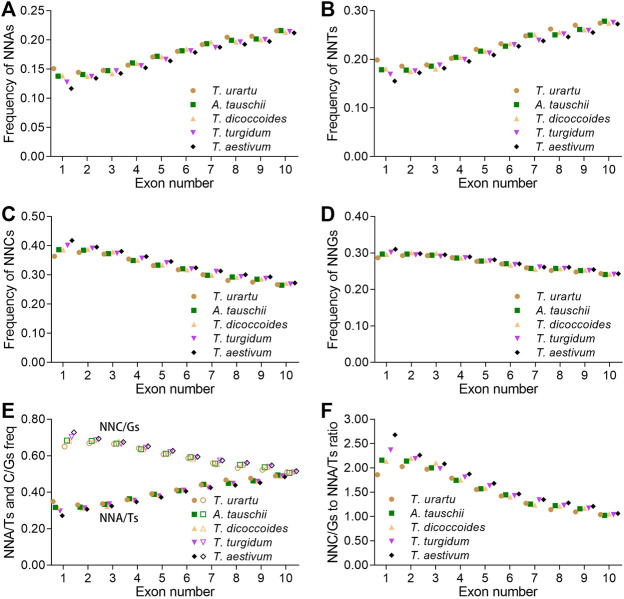
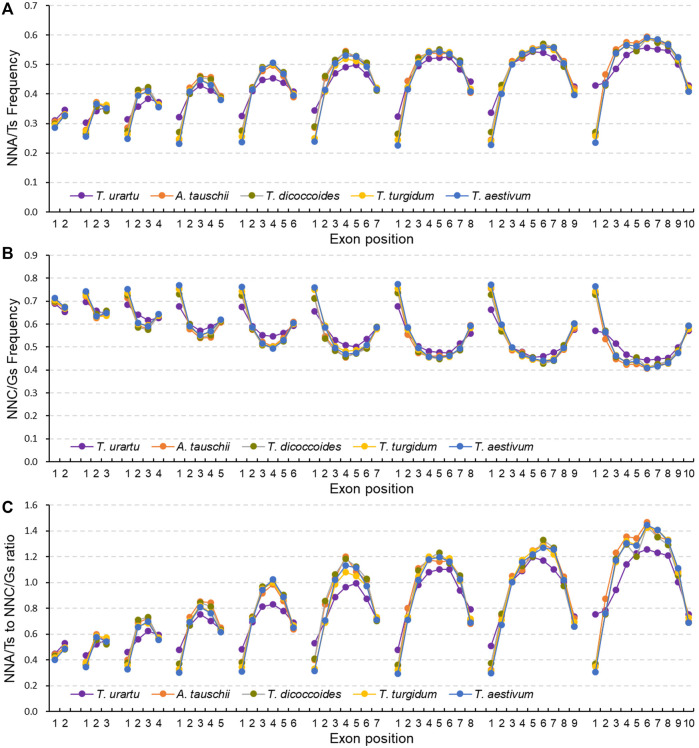
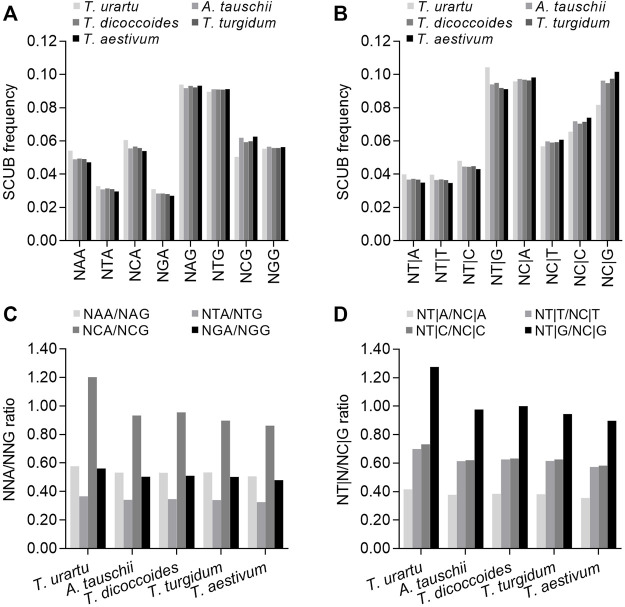
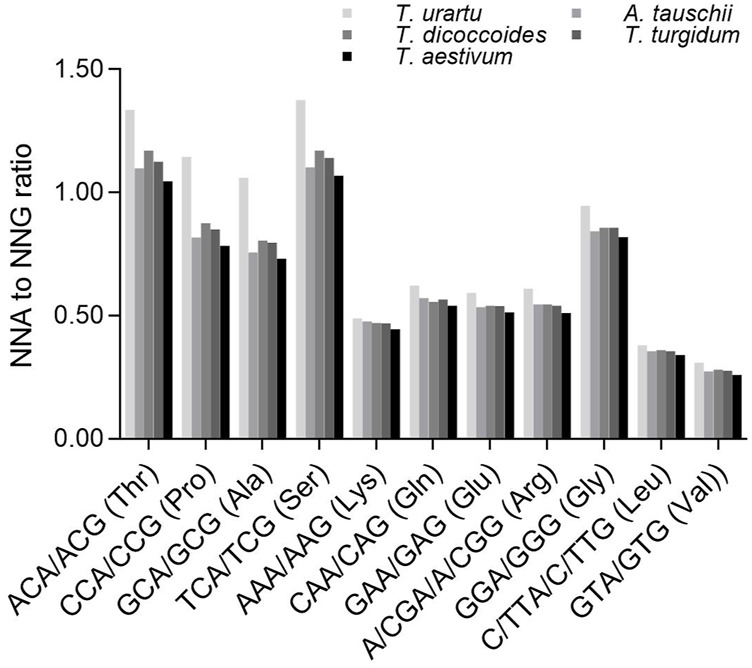
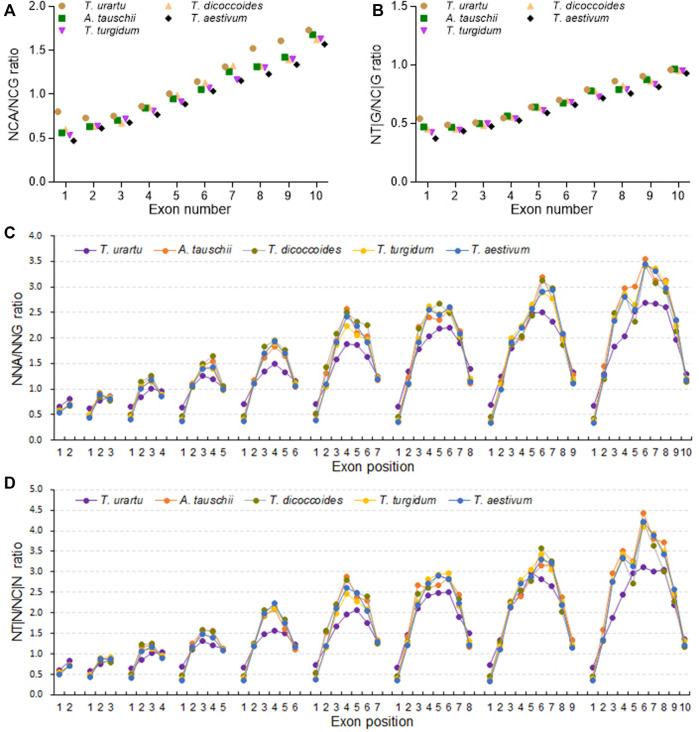
The diploidization of polyploid genomes is accompanied by genomic variation, including synonymous nucleotide substitutions that may lead to synonymous codon usage bias (SCUB). SCUB can mirror the evolutionary specialization of plants, but its effect on the formation of polyploidies is not well documented. We explored this issue here with hexaploid wheat and its progenitors. Synonymous codons (SCs) ending in either cytosine (NNC) or guanidine (NNG) were more frequent than those ending in either adenosine (NNA) or thymine (NNT), and the preference for NNC/G codons followed the increase in genome ploidy. The ratios between NNC/G and NNA/T codons gradually decreased in genes with more introns, and the difference in these ratios between wheat and its progenitors diminished with increasing ploidy. SCUB frequencies were heterogeneous among exons, and the bias preferred to NNA/T in more internal exons, especially for genes with more exons; while the preference did not appear to associate with ploidy. The SCUB alteration of the progenitors was different during the formation of hexaploid wheat, so that SCUB was the homogeneous among A, B and D subgenomes. DNA methylation-mediated conversion from cytosine to thymine weakened following the increase of genome ploidy, coinciding with the stronger bias for NNC/G SCs in the genome as a function of ploidy, suggesting that SCUB contribute to the epigenetic variation in hexaploid wheat. The patterns in SCUB mirrored the formation of hexaploid wheat, which provides new insight into genome shock-induced genetic variation during polyploidization. SCs representing non-neutral synonymous mutations can be used for genetic dissection and improvement of agricultural traits of wheat and other polyploidies.
Keywords: DNA methylation; epigenetic variation; nucleotide substitution; polyploidy; synonymous codon usage bias; wheat.
Copyright © 2022 Tian, Xiao, Wu, Zhou, Xu, Wang, Xia and Wang.
Conflict of interest statement
The authors declare that the research was conducted in the absence of any commercial or financial relationships that could be construed as a potential conflict of interest.
Figures
Similar articles
-
The Shift in Synonymous Codon Usage Reveals Similar Genomic Variation during Domestication of Asian and African Rice.Int J Mol Sci. 2022 Oct 25;23(21):12860. doi: 10.3390/ijms232112860. Int J Mol Sci. 2022. PMID: 36361651 Free PMC article.
-
Polyploidization is accompanied by synonymous codon usage bias in the chloroplast genomes of both cotton and wheat.PLoS One. 2020 Nov 19;15(11):e0242624. doi: 10.1371/journal.pone.0242624. eCollection 2020. PLoS One. 2020. PMID: 33211753 Free PMC article.
-
Synonymous Codon Usage Bias in the Plastid Genome is Unrelated to Gene Structure and Shows Evolutionary Heterogeneity.Evol Bioinform Online. 2015 Apr 7;11:65-77. doi: 10.4137/EBO.S22566. eCollection 2015. Evol Bioinform Online. 2015. PMID: 25922569 Free PMC article.
-
Synonymous codon usage bias in plant mitochondrial genes is associated with intron number and mirrors species evolution.PLoS One. 2015 Jun 25;10(6):e0131508. doi: 10.1371/journal.pone.0131508. eCollection 2015. PLoS One. 2015. PMID: 26110418 Free PMC article.
-
Synonymous Codon Usage Controls Various Molecular Aspects.Genomics Inform. 2017 Dec;15(4):123-127. doi: 10.5808/GI.2017.15.4.123. Epub 2017 Dec 29. Genomics Inform. 2017. PMID: 29307137 Free PMC article. Review.
Cited by
-
Codon usage bias is presumably affected by tRNA selection effects in Actinidia polyploidization events.BMC Genomics. 2025 Jul 23;26(1):685. doi: 10.1186/s12864-025-11873-7. BMC Genomics. 2025. PMID: 40702430 Free PMC article.
References
LinkOut - more resources
Full Text Sources