. 2022 Oct 13:10:988866.
doi: 10.3389/fcell.2022.988866. eCollection 2022.

Nramp: Deprive and conquer?

Affiliations

Nramp: Deprive and conquer?

M F M Cellier. Front Cell Dev Biol. .

Abstract

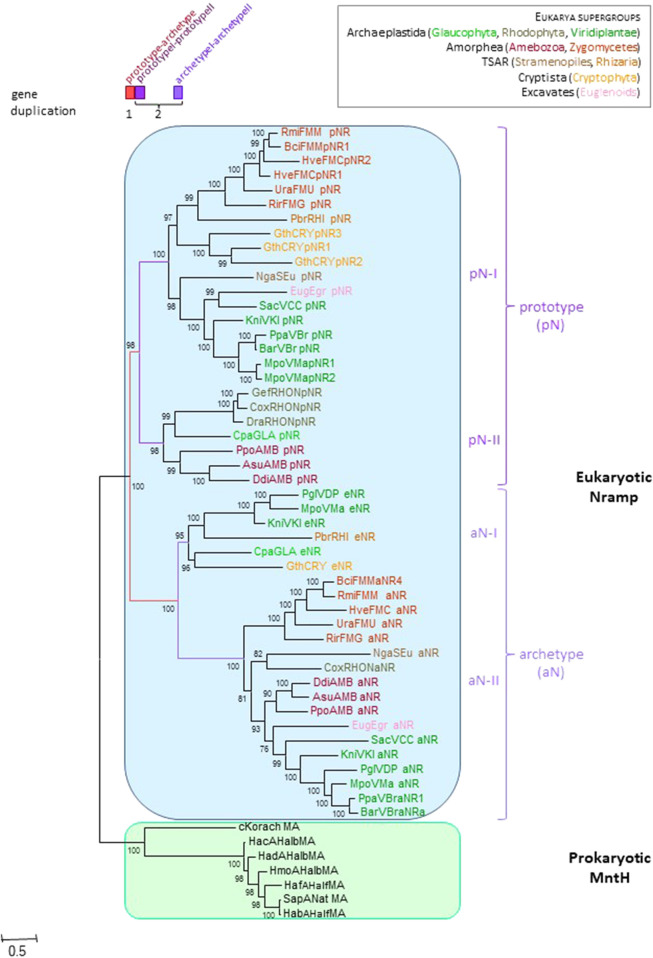
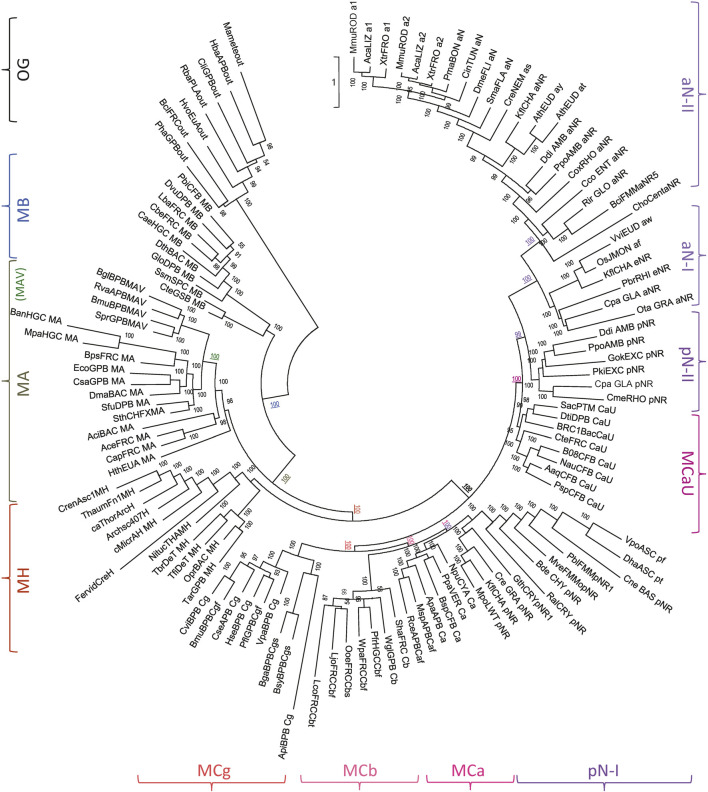
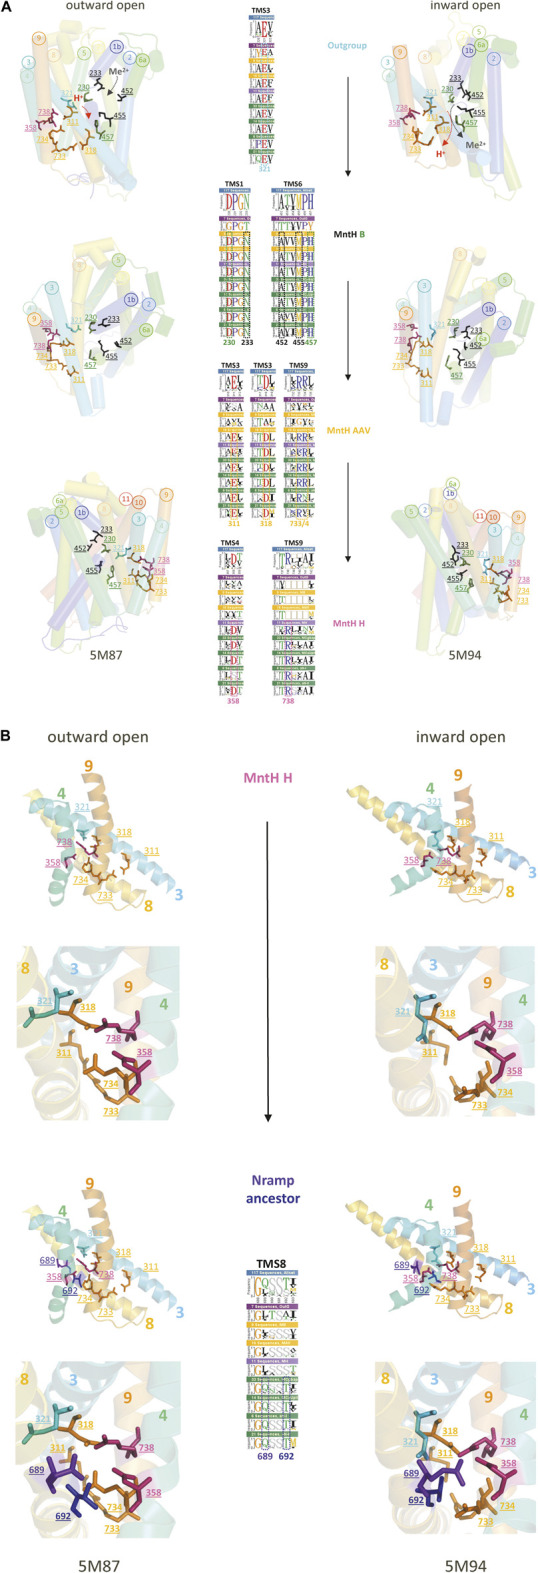
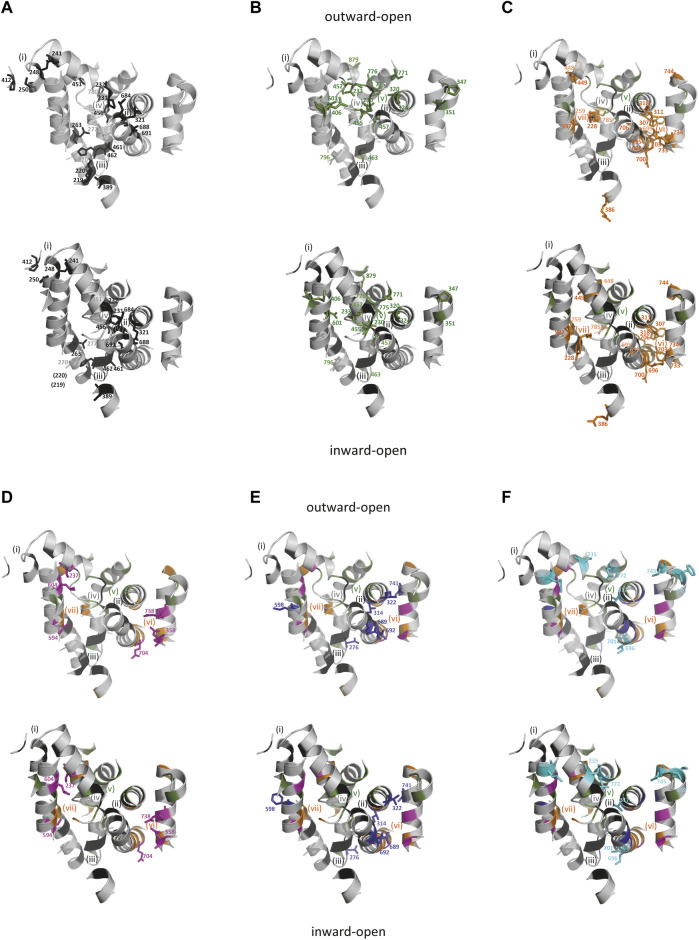
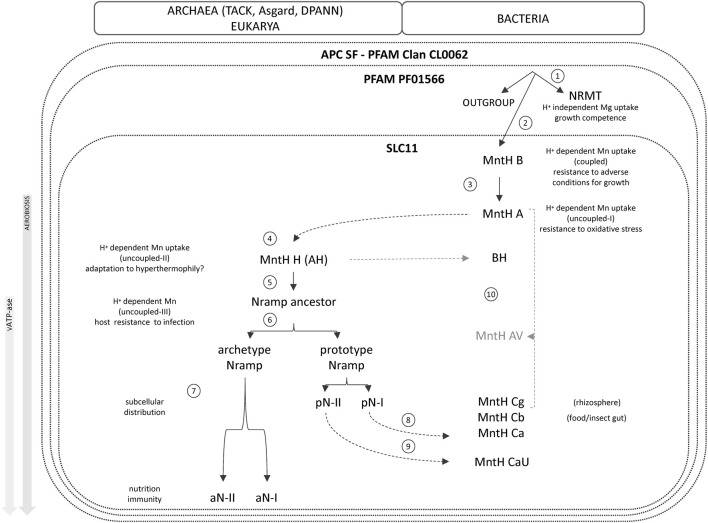
Solute carriers 11 (Slc11) evolved from bacterial permease (MntH) to eukaryotic antibacterial defense (Nramp) while continuously mediating proton (H+)-dependent manganese (Mn2+) import. Also, Nramp horizontal gene transfer (HGT) toward bacteria led to mntH polyphyly. Prior demonstration that evolutionary rate-shifts distinguishing Slc11 from outgroup carriers dictate catalytic specificity suggested that resolving Slc11 family tree may provide a function-aware phylogenetic framework. Hence, MntH C (MC) subgroups resulted from HGTs of prototype Nramp (pNs) parologs while archetype Nramp (aNs) correlated with phagocytosis. PHI-Blast based taxonomic profiling confirmed MntH B phylogroup is confined to anaerobic bacteria vs. MntH A (MA)'s broad distribution; suggested niche-related spread of MC subgroups; established that MA-variant MH, which carries 'eukaryotic signature' marks, predominates in archaea. Slc11 phylogeny shows MH is sister to Nramp. Site-specific analysis of Slc11 charge network known to interact with the protonmotive force demonstrates sequential rate-shifts that recapitulate Slc11 evolution. 3D mapping of similarly coevolved sites across Slc11 hydrophobic core revealed successive targeting of discrete areas. The data imply that pN HGT could advantage recipient bacteria for H+-dependent Mn2+ acquisition and Alphafold 3D models suggest conformational divergence among MC subgroups. It is proposed that Slc11 originated as a bacterial stress resistance function allowing Mn2+-dependent persistence in conditions adverse for growth, and that archaeal MH could contribute to eukaryogenesis as a Mn2+ sequestering defense perhaps favoring intracellular growth-competent bacteria.

Keywords: MntH (proton-dependent Mn transporter); Nramp (natural resistance-associated macrophage protein); divalent metal-ions; evolutionary rate-shift; horizontal gene transfer; molecular phylogeny; nutritional immunity; protonmotive force.


Conflict of interest statement

The author declares that the research was conducted in the absence of any commercial or financial relationships that could be construed as a potential conflict of interest.

Figures

FIGURE 1
FIGURE 1
Nramp diversification early in eukaryote evolution. The IQ-tree presented used 278 parsimony informative (PI) sites, the substitution model EX3, ML estimate of a.a. state frequency, free rate model of variation among sites with 13 categories (Le et al., 2008; Trifinopoulos et al., 2016). Sequences distribution (eukaryotic supergroups): Amorphea, Fungi (FMM, MUC, FMC, FMG: pN-I & aN-II) and Amoeba (AMB: pN-II & aN-II); TSAR, Stramenopiles (SEu: pN-I & aN-II) and Rhizaria (RHI: pN-I & aN-I); Archaeplastida, Green algae (VCC: pN-I & aN-II), Land plants (VKl, VMa: pN-I, aN-I & aN-II; VBr: pN-I & aN-II; VDP: aN-I & aN-II), Red algae (RHO: pN-II & aN-II) and Glaucophyta (GLA: pN-II & aN-I); Cryptophyta (CRY: pN-I & aN-I); Euglenozoa (Eug: pN-I & aN-II). Details are provided in the Supplementary Appendix (p. 11–14).
FIGURE 2
FIGURE 2
MntH H: prokaryotic precursor of Nramp. Phylogenetic analyses using 379 Slc11 PI sites identify MH as an evolutionary intermediate between MntH homologs of bacterial origin (MB, MA) and eukaryotic Nramp (aN and pN types, including MCs). The IQ-tree presented was inferred using the substitution model UL3, ML estimate of a.a. state frequency, free rate model of variation among sites with 19 categories (Le et al., 2008; Trifinopoulos et al., 2016). Symbols indicating Slc11 phylogroups are placed at the periphery of the tree and the confidence values for key nodes (underlined) are color-coded accordingly (OG, outgroup; MB, MntH B; (MAV, MntH AV), MA, MntH A; MH, MntH H; MCg, MntH Cg, MCb, MntH Cb, MCa, MntH Ca, pN-I, prototype Nramp I; MCaU, MntH CaU; pN-II, prototype Nramp II; aN-I, archetype Nramp I, aN-II, archetype Nramp II). Sequence details in the Supplementary Appendix (p. 15–23).
FIGURE 3
FIGURE 3
(Continued). Stepwise evolution of Slc11 proton translocation pathway. (A,B) MCb 3D structures from E. coleocola (outward open, 5M87) and S. capitis (inward open, 5M94) were used to display with a color code stepwise fixation of the residues forming Nramp proton translocation pathway, demonstrated by logos (insets) of Slc11 phylogroups and outgroup (Figure 2, 117 seqs in total): outgroup (7 seqs); MB (9 seqs); MAAV (16 seqs); MH (11 seqs); pN-I, MCg, MCb, MCa (33 seqs); pN-II, MCaU (14 seqs); aN-I (6 seqs); aN-II (21 seqs). The position in Slc11 family msa of each evolutionary rate-shift studied is highlighted with colors that indicate whether Nramp residue was already present in the outgroup (cyan) or predated MB (black, substrate binding site, green, H+ pathway), MA (orange), MH (pink) or Nramp (violet, blue) emergence. The corresponding MCb residues are shown in the 3D cartoons as sticks colored accordingly and identified by their position in Slc11 family msa. (A) In prokaryotes. Three views picturing alternate conformations display residue motion during cations transport cycle. (B) In eukaryotes. Detail of the H+ translocation pathway shows two mutations introducing novel polar side chains in Nramp TMS8. Their potential interaction with MH inherited charge network, at the interface of helices forming the “hash” module are presented in general and close-up views.
FIGURE 4
FIGURE 4
(Continued). Successive waves of co-evolved sites affected distinct areas of Slc11 carriers. Sites are illustrated by the corresponding residues from EcoDMT (top panel) and ScaDMT (bottom panel), shown as colored sticks to distinguish evolutionary classes and numbered according to their position in Slc11 family msa marked by matching color dots (Supplementary Figure S9). (A) Sites conserved between the outgroup and Slc11 families are located in areas (i) C-end of TMS1b/TMS2 N-end/loop 5/6, (ii) mid-TMS1 extended segment/TMS3 C-terminal third/TMS8 N-half, (iii) TMS1a N-end/mid TMS6b segment/TMS2 C-end/TMS5 N-end, plus the “loose” cluster (iv) formed by sites located at TMS6a C-end/TMS6b N-end/TMS10 C-terminal third and loop 2/3; (B–F), Evolutionary rate-shifts that predated successive phylogroups occupy distinct locations: MB (B) in area (v) including TMS1 and TMS6 central extended segments/TMS7 C-third/TMS3 C-third/TMS10 central portion/mid-TMS11 plus two sites at TMS5 C-end and TMS4 N-end; MA (C) in areas (vi) TMS3 N-half/TMS8 C-third/TMS9 N-end and (vii) involving TMS1a C-end/mid-TMS2/TMS7 C-third plus sites in TMS6b, TMS5 N-end and TMS10 C-end; MH (D), sites in areas (i) at mid-TMS1b/TMS7 C-end, (vii) mid-TMS7 and (vi) at mid-TMS4/mid-TMS9/TMS8 carboxy-end; ancestral Nramp (E), sites extending area (vi) TMS3 C-half/TMS8 N-half; aNs (F, cyan), including polar sites in TMS1b/mid-TMS3/TMS10 N-third.
FIGURE 5
FIGURE 5
Correspondence analysis of AF2 conformers predicted in individual Slc11 phylogroups. A multidimensional scaling method was used to position AF2 models with the most similar structural neighborhoods near each other (Holm, 2022). The known structures representing outward open and inward open conformations from phylogroups MntH A and MntH Cb served as references (6D91 and 5M87, and 6D9W and 5M94, respectively) as well as NRMT inward open template (7QIA) as indicated. Selected AF2 models from MA, MAV and MH were pooled to evaluate structural similarities across these phylogroups (highlighted in purple). Insets. Pooled MCa and plant pN-I (3) models; pool of 14 MCb predicted conformers.
FIGURE 6
FIGURE 6
Proposed evolution of the Slc11 family.

Similar articles

Cited by

References

    1. Antelo G. T., Vila A. J., Giedroc D. P., Capdevila D. A. (2020). Molecular evolution of transition metal bioavailability at the host-pathogen interface. Trends Microbiol. 29, 441–457. 10.1016/j.tim.2020.08.001 - DOI - PMC - PubMed
    1. Arnold B. J., Huang I. T., Hanage W. P. (2022). Horizontal gene transfer and adaptive evolution in bacteria. Nat. Rev. Microbiol. 20, 206–218. 10.1038/s41579-021-00650-4 - DOI - PubMed
    1. Ashkenazy H., Abadi S., Martz E., Chay O., Mayrose I., Pupko T., et al. (2016). ConSurf 2016: An improved methodology to estimate and visualize evolutionary conservation in macromolecules. Nucleic Acids Res. 44, W344–W350. 10.1093/nar/gkw408 - DOI - PMC - PubMed
    1. Benarroch J. M., Asally M. (2020). The microbiologist's guide to membrane potential dynamics. Trends Microbiol. 28, 304–314. 10.1016/j.tim.2019.12.008 - DOI - PubMed
    1. Betts H. C., Puttick M. N., Clark J. W., Williams T. A., Donoghue P. C. J., Pisani D. (2018). Integrated genomic and fossil evidence illuminates life's early evolution and eukaryote origin. Nat. Ecol. Evol. 2, 1556–1562. 10.1038/s41559-018-0644-x - DOI - PMC - PubMed