. 2022 Oct 14:12:993649.
doi: 10.3389/fonc.2022.993649. eCollection 2022.

Temporal radiographic and histological study of necrosis development in a mouse glioblastoma model

Affiliations

Temporal radiographic and histological study of necrosis development in a mouse glioblastoma model

Patricia P Yee et al. Front Oncol. .

Abstract

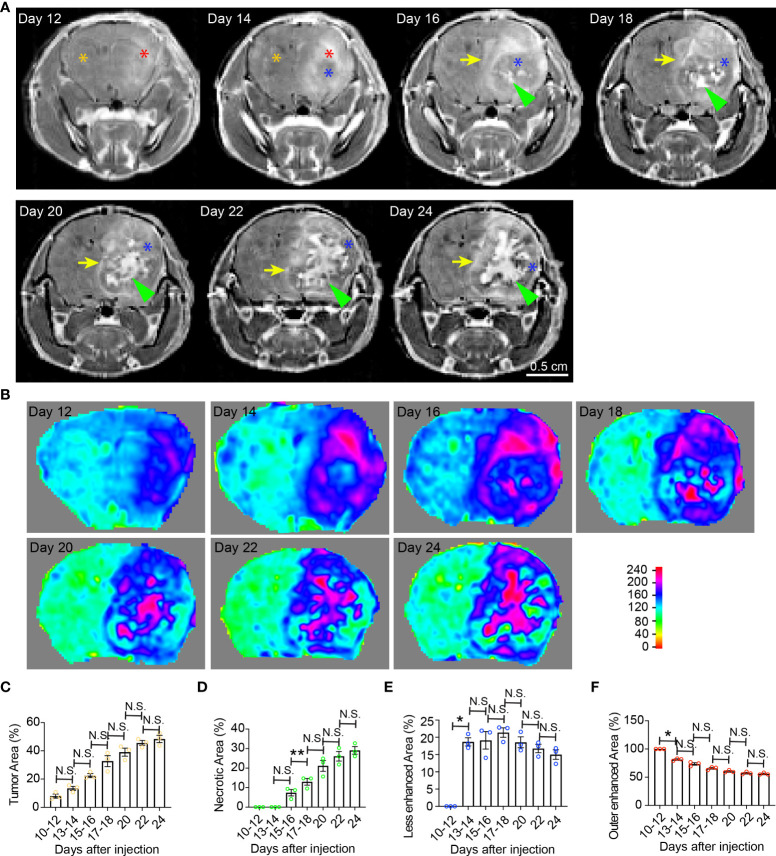
Tumor necrosis is a poor prognostic marker in glioblastoma (GBM) and a variety of other solid cancers. Accumulating evidence supports that necrosis could facilitate tumor progression and resistance to therapeutics. GBM necrosis is typically first detected by magnetic resonance imaging (MRI), after prominent necrosis has already formed. Therefore, radiological appearances of early necrosis formation and the temporal-spatial development of necrosis alongside tumor progression remain poorly understood. This knowledge gap leads to a lack of reliable radiographic diagnostic/prognostic markers in early GBM progression to detect necrosis. Recently, we reported an orthotopic xenograft GBM murine model driven by hyperactivation of the Hippo pathway transcriptional coactivator with PDZ-binding motif (TAZ) which recapitulates the extent of GBM necrosis seen among patients. In this study, we utilized this model to perform a temporal radiographic and histological study of necrosis development. We observed tumor tissue actively undergoing necrosis first appears more brightly enhancing in the early stages of progression in comparison to the rest of the tumor tissue. Later stages of tumor progression lead to loss of enhancement and unenhancing signals in the necrotic central portion of tumors on T1-weighted post-contrast MRI. This central unenhancing portion coincides with the radiographic and clinical definition of necrosis among GBM patients. Moreover, as necrosis evolves, two relatively more contrast-enhancing rims are observed in relationship to the solid enhancing tumor surrounding the central necrosis in the later stages. The outer more prominently enhancing rim at the tumor border probably represents the infiltrating tumor edge, and the inner enhancing rim at the peri-necrotic region may represent locally infiltrating immune cells. The associated inflammation at the peri-necrotic region was further confirmed by immunohistochemical study of the temporal development of tumor necrosis. Neutrophils appear to be the predominant immune cell population in this region as necrosis evolves. This study shows central, brightly enhancing areas associated with inflammation in the tumor microenvironment may represent an early indication of necrosis development in GBM.

Keywords: Glioblastoma; MRI; TAZ; magnetic resonance imaging; mouse model; tumor necrosis.


Conflict of interest statement

The authors declare that the research was conducted in the absence of any commercial or financial relationships that could be construed as a potential conflict of interest.

Figures

Figure 1
Figure 1
Temporal radiographic characterization of tumor necrosis development during early tumor progression via MR imaging. (A) Temporal development of GBM tumor necrosis during early, asymptomatic stages of tumor progression via representative serial T1-weighted post-gadolinium MRI scans of one LN229TAZ(4SA) tumor-bearing mouse. Orange asterisk: Normal brain parenchyma in the non-tumor containing hemisphere; red asterisk: Enhancing areas in the tumor-containing hemisphere; blue asterisk: The center of the tumor becomes less enhancing from day 14 onward, likely representing densely packed tumor cells; green arrowheads: Prominently enhancing foci within the less enhancing tumor stroma, likely representing active development of necrosis, which starts appearing from day 16. Yellow arrows: Peripheral enhancing interface between the less enhancing tumor tissue, as marked by blue asterisks, and the normal brain parenchyma. (B) Heatmaps of signal intensities generated using T1 post-contrast MRI images as in panel (A). (C) Quantification of tumor area (outlined by the peripheral enhancing interface indicated by yellow arrows) normalized to whole brain area at each timepoint indicated above in panel (A). pANOVA=0.003. Results of post hoc test for each continuous time point are indicated. (D) Quantification of necrotic areas—labeled by green arrowheads in panel (A)—normalized to corresponding tumor at each timepoint indicated above. pANOVA=0.0009. Results of post hoc test for each continuous time point were indicated. (E) Quantification of less-enhancing areas—labeled by blue asterisks in panel (A)—normalized to corresponding tumor at each timepoint indicated above. pANOVA=0.012. Results of post hoc test for each continuous time point are indicated. (F) Quantification of the outer enhanced areas—labeled by red asterisks in panel (A)—normalized to corresponding tumor at each timepoint indicated above. pANOVA=0.0011. Results of post hoc test for each continuous time point are indicated. Three mice were imaged as replicates with consistent observations; each datapoint shown in the bar graphs represents an animal (n=3). RM one-way ANOVA. Sidak’s multiple comparisons test was used in the post hoc test. All center values shown are mean values, and all error bars represent standard errors of the means (s.e.m). N.S.,p > 0.05. *,p < 0.05; **,p <0.01.
Figure 2
Figure 2
Temporal radiographic characterization of tumor necrosis development during late tumor progression via MR imaging. (A) Temporal development of GBM tumor necrosis during late tumor progression after onset of overt tumor-associated symptoms in tumor-bearing mice via representative serial T1-weighted post-gadolinium MRI scans of one LN229TAZ(4SA) tumor-bearing mouse (different from the animal used in Figure 1 ). Yellow asterisks: Brain parenchyma in the normal hemisphere; yellow arrows: More prominently enhancing rim at the outer edge of the tumor boundary, representing the tumor-infiltrating front; red asterisks: More prominently enhancing (but later unenhancing from day 29 onward) foci within the tumor stroma, representing active development of necrosis; green arrows: Prominently enhancing rim at the necrosis-cellular tumor (N-CT) interface, representing areas of active inflammation. (B) Heatmaps of signal intensities generated using T1 post-contrast MRI images as in panel (A). (C) Quantification of tumor area (outlined by the peripheral enhancing interface indicated by yellow arrows) normalized to whole brain area at each timepoint indicated above. p=0.3684. (D) Quantification of necrotic areas—labeled by red asterisks as in panel (A)—normalized to corresponding tumor area at each indicated timepoint as above. p=0.1164. Three mice were imaged as replicates until reached the terminal stage (one at day 28, the other two at day 32; n=2-3); each datapoint shown in the bar graphs represents an animal. All center values shown are mean values, and all error bars represent standard errors of the means (s.e.m). Mixed-effects analysis.
Figure 3
Figure 3
Comparison of different MRI modalities for temporal visualization of tumors and tumor necrosis using a murine GBM model. (A) Images acquired from various frequently utilized MR imaging modality for diagnostics and pre-operative planning in the clinical setting on the GBM tumor-bearing mouse devised by our lab. Starting from 10 days post tumor cell implantation, the mouse underwent serial brain MRI. Time points were pre-determined based on our previous histological studies on days 10, 13, 15, 17, 20, 22, 24, and 28, which is the end point of this GBM tumor-bearing mouse. (B) Heatmaps of signal intensities generated using MRI images as in panel (A). Arrows: Enhancing areas likely representing tumors. One mouse was imaged.
Figure 4
Figure 4
Tumor and necrosis visualized in a glioblastoma patient using standard MRI sequences. (A) A panel of representative images comparing T1 weighted pre-contrast (T1-pre), T1 weighted post-contrast (T1-post), and T2 sequences, which are routinely utilized in diagnostics and pre-operative planning for glioblastoma patient, are comparable to the images acquired using the murine GBM model which we devised. It is evident that T1-weighted post-gadolinium image remains by far the best sequence for the visualization of GBM tumor necrosis. (B) Heatmaps of signal intensities generated using MRI images as in panel (A). Arrows: Less enhancing foci representing the central necrotic areas with irregular inner margins near the enhancing edges.
Figure 5
Figure 5
Histological characterization of the temporal development of GBM tumor necrosis. (A) Temporal development of GBM tumor necrosis from early to late tumor progression using representative time-course H&E-stained formaldehyde-fixed paraffin embedded sections of LN229TAZ(4SA) brain tumor-bearing mice. Each column represents images acquired from the same animal at a certain tumor progression stage. In each section, the tumor stroma has been traced out using a dashed line. Areas marked by red rectangles were further magnified in the images in the bottom of each column. For day 10 and 16 tumors, the areas marked by green (tumor border) or blue (cellular tumor) rectangles were also magnified and shown in the bottom of the correspondent columns. Yellow arrowheads: small, round, dark purple nuclei, likely representing mouse immune cells; red arrowheads: large, light purple nuclei, representing LN229 human tumor cells. (B) Representative image of a H&E-stained formaldehyde-fixed paraffin-embedded human GBM brain section showing cellular and necrotic tumor areas. The areas marked by green (peri-necrotic zone, PNZ), blue (cellular tumor, CT), or red (necrotic area, N) rectangles were magnified and shown on right. Arrowheads: small, round, dark purple nuclei, likely representing immune cells. Specimens from three different patients (n=3) were examined independently with similar observations. (C) Quantification of tumor area normalized to whole brain area at each timepoint indicated in panel (A). pANOVA< 0.0001. Results of post hoc test for each continuous time point are indicated. (D) Quantification of necrotic areas, appearing as pale pink, acellular regions, normalized to corresponding tumor area at each timepoint indicated above pANOVA< 0.0001. Results of post hoc test for each continuous time point are indicated. Tumors from three to five tumor-bearing mice were sectioned and imaged in parallel as replicates with consistent observations (n=3-5); each datapoint shown in the bar graphs represents an animal. Scale bar is in µm. Ordinary one-way ANOVA. Sidak’s multiple comparisons test was used in the post hoc test. All center values shown are mean values, and all error bars represent standard errors of the mean (s.e.m). N.S., p > 0.05. *,p < 0.05; **,p < 0.01.
Figure 6
Figure 6
Immunohistochemical characterization of the temporal development of GBM tumor necrosis. (A) Temporal development of GBM tumor necrosis from the early to the late tumor progression using representative time-course CD11b, Ly6G, and DAPI immunofluorescence staining on brain sections collected from LN229TAZ(4SA) brain tumor-bearing mice. (same cohort of animals as in Figure 5 ). For day 10, an area of cellular tumor was imaged. For day 16-30, an area of peri-necrotic zone at the interface between cellular and necrotic tumor was imaged for each sample. Images in each column were acquired from the same animal. (B) Percentage of CD11b+ cells normalized to all DAPI+ cells in one high-power 40X field collected at each timepoint indicated in panel (A). pANOVA<0.0001. Results of post hoc test for each continuous time point are indicated. (C) Percentage of Ly6G+ cells normalized to all CD11b+ cells in one high-power 40X field collected at each timepoint indicated in panel (A). pANOVA<0.0001. Results of post hoc test for each continuous time point are indicated. Each datapoint shown in the bar graphs represents an animal. Ordinary one-way ANOVA. Sidak’s multiple comparisons test was used in the post hoc test. All center values shown are mean values, and all error bars represent standard errors of the means (s.e.m). N.S., p > 0.05. *,p < 0.05; ***,p < 0.001; ****,p < 0.0001. (D) Comparison of immunofluorescent images as above acquired from a terminal-stage (i.e., day 30) section between the peri-necrotic zone, denoted by PNZ, and from the tumor border; dashed line outlines the tumor (T) and normal parenchyma (P) border. Tumors from three tumor-bearing mice were sectioned and imaged in parallel as replicates with consistent observations (n=3). Scale bar is in µm.

Similar articles

Cited by

References

    1. Graif M, Bydder GM, Steiner RE, Niendorf P, Thomas DG, Young IR. Contrast-enhanced MR imaging of malignant brain tumors. AJNR Am J Neuroradiol (1985) 6:855–62. - PMC - PubMed
    1. Watanabe M, Tanaka R, Takeda N. Magnetic resonance imaging and histopathology of cerebral gliomas. Neuroradiology (1992) 34:463–9. doi: 10.1007/BF00598951 - DOI - PubMed
    1. Iwama T, Yamada H, Sakai N, Andoh T, Nakashima T, Hirata T, et al. . Correlation between magnetic resonance imaging and histopathology of intracranial glioma. Neurol Res (1991) 13:48–54. doi: 10.1080/01616412.1991.11739964 - DOI - PubMed
    1. Munir S, Khan SA, Hanif H, Khan M. Diagnostic accuracy of magnetic resonance imaging in detection of intra-axial gliomas. Pak J Med Sci (2021) 37:125–30. doi: 10.12669/pjms.37.1.2489 - DOI - PMC - PubMed
    1. Pierallini A, Bonamini M, Bozzao A, Pantano P, Stefano DD, Ferone E, et al. . Supratentorial diffuse astrocytic tumours: proposal of an MRI classification. Eur Radiol (1997) 7:395–9. doi: 10.1007/s003300050173 - DOI - PubMed