

Predictive value of DCE-MRI and IVIM-DWI in osteosarcoma patients with neoadjuvant chemotherapy
- PMID: 36313686
- PMCID: PMC9614152
- DOI: 10.3389/fonc.2022.967450
Predictive value of DCE-MRI and IVIM-DWI in osteosarcoma patients with neoadjuvant chemotherapy
Abstract
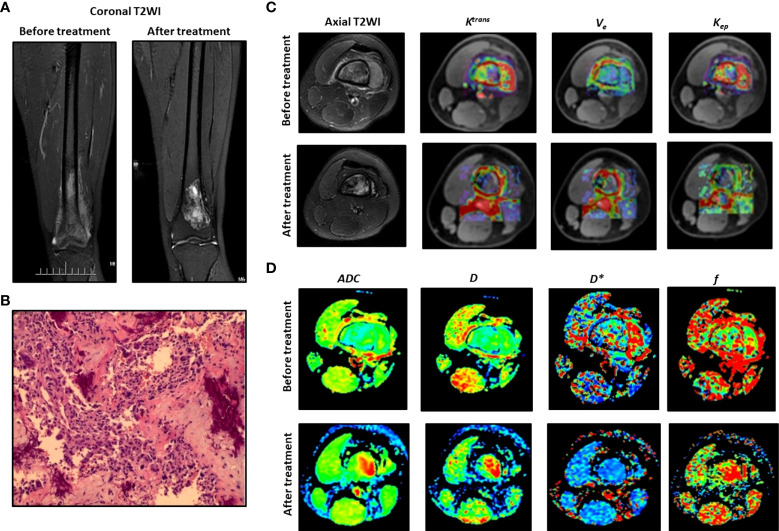
Objective: To investigate the predictive value of dynamic contrast enhanced MRI (DCE-MRI) and intravoxel incoherent motion diffusion-weighted imaging (IVIM-DWI) for clinical outcomes of osteosarcoma patients with neoadjuvant chemotherapy.
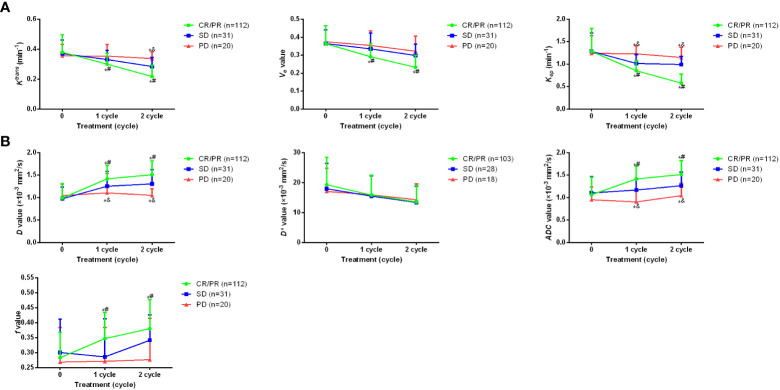
Methods: The present prospective single-arm cohort study enrolled 163 patients of osteosarcoma during July 2017 to July 2022. All patients received the same treatment strategy of neoadjuvant chemotherapy. Both DCE-MRI and IVIM-DWI were conducted for the patients before the chemotherapy, as well as after one or two chemotherapy treatment cycles. The imaging parameters of contrast agent transfer rate between blood and tissue (Ktrans ), contrast agent back-flux rate constant (Kep ), extravascular extracellular fractional volume (Ve ), as well as pure diffusion coefficient (D value), pseudo-diffusion coefficient (D* value), apparent diffusion coefficient (ADC) and the perfusion fraction (f value) were recorded. RECIST standard [complete response (CR), partial response (PR), stable disease (SD), progressive disease (PD)] was used as the main clinical outcome.
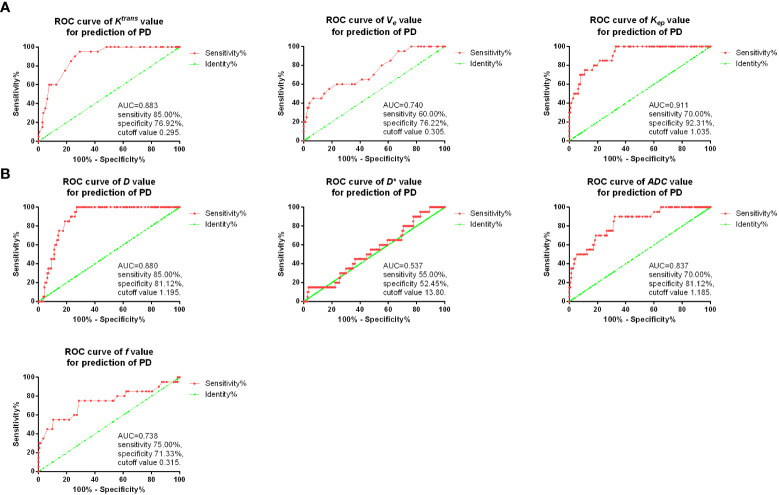
Results: After two treatment cycles, 112 (68.71%) cases were with CR and PR, 31 (19.02%) cases were with SD and 20 cases (12.27%) were with PD. After 1~2 treatment cycles, patients with CR/PR showed significantly markedly lower Ktrans , Kep , Ve values, while higher D, ADC and f values compared with SD or PD patients. Alkaline phosphatase (ALP) and lactate dehydrogenase (LDH) were positively correlated with values of Ktrans , Kep , and Ve , while negative correlation was observed between ALP and values of D, ADC and f, as well as between LDH and D and ADC after the whole treatment. D and Kep values after two treatment cycles showed the best predictive value for diagnosis of PD. The values of Ktran , Kep , ADC as well as ALP and LDH were all risk factors for PD after neoadjuvant chemotherapy.
Conclusion: DCE-MRI and IVIM-DWI have the potential to predict clinical outcomes of osteosarcoma patients with neoadjuvant chemotherapy.
Keywords: DCE-MRI; IVIM-DWI; clinical outcomes; osteosarcoma; predictor.
Copyright © 2022 Xia, Wen, Zhou, Li, Lu, Liu and Yu.
Conflict of interest statement
The authors declare that the research was conducted in the absence of any commercial or financial relationships that could be construed as a potential conflict of interest.
Figures

References
-
- Sayles LC, Breese MR, Koehne AL, Leung SG, Lee AG, Liu HY, et al. . Genome-informed targeted therapy for osteosarcoma. Cancer Discov (2019) 9(1):46–63. doi: 10.1158/2159-8290.Cd-17-1152 - DOI - PMC - PubMed
LinkOut - more resources
Full Text Sources
Research Materials