. 2022 Oct 12:13:1011383.
doi: 10.3389/fendo.2022.1011383. eCollection 2022.

Myocardial protection of S-nitroso-L-cysteine in diabetic cardiomyopathy mice

Affiliations

Myocardial protection of S-nitroso-L-cysteine in diabetic cardiomyopathy mice

Lulu Peng et al. Front Endocrinol (Lausanne). .

Abstract

Diabetic cardiomyopathy (DCM) is a severe complication of diabetes mellitus that is characterized by aberrant myocardial structure and function and is the primary cause of heart failure and death in diabetic patients. Endothelial dysfunction plays an essential role in diabetes and is associated with an increased risk of cardiovascular events, but its role in DCM is unclear. Previously, we showed that S-nitroso-L-cysteine(CSNO), an endogenous S-nitrosothiol derived from eNOS, inhibited the activity of protein tyrosine phosphatase 1B (PTP1B), a critical negative modulator of insulin signaling. In this study, we reported that CSNO treatment induced cellular insulin-dependent and insulin-independent glucose uptake. In addition, CSNO activated insulin signaling pathway and promoted GLUT4 membrane translocation. CSNO protected cardiomyocytes against high glucose-induced injury by ameliorating excessive autophagy activation, mitochondrial impairment and oxidative stress. Furthermore, nebulized CSNO improved cardiac function and myocardial fibrosis in diabetic mice. These results suggested a potential site for endothelial modulation of insulin sensitivity and energy metabolism in the development of DCM. Data from these studies will not only help us understand the mechanisms of DCM, but also provide new therapeutic options for treatment.

Keywords: S-nitrosothiols; S-nitrosylation; diabetic cardiomyopathy; glucose uptake; insulin signaling pathway.


Conflict of interest statement

The authors declare that the research was conducted in the absence of any commercial or financial relationships that could be construed as a potential conflict of interest.

Figures
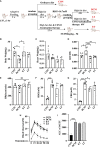
Figure 1
Figure 1
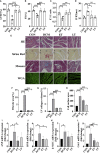
Mouse body weight, heart weight and blood glucose levels. (A) A flowchart showing the experimental process for modeling mice. (B) Body weight of mice. (C) Heart weight of mice. (D) Heart weight to body weight ratio (HW/BW). (E) Heart rate (HR). (F) Random body glucose(RBG). (G) Fasting blood glucose levels (FBG). (H) After fasting for 16 hours, mice were given glucose solution by gavage, and the corresponding blood glucose values were measured at different time points. The corresponding curve was drawn, namely, an oral glucose tolerance test (OGTT) curve. (I) The area under the curve (AUCglucose) was quantified. * represents p < 0.05; ** represents p < 0.01; *** represents p < 0.001. The “ns” symbol stands for “no significance”.
Figure 2
Figure 2
The effect of SNO on cardiac function in diabetic mice. Indices of cardiac systolic function, (A) Left ventricular ejection fraction (EF %). (B) Fractional shortening (FS %). Indices of cardiac diastolic function, (C) Early-to-late septal annulus motion in diastole (E’/A’) and (D) Isovolumic relaxation time (IVRT). (E) HE staining, Sirius red staining, Masson trichrome staining and WGA staining of mouse hearts. Scale bar=50 mm. (F) The percentage of fibrotic area was quantified. (G) The percentage of LV collagen area was quantified. (H) Quantitative analysis of cardiac myocyte cross-sections. (I-L) Relative ANP, BNP, β-MHC and Col-1 mRNA expression normalized to GAPDH. * represents p < 0.05; ** represents p < 0.01; *** represents p < 0.001.
Figure 3
Figure 3
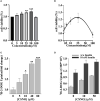
CSNO promoted cellular glucose uptake. (A) H9c2 cells were incubated with CSNO at different concentrations for 1 h. Cell viability was examined using a CCK8 kit. (B) The corresponding curve diagram of cell viability. (C) CSNO promoted cellular glucose uptake in a concentration-dependent manner. (D) CSNO increased insulin-dependent and noninsulin-dependent glucose uptake. * represents p < 0.05; ** represents p < 0.01; *** represents p < 0.001.
Figure 4
Figure 4
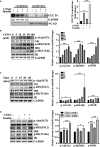
CSNO promoted GLUT4 membrane translocation and the insulin signaling pathway. (A) After the cytoplasm and cell membrane were separated, the expression of GLUT4 on membrane protein was detected. It was normalized to N-cadherin. (B) CSNO concentration-dependently activated the insulin signaling pathway in H9c2 cells. The expression level and phosphorylation level of Akt, IRS and IR were analyzed by Western blot. The protein band diagram and quantitative statistical diagram are shown. (C) CSNO time-dependently activated the insulin signaling pathway in H9c2 cells. The expression level and phosphorylation level of Akt, IRS and IR were analyzed by Western blot. The protein band diagram and quantitative statistical diagram are shown. (D) CSNO promoted activation of the insulin signaling pathway and further increased the effect of insulin on the insulin signaling pathway. The expression level and phosphorylation level of Akt, IRS and IR were analyzed by Western blot. The protein band diagram and quantitative statistical diagram are shown. * represents p < 0.05; *** represents p < 0.001.
Figure 5
Figure 5
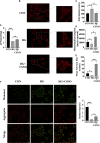
CSNO alleviated insulin resistance. (A) Glucose uptake was detected by fluorescence analysis of 2-NBDG uptake by cells. Scale bar=100 μm. (B) The statistical graph of fluorescence intensity which was analyzed with imageJ software. Scale bar=100 μm. (C) The expression level and phosphorylation level of Akt, IRS and IR were analyzed by Western blot. (D) After the cytoplasm and cell membrane were separated, the expression of GLUT4 on membrane protein was detected. It was normalized to N-cadherin. ** represents p < 0.01; ***represents p < 0.001.
Figure 6
Figure 6
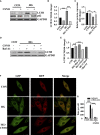
CSNO inhibited high glucose-induced excessive autophagy. (A-C) The expression levels of P62, LC3 II/I and GAPDH were analyzed by Western blot. The protein band diagram and quantitative statistical diagram are shown. (D, E) After adding the autophagy inhibitor Baf-A1,the expression of LC3 II/I and GAPDH was analyzed by Western blot. The protein band diagram and quantitative statistical diagram are shown. (F) An adenovirus expressing GFP-RFP-LC3 protein was used to detect autophagic flux. Scale bar=10 μm. (G) To quantify yellow and red LC3 dots per cell in each condition, Image-Pro Plus was used. * represents p < 0.05; ** represents p < 0.01; *** represents p < 0.001.
Figure 7
Figure 7
CSNO ameliorated high glucose-induced mitochondrial dysfunction. (A) ATP assay kits were used to determine cellular ATP levels. (B) Analysis of mitochondria stained with MitoTracker using confocal microscopy. Scale bar =10 μm. (C-E) MiNa in ImageJ was used to analyze the structural characteristics of the mitochondrial network, including individuals, mitochondrial footprint and mean network size. (F) Mitochondrial membrane potential (MMP) was determined by staining with JC1. JC-1 aggregates emit red fluorescence in healthy mitochondria with polarized inner mitochondria. As MMP dissipates, cytosolic monomers of JC-1 emit green fluorescence. Scale bar=50 μm. (G) A fluorescence ratio of red to green was used to calculate the MMP of cardiomyocytes for each group. * represents p < 0.05; ** represents p < 0.01; *** represents p < 0.001.
Figure 8
Figure 8
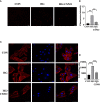
CSNO promoted high glucose-induced oxidative stress. (A, B) Analysis of reactive oxygen species (ROS) by dihydroethidium (DHE). Scale bar =100 μm. (C, D) The size of the cell was determined by detecting filaments of F-actin in the cell cytoskeleton using phalloidin. Scale bar=100 μm. ** represents p < 0.01; *** represents p < 0.001.

References

    1. Saeedi P, Petersohn I, Salpea P, Malanda B, Karuranga S, Unwin N, et al. . Global and regional diabetes prevalence estimates for 2019 and projections for 2030 and 2045: Results from the international diabetes federation diabetes atlas, 9(th) edition. Diabetes Res Clin Pract (2019) 157:107843. doi: 10.1016/j.diabres.2019.107843 - DOI - PubMed
    1. Wang Y, Luo W, Han J, Khan ZA, Fang Q, Jin Y, et al. . MD2 activation by direct AGE interaction drives inflammatory diabetic cardiomyopathy. Nat Commun (2020) 11:2148. doi: 10.1038/s41467-020-15978-3 - DOI - PMC - PubMed
    1. Gulsin GS, Brady EM, Swarbrick DJ, Athithan L, Henson J, Baldry E, et al. . Rationale, design and study protocol of the randomised controlled trial: Diabetes interventional assessment of slimming or training tO lessen inconspicuous cardiovascular dysfunction (the DIASTOLIC study). BMJ Open (2019) 9:e023207. doi: 10.1136/bmjopen-2018-023207 - DOI - PMC - PubMed
    1. Guo R, Hua Y, Rogers O, Brown TE, Ren J, Nair S. Cathepsin K knockout protects against cardiac dysfunction in diabetic mice. Sci Rep (2017) 7:8703. doi: 10.1038/s41598-017-09037-z - DOI - PMC - PubMed
    1. Li T, Ma X, Fedotov D, Kjaerulff L, Frydenvang K, Coriani S, et al. . Structure elucidation of prenyl- and geranyl-substituted coumarins in gerbera piloselloides by NMR spectroscopy, electronic circular dichroism calculations, and single crystal X-ray crystallography. Mol (Basel Switzerland) (2020) 25:1706. doi: 10.3390/molecules25071706 - DOI - PMC - PubMed

Publication types

MeSH terms