. 2023 May 2;146(5):1844-1858.
doi: 10.1093/brain/awac402.

Imbalance of NRG1-ERBB2/3 signalling underlies altered myelination in Charcot-Marie-Tooth disease 4H

Affiliations

Imbalance of NRG1-ERBB2/3 signalling underlies altered myelination in Charcot-Marie-Tooth disease 4H

Lara El-Bazzal et al. Brain. .

Abstract

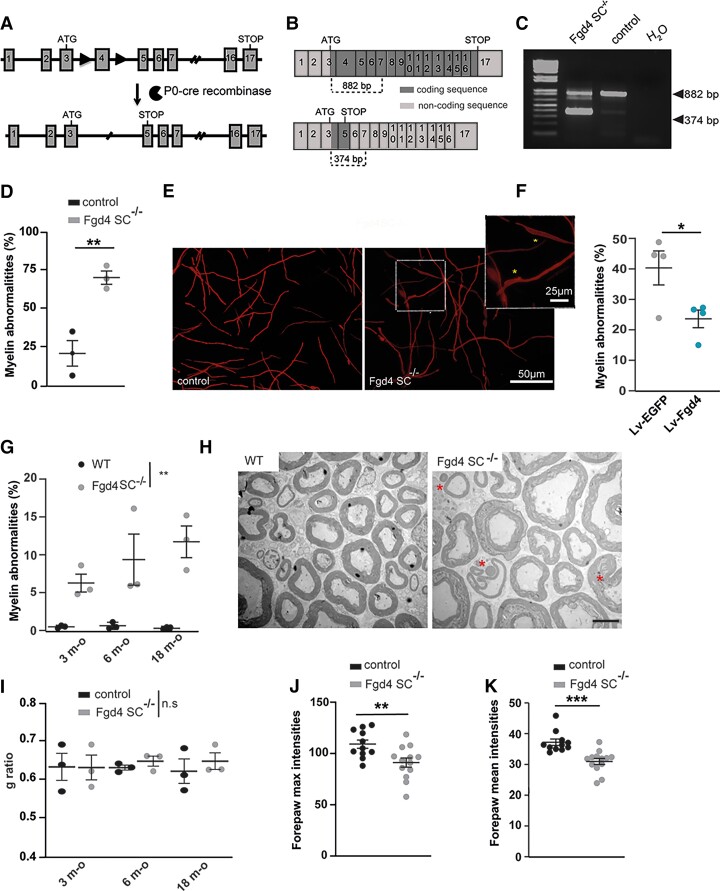
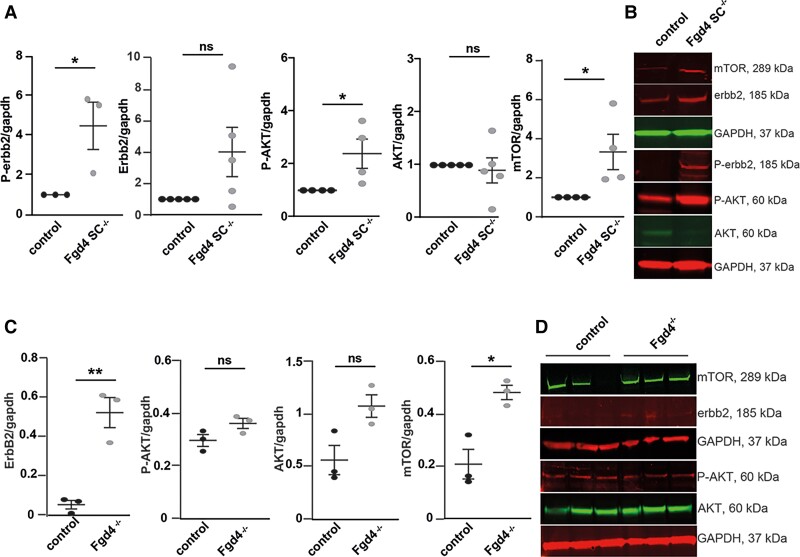
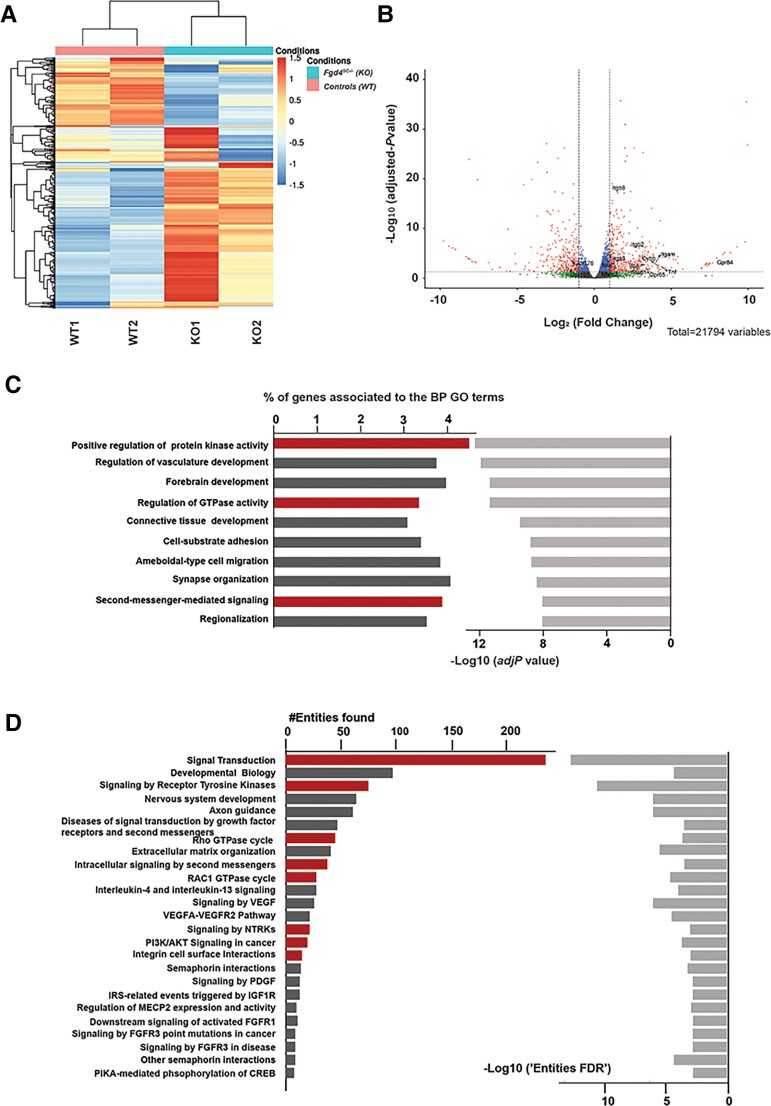
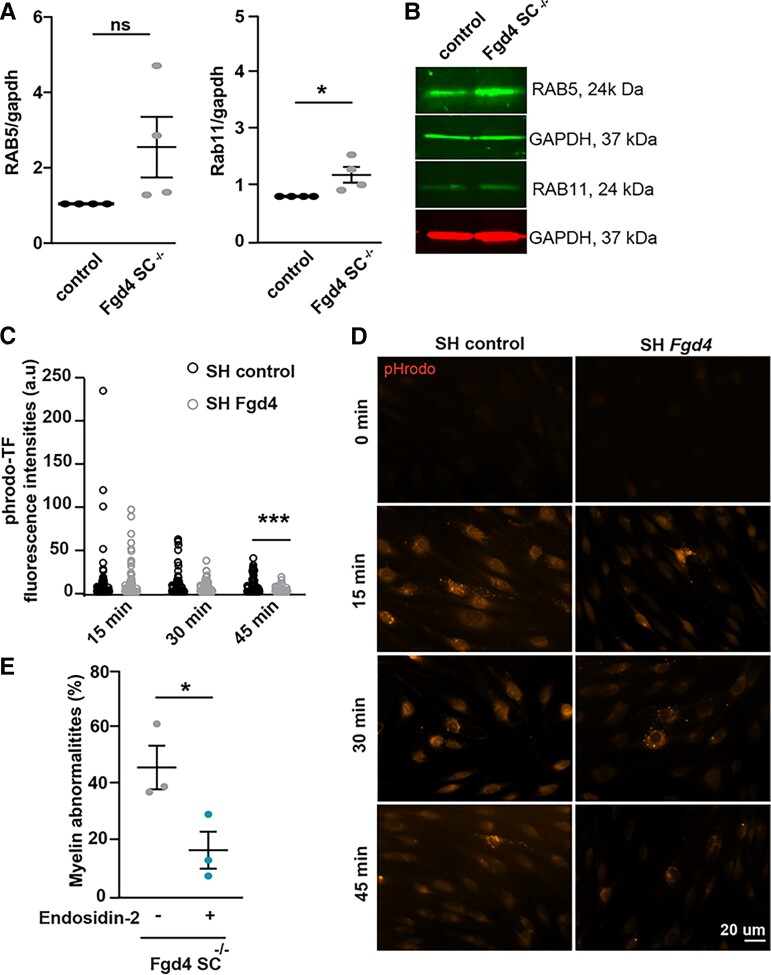
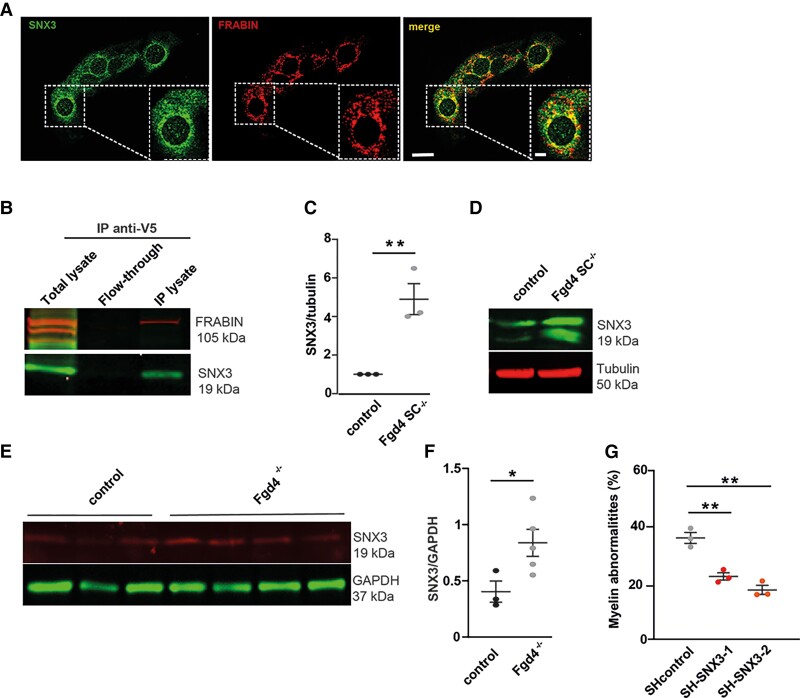
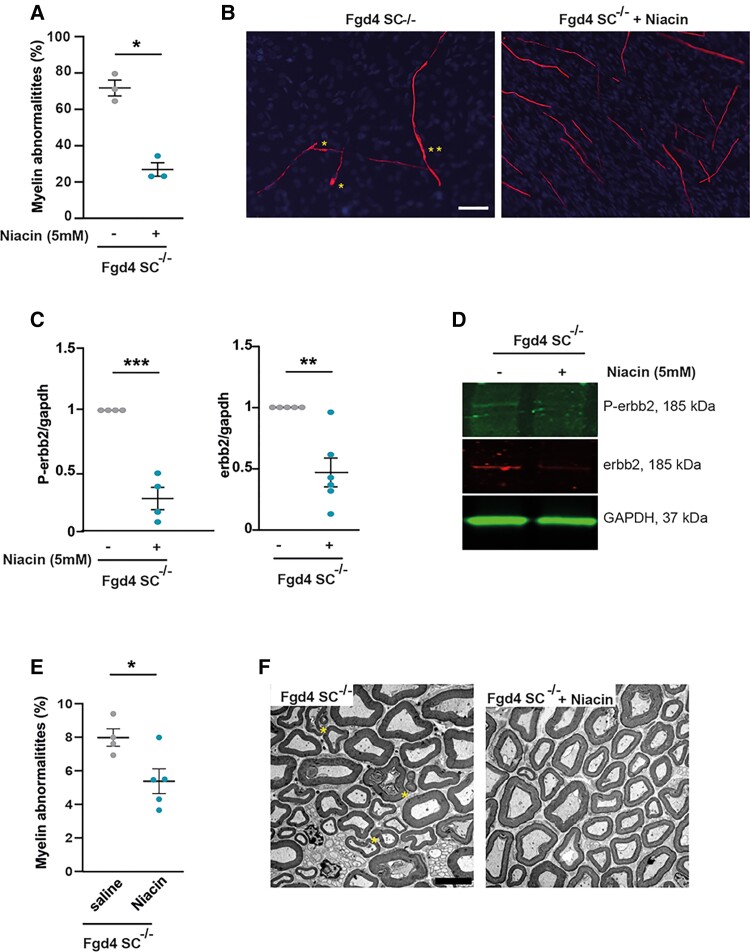
Charcot-Marie-Tooth (CMT) disease is one of the most common inherited neurological disorders, affecting either axons from the motor and/or sensory neurons or Schwann cells of the peripheral nervous system (PNS) and caused by more than 100 genes. We previously identified mutations in FGD4 as responsible for CMT4H, an autosomal recessive demyelinating form of CMT disease. FGD4 encodes FRABIN, a GDP/GTP nucleotide exchange factor, particularly for the small GTPase Cdc42. Remarkably, nerves from patients with CMT4H display excessive redundant myelin figures called outfoldings that arise from focal hypermyelination, suggesting that FRABIN could play a role in the control of PNS myelination. To gain insights into the role of FGD4/FRABIN in Schwann cell myelination, we generated a knockout mouse model (Fgd4SC-/-), with conditional ablation of Fgd4 in Schwann cells. We show that the specific deletion of FRABIN in Schwann cells leads to aberrant myelination in vitro, in dorsal root ganglia neuron/Schwann cell co-cultures, as well as in vivo, in distal sciatic nerves from Fgd4SC-/- mice. We observed that those myelination defects are related to an upregulation of some interactors of the NRG1 type III/ERBB2/3 signalling pathway, which is known to ensure a proper level of myelination in the PNS. Based on a yeast two-hybrid screen, we identified SNX3 as a new partner of FRABIN, which is involved in the regulation of endocytic trafficking. Interestingly, we showed that the loss of FRABIN impairs endocytic trafficking, which may contribute to the defective NRG1 type III/ERBB2/3 signalling and myelination. Using RNA-Seq, in vitro, we identified new potential effectors of the deregulated pathways, such as ERBIN, RAB11FIP2 and MAF, thereby providing cues to understand how FRABIN contributes to proper ERBB2 trafficking or even myelin membrane addition through cholesterol synthesis. Finally, we showed that the re-establishment of proper levels of the NRG1 type III/ERBB2/3 pathway using niacin treatment reduces myelin outfoldings in nerves of CMT4H mice. Overall, our work reveals a new role of FRABIN in the regulation of NRG1 type III/ERBB2/3 NRG1signalling and myelination and opens future therapeutic strategies based on the modulation of the NRG1 type III/ERBB2/3 pathway to reduce CMT4H pathology and more generally other demyelinating types of CMT disease.

Keywords: Charcot–Marie–Tooth; NRG1/ERBB2/3; endocytic trafficking; myelin outfoldings; niacin treatment.


Conflict of interest statement

The authors declare that there is no conflict of interest.

Figures

Figure 1
Figure 1
Generation and phenotypic characterization of a new mouse model of CMT4H. (AC) Generation of a conditional knockout mouse model for CMT4H. (A) The floxed allele (Fgd4fl/+) was generated by flanking exon 4 with loxP sites (black arrowheads) in the Fgd4 gene leading to a frameshift by generation of a premature stop codon in exon 5. The conditional deletion of Fgd4 in SCs is induced by crossing Fgd4fl/fl mice with mice expressing the cre recombinase under the Mpz/P0 promoter. For simplification the conditional knockout Fgd4fl/fl; P0cre mice are referred to as Fgd4SC–/–. (B) Fgd4 transcript before (top) or after (bottom) excision of exon 4 following cre-recombinase expression. (C) Excision of the exon 4 from Fgd4 transcript was verified by RT-PCR using RNA extracted from the sciatic nerves of Fgd4SC–/– and control mice. Due to exon 4 excision, the size of the amplified amplicon was 882 bp and 374 bp in WT and Fgd4SC–/– sciatic nerves, respectively. (D and E) Loss of Fgd4/FRABIN alters myelination in vitro. (D) Number of myelin anomalies quantified in WT and Fgd4SC–/– co-cultures. The presence of focal hypermyelination defects was evaluated in 150–160 myelinated segments per coverslip and three independent cultures. Myelinated segments were visualized by immunolabelling of MBP. Data are expressed as mean ± SEM. Statistical analysis: two-way ANOVA with Sidak post hoc test. (E) Illustration of myelinated segments in control and Fgd4SC–/– co-cultures. Examples of myelin abnormalities that can be observed in the enlarged image and identified by asterisks. (F) Overexpression of Fgd4/FRABIN in Fgd4SC–/– co-cultures reduces the proportion of abnormally myelinated fibres. Fgd4SC–/– co-cultures were infected with Lv-EGFP or Lv-Fgd4, 1 day after seeding. Data are expressed as mean percentage ± SEM (n = 4 independent cultures). Statistical analysis: unpaired Student’s t-test. (G and H) Loss of Fgd4/FRABIN alters PNS myelination in vivo. (G) Proportion of abnormal myelinated fibres in the distal part of the sciatic nerve of 3-, 6- and 18-month-old WT and Fgd4SC–/– mice (n = 3 animals per genotype). Data are expressed as mean percentage ± SEM. Statistical analysis: two-way repeated-measures ANOVA (group × time) with Sidak post hoc test. (H) Electron microscopy pictures illustrating myelination of sciatic nerves of WT (left) and Fgd4SC–/– (right) mouse. Asterisks indicate outfoldings. Scale bar = 5 µm. (I) g-Ratio analysis revealed no statistical difference in myelin thickness in the sciatic nerve of at 3-, 6- and 18-month-old WT and Fgd4SC–/– mice. A total of 500–1000 axons between 0.5 and 6 µm for animals (n = 3 per genotype) were analysed. Data are presented as mean ± SEM (n = 3 animals). (J and K) Maximum and mean forepaw intensities are significantly decreased in Fgd4SC–/– mice compared to WT mice. Data are expressed as mean ± SEM (n = 11 WT and n = 13 Fgd4SC–/– mice). *P < 0.05, **P < 0.01, ***P < 0.001.
Figure 2
Figure 2
Neuregulin-1 type III/ERBB2/3/AKT/mTOR pathway is upregulated in CMT4H models. (A and B) Phosphorylated ERBB2 (P-ERBB2) and AKT (P-AKT) as well as mTOR expression are significantly increased in Fgd4SC–/– co-cultures compared to control. (A) Levels of expression of P-ERBB2, ERBB2, P-AKT, AKT and mTOR were assessed by western blot analysis. Data are expressed as mean ± SEM (n = 3–4 co-cultures) and normalized to the control values. Statistical analysis: unpaired Student’s t-test. (B) Western blot pictures illustrating the expression of the markers described in A. (C and D) Levels of expression of P-ERBB2, ERBB2, P-AKT, AKT and mTOR were assessed by western blot analysis in the sciatic nerves of Fgd4–/– mice compared to WT mice. (C) Data are expressed as mean ± SEM (n = 3 animals per genotype). Statistical analysis: unpaired Student’s t-test. (D) Western blot pictures illustrating the expression of the markers described in C. *P < 0.05, **P < 0.01, ***P < 0.001.
Figure 3
Figure 3
Transcriptional profiles of in vitro myelin samples (DRG/SC co-cultures) from conditional knockout (Fgd4SC–/–) and control (WT) mice. (A) Full heat map of unsupervised hierarchical clustering of the four samples (n = 2 replicates for Fgd4SC–/– and 2 replicates for WT). The scale bar unit is obtained applying a variance stabilizing transformation to the count data (DESeq2: VarianceStabilizingTransformation) before normalization. (B) Volcano plots showing the distribution of gene expression fold changes and adjusted P-values between the two conditions. A total number of 21 794 genes were tested. Padj < 0.05 was used as the threshold to reject the null hypothesis and consider the difference in gene expression. Red plots represent significantly deregulated genes [adjusted P-value < 0.05, with fold change (FC) > 2 or <−2]. Genes with significant deregulation (adjusted P-value < 0.05) but with small FC (−2 < FC < 2) are indicated in blue. Green and grey dots represent genes with non-significant fold changes (adjusted P > 0.05). (C) Top 10 BP GO terms enriched in the DEGs. We identified BPs with an adjusted P-value lower than 0.05. The bars on the left represent the percentage of DEGs determined for each represented GO term from the total number of DEGs. Light grey bars on the right represent the enrichment score (–Log10 of adjusted P-value) for each GO term. GO terms with particularly interesting functions, regarding the NRG1 type III pathway and FRABIN, are highlighted in red. (D) Top 25 reactome pathways enriched for the 536 genes found in the top 10 significantly enriched GO terms from C (adj. P-value < 0.001). The bars represent the number of DEGs found in each reactome pathway. Pathways with particularly interesting functions regarding the NRG1 type III pathway and FRABIN are highlighted in red.
Figure 4
Figure 4
Altered endocytic trafficking contribute to the abnormal myelination observed in Fgd4SC–/– conditions. (A and B) Expression of two endosomal markers (i.e. RAB5: early endosome and RAB11: recycling endosome) in Fgd4SC–/– co-cultures: RAB11 is significantly upregulated in in Fgd4SC–/– co-cultures as compared to control (A). Quantification of RAB5 and RAB11 expression levels in western blot observed in B. Data are expressed as mean ± SEM (n = 3 co-cultures) and normalized to the control values. Statistical analysis: unpaired Student’s t-test. (B) Illustration of RAB5 and RAB11 expression patterns observed by western blot in control and Fgd4SC–/– co-cultures. (C and D) pHrodo-Transferrin (pHrodo-TF) trafficking is altered in primary SCs infected with a Lv expressing a shRNA control or directed against Fgd4. After Lv infection (48 h), SCs were incubated with pHrodo-TF during 15, 30 or 45 min and immediately fixed in PFA 4%. pHrodo-TF is weakly fluorescent at a neutral pH, but brightly fluorescent in acidic compartments such as endosomes. (C) pHrodo-TF fluorescence was quantified in infected cells (n = 60–80 cells for each condition, from three independent cultures) and data are represented as individual values for each time point. Statistical analysis: unpaired Student’s t-test for each time point. (D) Examples of pHrodo-TF labelling after 0, 15, 30 or 45 min in control (shRNA-control) and knocked-down (shRNA-Fgd4) conditions. (E) The blocking of endosomal recycling using Endosidin-2 (1 µM) reduces significantly the proportion of abnormal myelin in Fgd4SC–/– co-cultures compared to non-treated conditions. Data are expressed as mean percentage ± SEM (n = 3 co-cultures). Statistical analysis: unpaired Student’s t-test. *P < 0.05, **P < 0.01, ***P < 0.001.
Figure 5
Figure 5
SNX3, a new partner of FRABIN, contribute to abnormal myelination in vitro. (A) FRABIN (red) colocalizes with the endosomal marker SNX3 (green) in the immortalized S16 rat SC line. Colocalization areas are visualized in yellow in the merge picture. Scale bar of the whole picture = 20 µm, scale bar of the enlarged picture = 10 µm. (B) Co-immunoprecipitation (IP) of SNX3 and FRABIN in HEK293 cells overexpressing V5-tagged FRABIN.SNX3 was detected using an anti-SNX3 antibody after immunoprecipitation of V5-FRABIN using an anti-V5 antibody. Note that both FRABIN and SNX3 are found only in the IP lysate, and not in the flow-through fraction. (C and D) SNX3 levels are increased in Fgd4SC–/–co-cultures. SNX3 levels of expression were evaluated by western blot in both control and Fgd4SC–/– co-cultures. (C) Quantification of proteins levels of SNX3 observed by western blot in co-cultures. Data are expressed as mean ± SEM (n = 3 co-cultures) and normalized to the control values. Statistical analysis: unpaired Student’s t-test. (D) Western blot illustration of SNX3 expression profile, normalized to tubulin. (E and F) SNX3 levels are increased in sciatic nerves from knockout CMT4H animals (Fgd4–/–). SNX3 levels of expression were evaluated by western blot in sciatic nerves from 1-year-old Fgd4–/– and control mice. (E) Quantification of protein levels of SNX3 observed by western blot in 1-year-old Fgd4–/– and control’s sciatic nerves. Data are expressed as mean ± SEM (n = 3 controls and n = 5 Fgd4–/–). Statistical analysis: unpaired Student’s t-test. (F) Western blot illustration of SNX3 expression profile, normalized to GAPDH. (G) Knockdown of Snx3 reduces significantly the number of myelin abnormalities in Fgd4SC–/– co-cultures. Fgd4SC–/– co-cultures were infected at Day 1 after plating with Lv expressing either SH control, or SH-SNX3 (1 and 2). Myelination was then induced by ascorbic acid (50 µM) treatment over 12 days. Data are expressed as mean ± SEM (n = 3 co-cultures). Statistical analysis: one-way ANOVA, with Sidak post hoc test (multiple comparison to SH control). *P < 0.05, **P < 0.01, ***P < 0.001.
Figure 6
Figure 6
Downregulating NRG1-type III/ERBB2/3 signalling using niacin reduces myelination defects both in vitro and in vivo. (A and B) Niacin treatment reduces significantly myelin abnormalities in Fgd4SC–/– co-cultures. Fgd4SC–/– co-cultures were treated every 2 days with niacin (5mM) concomitantly to ascorbic acid addition (50 µM) over 12 days. (A) Quantification of the myelin abnormalities. Data are expressed as mean ± SEM (n = 3 co-cultures) and normalized to the control values. Statistical analysis: unpaired Student’s t-test. (B) Examples of MBP immunostaining in Fgd4SC–/– co-cultures treated (right) or non-treated (left) with niacin. Examples of myelin abnormalities are indicated by asterisks (*outfolding, **tomacula). (C and D) Niacin treatment leads to a downregulation of the NRG1-type III/ERBB2/3 signalling pathway. P-ERBB2 and ERBB2 expression levels were assessed by western blot in non-treated and niacin-treated Fgd4SC–/– co-cultures. (C) Quantification of P-ERBB2 and ERBB2 protein levels. Data are expressed as mean ± SEM (n = 3 co-cultures). Statistical analysis: unpaired Student’s t-test. (D) Western blot pictures illustrating the expression of the markers described in C. (E and F) Niacin treatment reduces the proportion of abnormal myelin fibres in vivo. One-month-old Fgd4SC–/– mice were daily injected with saline solution or niacin (60 mg/kg) over 8 weeks. Myelin abnormalities were quantified in the distal part of the sciatic nerves of the mice. (E) Quantification of the myelin abnormalities in sciatic nerves of treated and non-treated Fgd4SC–/– mice. Data are expressed as mean ± SEM (n = 4 saline-treated animals and 5 niacin-treated animals). Statistical analysis: unpaired Student’s t-test. *P < 0.05, **P < 0.01, ***P < 0.001 (F) Electron microscopy pictures illustrating myelination of sciatic nerves of saline-treated (left) and niacin-treated Fgd4SC–/– (right) mouse. Asterisks indicate outfoldings. Scale bar = 5 µm.

References

    1. Skre H. Genetic and clinical aspects of Charcot–Marie–Tooth’s disease. Clin Genet. 1974;6:98–118. - PubMed
    1. Harding AE, Thomas PK. The clinical features of hereditary motor and sensory neuropathy types I and II. Brain. 1980;103:259–280. - PubMed
    1. Pareyson D, Scaioli V, Laura M. Clinical and electrophysiological aspects of Charcot–Marie–Tooth disease. Historical article review. Neuromolecular Med. 2006;8(1–2):3–22. - PubMed
    1. Pipis M, Rossor AM, Laura M, Reilly MM. Next-generation sequencing in Charcot–Marie–Tooth disease: Opportunities and challenges. Nat Rev Neurol. 2019;15:644–656. - PubMed
    1. De Sandre-Giovannoli A, Delague V, Hamadouche T, et al. . Homozygosity mapping of autosomal recessive demyelinating Charcot–Marie–Tooth neuropathy (CMT4H) to a novel locus on chromosome 12p11.21-q13.11. J Med Genet. 2005;42:260–265. - PMC - PubMed

Publication types

Supplementary concepts