. 2023 Apr 19;146(4):1436-1452.
doi: 10.1093/brain/awac404.

Temporal lobe epilepsy with GAD antibodies: neurons killed by T cells not by complement membrane attack complex

Affiliations

Temporal lobe epilepsy with GAD antibodies: neurons killed by T cells not by complement membrane attack complex

Anna R Tröscher et al. Brain. .

Abstract

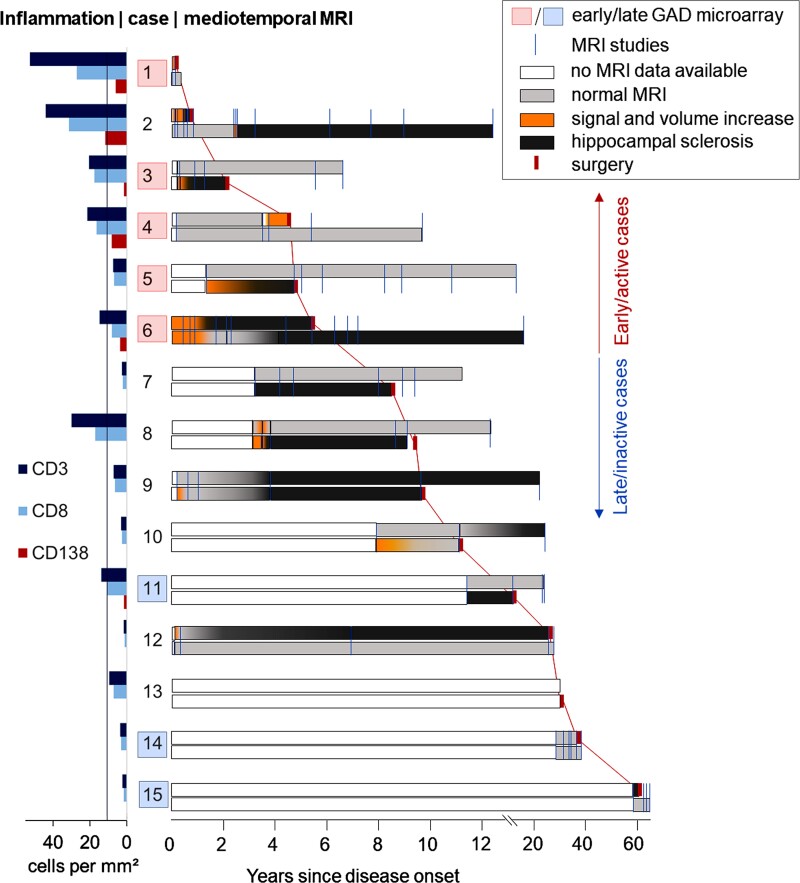
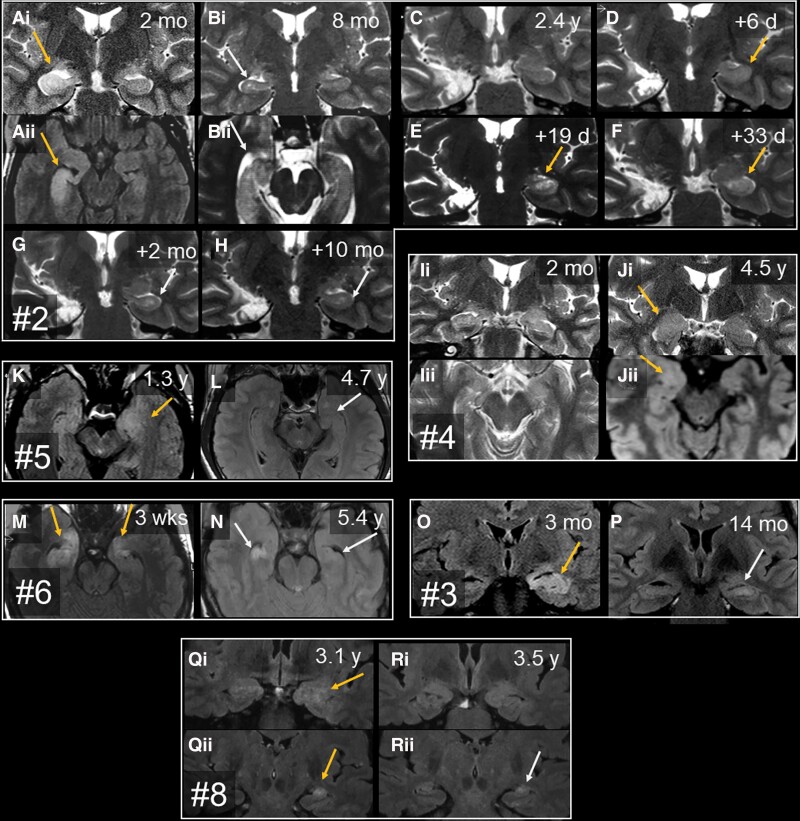
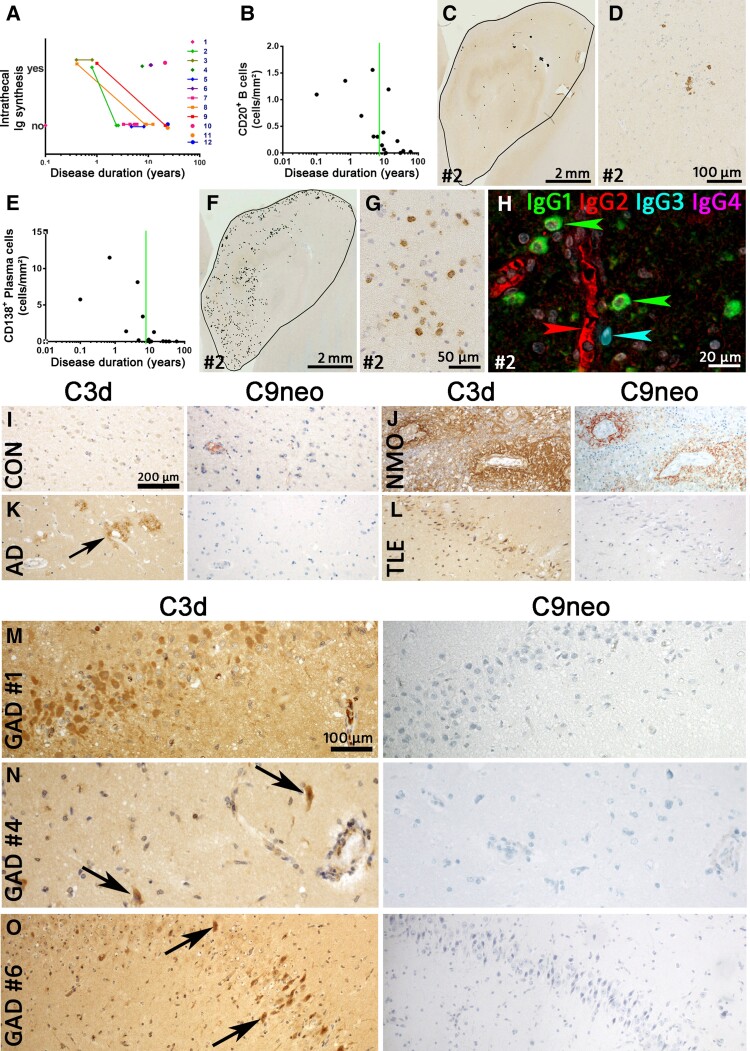
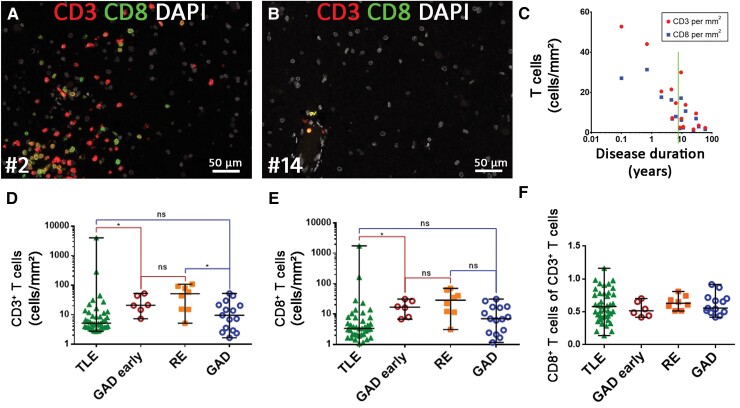
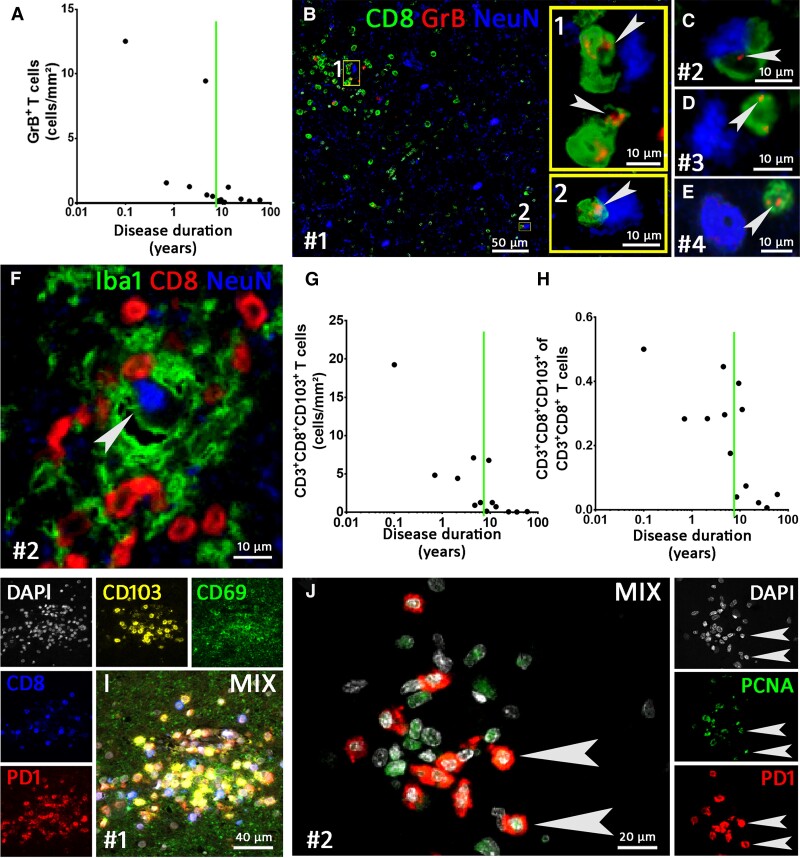
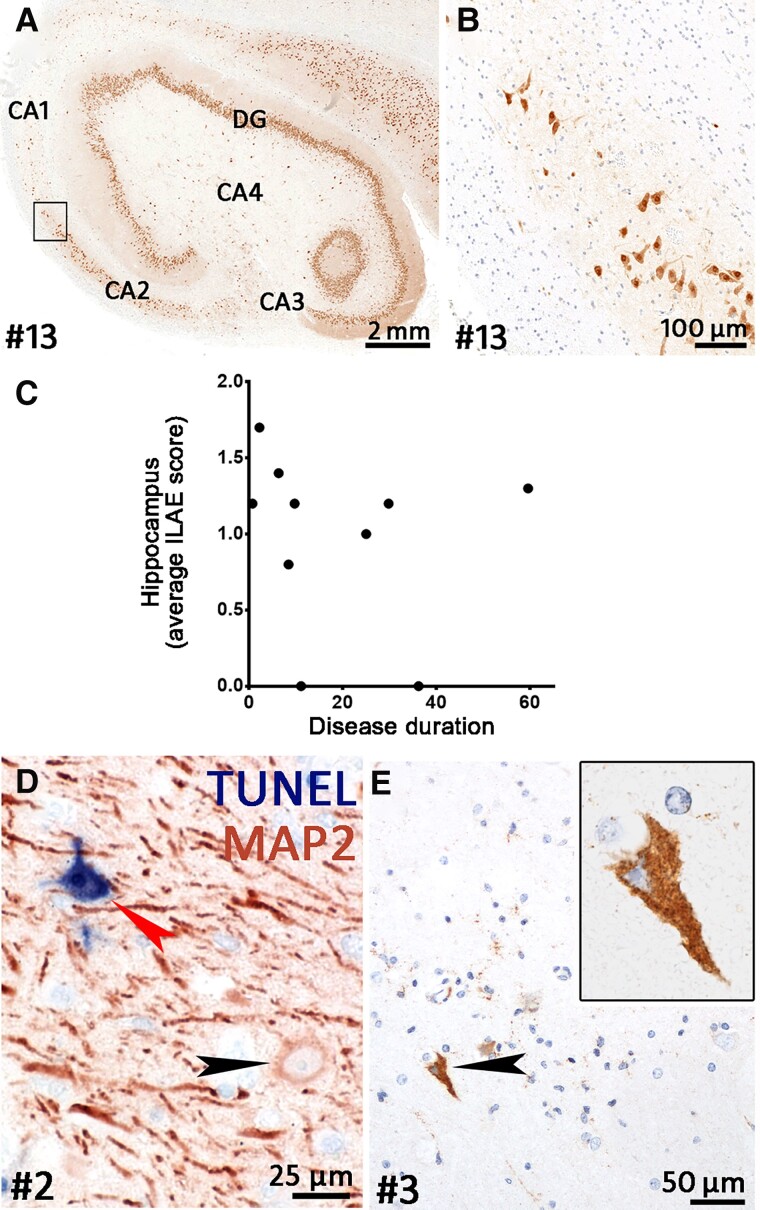
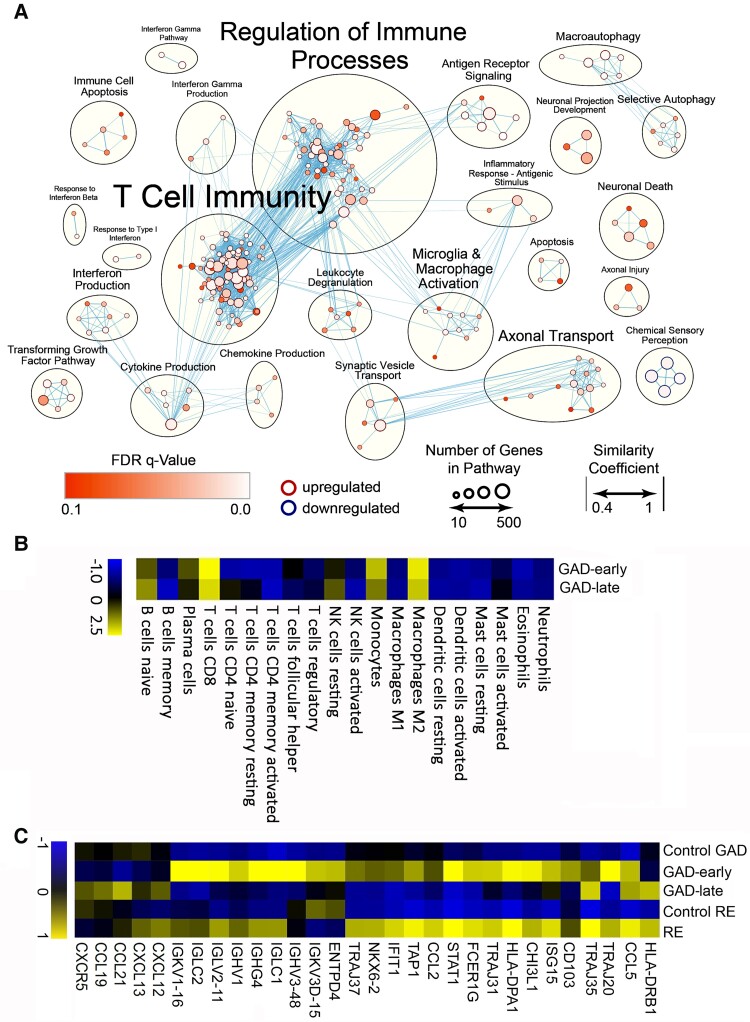
Temporal lobe epilepsy (TLE) is one of the syndromes linked to antibodies against glutamic acid decarboxylase (GAD). It has been questioned whether 'limbic encephalitis with GAD antibodies' is a meaningful diagnostic entity. The immunopathogenesis of GAD-TLE has remained enigmatic. Improvement of immunological treatability is an urgent clinical concern. We retrospectively assessed the clinical, MRI and CSF course as well as brain tissue of 15 adult patients with GAD-TLE who underwent temporal lobe surgery. Brain tissue was studied by means of immunohistochemistry, multiplex fluorescent microscopy and transcriptomic analysis for inflammatory mediators and neuronal degeneration. In 10 patients, there was a period of mediotemporal swelling and T2 signal increase; in nine cases this occurred within the first 6 years after symptom onset. This resulted in unilateral or bilateral hippocampal sclerosis; three cases developed hippocampal sclerosis within the first 2 years. All CSF studies done within the first year (n = 6) revealed intrathecal synthesis of immunoglobulin G. Temporal lobe surgeries were done after a median disease duration of 9 years (range 3 weeks to 60 years). Only two patients became seizure-free. Brain parenchyma collected during surgery in the first 6 years revealed high numbers of plasma cells but no signs of antibody-mediated tissue damage. Even more dense was the infiltration by CD8+ cytotoxic T lymphocytes (CTLs) that were seen to locally proliferate. Further, a portion of these cells revealed an antigen-specific resident memory T cell phenotype. Finally, CTLs with cytotoxic granzyme B+ granules were also seen in microglial nodules and attached to neurons, suggesting a CTL-mediated destruction of these cells. With longer disease duration, the density of all lymphocytes decreased. Whole transcriptome analysis in early/active cases (but not in late/inactive stages) revealed 'T cell immunity' and 'Regulation of immune processes' as the largest overrepresented clusters. To a lesser extent, pathways associated with B cells and neuronal degeneration also showed increased representation. Surgically treated patients with GAD-TLE go through an early active inflammatory, 'encephalitic' stage (≤6 years) with CTL-mediated, antigen-driven neuronal loss and antibody-producing plasma cells but without signs of complement-mediated cell death. Subsequently, patients enter an apparently immunologically inactive or low-active stage with ongoing seizures, probably caused by the structural damage to the temporal lobe. 'Limbic encephalitis' with GAD antibodies should be subsumed under GAD-TLE. The early tissue damage explains why immunotherapy does not usually lead to freedom from seizures.

Keywords: B cells; T cells; glutamic acid decarboxylase antibodies; histopathology; plasma cells; temporal lobe epilepsy.


Conflict of interest statement

R.S. has received speaker fees or honoraria for serving on the advisory board from Angelini, Arvelle, Bial, Desitin, Eisai, LivaNova, UCB Pharma, UnEEG and Zogenix, unrelated to this work. B.V. was supported by travel expenses and fees by Livanova, Medtronic, UCB, EISAI, JAZZ and Bioprojet.

Figures

Figure 1
Figure 1
Clinical course during GAD antibody-associated TLE. The clinical courses of the patients with GAD antibody-associated TLE arranged by disease duration (from short to long), with corresponding lymphocytic densities in mediotemporal brain samples. Each line represents one patient. The large numbers are the study IDs. To the right of the IDs are the MRI courses. Blue orthogonal lines: MRI studies. Upper rows: right mediotemporal lobes; lower rows: left mediotemporal lobes. White bars: no MRI data available; light grey bars: normal mediotemporal MRI; orange bars: signal and volume increase on T2/FLAIR images; dark grey bars: hippocampal atrophy with bright signal—that is, HS; red orthogonal marks, connected by red lines (for better visibility): time points of surgery. On the right, our grouping into ‘early/active inflammatory’ versus ‘late/inactive’ cases (see the ‘Materials and methods’ section) is indicated. The diagram to the left of the IDs gives the lymphocytic densities in the patients’ mediotemporal brain samples. The line at 11 cells/mm2 indicates the 75th percentile of hippocampal densities of CD3+ and CD8+ T cells in 41 patients with mediotemporal lobe epilepsy of different aetiologies from a previous study. The red boxes indicate GAD-early cases with upregulated immune pathways; the light blue boxes indicate GAD-late stages with lack of overexpressed pathways (see whole transcriptome analysis). Note the early presumable ‘encephalitic’ stages (orange) predating the development of HS and the correlation between shorter disease durations and higher densities of lymphocytic infiltrates.
Figure 2
Figure 2
Serial T2 or FLAIR MRI with time since disease manifestation. The images show the mediotemporal lobes with swelling and signal increase (orange arrows), HS (grey arrows) or normal findings. Each box contains images from one patient. Each letter marks one study time point; subscript numbers discriminate different orientations or planes. (AH) Patient 2. [A(i and ii)] Two months, right-sided hippocampal volume and signal increase, amygdala unaffected. [B(i and ii)] Six months later, there is right-sided HS and still no amygdalar lesion. (C) Almost 2 years after right-sided selective amygdalohippocampectomy and start of prednisolone therapy, the patient is seizure-free and still has intact left mediotemporal structures. Prednisolone was discontinued. (D) A few days later, the patient developed left temporal status epilepticus, and the left hippocampus showed increased volume and T2 signal. (F and G) Close-meshed follow-up MRIs over the following 2 months revealed how this resulted in left HS. (H) Final stage. (I and J) Patient 4. [I(i and ii)] Two months after epilepsy onset, mediotemporal structures were normal; 3.8 years after onset, there was swelling and signal increase of the right amygdala (not shown). [J(i and ii)] These changes were still present 9 months later, that is, 4.5 years after onset. In this case, the amygdala but not the hippocampus was affected; immediately after J, the right amygdala was resected because a glioma was suspected. (K and L) Patient 5. (K) The first available MRI at 1.3 years after onset displays the left amygdalar and hippocampal volume and signal increase. (L) On the next available MRI study, there is already hippocampal atrophy (better visible on the not shown coronal sections). (M and N) Patient 6. (M) Three weeks after onset, there is bilateral swelling and signal increase of both hippocampal heads and amygdalae. (N) Five years later, the MRI reveals bilateral HS. (O and P) Patient 3. (O) At 3 months, the left hippocampus (and amygdala, not shown) are swollen and hyperintense. (P) Fourteen months after onset, left-sided HS has evolved. (Q and R) Patient 8. [Q(i and ii)] On the earliest available images taken 3.1 years after onset, the left amygdala and hippocampus are swollen and hyperintense. [R(i and ii)] Four months later, the left amygdala has returned to normal [R(i)], while the hippocampus has become atrophic with still increased signal, that is, HS [R(ii)]. d = days; mo = months; wks = weeks; y = years.
Figure 3
Figure 3
B cells, plasma cells, intrathecal immunoglobulin synthesis and complement in GAD-TLE. (A) Intrathecal total immunoglobulin synthesis in individual patients with GAD-TLE over time. Please note that all individuals with serial data available went from ‘intrathecal production’ to ‘no intrathecal production’. (B) Quantification of CD20+ B cells. The graph shows the number of B cells from the various patients during the course of disease. The Spearman correlation test revealed a significant decrease with ongoing disease duration (P = 0.0026, r = −0.7310). (C) Low-magnification image of CD20 staining of the hippocampus of Patient 2. Every black dot indicates a single B cell. (D) Higher magnification of CD20 staining showing few CD20+ B cells in Patient 2 with GAD encephalitis. (E) Quantification of CD138+ plasma cells in the hippocampi of GAD encephalitis patients. The Spearman correlation test revealed a significant decrease with ongoing disease duration (P = 0.0001, r = −0.8365). (F) Presence of CD138+ plasma cells in hippocampus of a GAD-TLE brain (Patient 2). Every dot indicates a single CD138+ plasma cell. (G) Higher magnification of the hippocampus stained for CD138, showing multiple plasma cells in the parenchyma. (H) Multiplex staining for IgG (IgG1, IgG2, IgG3 and IgG4) subsets in Patient 2. Whereas the serum in blood vessels stains positive for IgG2 (red arrowhead), multiple IgG1+ plasma cells (green arrowheads) and a single IgG3+ plasma cell (cyan arrowhead) can be seen in the parenchyma. (IO) Staining for C3d and C9neo was performed in various controls and GAD-TLE patients. (I) C3d and C9neo are both negative in a normal control. (J) C3d and C9neo staining both can be seen around the blood vessels in the spinal cord of a neuromyelitis optica (NMO) patient. (K) In the cortex of an Alzheimer's disease brain, C3d staining can be seen in amyloid plaques (arrow). These plaques are negative for C9neo. (L) In a TLE patient, C3d upregulation can be seen in neurons of the dentate gyrus. These neurons are negative for C9neo. Magnifications in IL are identical and indicated by the bar in I. (MO) C3d and C9neo stainings in three GAD-TLE patients (M, Patient 1; N, Patient 4; and O, Patient 6). In all three patients C3d reactivity (left) can be seen in neurons, partially with shrunken cytoplasm (arrows) indicating neuronal damage. C9neo reactivity (right) in the same areas, however, is negative. Magnifications in MO are identical and indicated by the bar in M.
Figure 4
Figure 4
T cell infiltration in GAD-TLE compared to other cohorts. (A and B) Multiplex imaging for CD3+ and CD8+ T cell subsets in a case with short (A, Patient 2) versus long (B, Patient 14) disease duration. For the long disease duration, only a few T cells are seen in perivascular position. (C) Quantification of *CD3+ T cells (red) and **CD8+ T cells (blue) shows a decrease in these cells during GAD-TLE (Spearman correlation test: *P = 0.0023, r = −0.7393 **P = 0.0023, r = −0.7393). (D) CD3+ T cell infiltration and (E) CD8+ CTL infiltration is significantly higher in the GAD-early subgroup than in TLE of different genesis but not than RE. This does not apply for entire the GAD group (GAD). (F) There is no significant difference regarding CD8+/CD3+ ratio in the respective groups. Kruskal–Wallis test with Dunn’s post hoc correction was performed. Data are indicated as median with full range. *P < 0.05, ns = not significant. The TLE and RE cohorts were described earlier.
Figure 5
Figure 5
Multiplex imaging of T cell phenotypes in GAD-TLE. (A) Quantification of granzyme B+ (GrB) cells during the disease courses of GAD-TLE. Spearman correlations revealed a significant decrease with ongoing disease duration (P = 0.0031, r = −0.7692). (BE) Triple staining for CD8, GrB and NeuN. (B) Rectangles 1 and 2 indicate areas enlarged in yellow insets and show GrB+ C TLs attached to neurons. Arrowheads indicate GrB+ granules in the CTLs. (CE) GrB+ T cells (GrB indicated by arrowheads) attached to neurons in Patients 2–4. (F) Staining for microglia (Iba-1), cytotoxic T lymphocytes (CTLs, CD8) and neurons [neuronal nuclei (NeuN)] shows a microglial nodule intermingled with CTLs around a neuron. (G) Quantification of CD103+ T memory cells in GAD-TLE. During the disease course, the number of CD103+ T cells (as part of the CD8+/CD3+ T cells) declined (Spearman correlation test: P = 0.0011, r = −0.8187). (H) Quantification shows that the percentage of CD103+ cells of the CD8+/CD3+ T cells diminished with a longer disease duration (Spearman correlation test: P = 0.0147, r = −0.6703). (I) Multiplex imaging for markers of T resident memory cells (CD69, CD103) together with PD-1 for T-cell activation. (J) Multiplex imaging for proliferating cell nuclear antigen (PCNA) and CD8 shows proliferation of CD8+ CTLs (arrowheads). The number sign indicates the patient number.
Figure 6
Figure 6
Neurodegeneration in GAD-TLE. (A) Overview of a hippocampus stained for neuronal nuclei (NeuN). This hippocampus shows ILAE type I HS. Severe loss of neurons can be seen in CA1 and CA4 while CA2, CA3 and the dentate gyrus (DG) are relatively spared. (B) Higher magnification of boxed area in A showing the loss of neurons in the CA1 region at the transition to the CA2 region. (C) Average semi-quantitative score of neuronal loss in the hippocampus during the disease course of GAD-TLE. The graph shows that neuronal loss is present from early on and does not increase with longer disease duration. (D) Double staining for TUNEL (in blue) and MAP2 (red) showing a normal MAP2+ neuron (black arrowhead) and a degenerating neuron with TUNEL reactivity (red arrowhead). (E) Caspase-3 staining for apoptosis shows a single caspase-3+ neuron (enlarged in the inset). The surrounding neurons and glial cells show weak punctate caspase-3-reactivity.
Figure 7
Figure 7
GSEA in early cases of GAD-TLE. (A) GSEA of differentially expressed genes in GAD-early cases shows that especially adaptive T cell immunity pathways composed of ‘T cell immunity’ cluster with ‘T cell differentiation involved in immune response’ (NES = 2.22) or ‘T cell proliferation’ (NES = 2.0) and ‘Regulation of immune processes’ with ‘Regulation of T cell mediated cytotoxicity’ (NES = 1.96) are strongly upregulated. Besides these changes in adaptive immunity pathways, upregulation of innate pro-inflammatory cytokine and chemokine pathways, summarized in ‘Cytokine production’ and ‘Chemokine production’, respectively, involve interleukin (IL)-8 (‘Production of IL-8’, NES = 1.93), IL-6 (‘Regulation of IL-6 production’, NES = 1.86) and tumour necrosis factor (TNF)-superfamily (‘Regulation of TNF superfamily cytokine production’, NES = 2.07). In addition, upregulation of innate immune activation was found in the cluster ‘Microglia and macrophage activation’, where pathways such as ‘Microglial cell activation’ (NES = 2.03) and ‘Neuroinflammatory response’ (NES = 1.96) are clustered. Other clusters were linked to neuronal degeneration and loss. These included the clusters ‘neuronal death’, ‘axonal injury’ and ‘apoptosis’, which comprise pathways such as ‘Neuron death’ (NES = 1.74), ‘Response to Axon Injury’ (NES = 1.70) and ‘Disassembly of cellular organelle involved in apoptosis’ (NES = 1.94). (B) Deconvolution of 20 different immune cells. In GAD-early, CD8+ T cells, macrophages of the M2 type and monocytes are overrepresented mostly. Slightly overrepresented are naïve B cells and plasma cells. In GAD-late cases overrepresentation of these cell types is less prominent. (C) GSEA of differentially expressed genes in the GAD-early and GAD-late groups compared with the control group (Control GAD) and compared with the previously described RE and control (Control RE) groups. Similarly to RE, the GAD-early group shows similar upregulation of T cell-associated genes depicted on the right side of the heat map. Differently from RE, the GAD-early group shows enhanced presentation of immunoglobulin-associated genes as seen on the left side of the heat map.

Comment in

References

    1. Kaufman DL, Houser CR, Tobin AJ. Two forms of the gamma-aminobutyric acid synthetic enzyme glutamate decarboxylase have distinct intraneuronal distributions and cofactor interactions. J Neurochem. 1991;56:720–723. - PMC - PubMed
    1. Christgau S, Aanstoot HJ, Schierbeck H, et al. . Membrane anchoring of the autoantigen GAD65 to microvesicles in pancreatic beta-cells by palmitoylation in the NH2-terminal domain. J Cell Biol. 1992;118:309–320. - PMC - PubMed
    1. Panina-Bordignon P, Lang R, van Endert PM, et al. . Cytotoxic T cells specific for glutamic acid decarboxylase in autoimmune diabetes. J Exp Med. 1995;181:1923–1927. - PMC - PubMed
    1. Viglietta V, Kent SC, Orban T, Hafler DA. GAD65-reactive T cells are activated in patients with autoimmune type 1a diabetes. J Clin Invest. 2002;109:895–903. - PMC - PubMed
    1. Budhram A, Sechi E, Flanagan EP, et al. . Clinical spectrum of high-titre GAD65 antibodies. J Neurol Neurosurg Psychiatry. 2021;92:645–654. - PMC - PubMed

Publication types

MeSH terms

Substances