

Hierarchical stratification of the factors related to exertional dyspnoea and exercise intolerance in male COPD patients
- PMID: 36314466
- PMCID: PMC9629069
- DOI: 10.1080/07853890.2022.2135018
Hierarchical stratification of the factors related to exertional dyspnoea and exercise intolerance in male COPD patients
Abstract
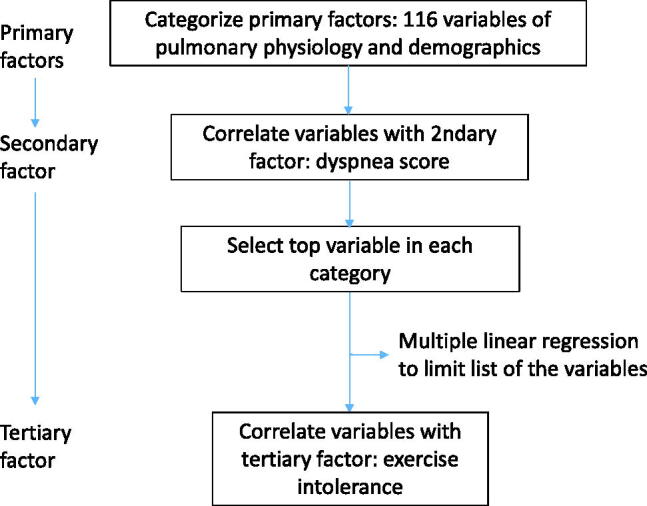
Background: The order and extent of interactions across the factors affecting exertional dyspnoea (ED) and exercise intolerance (EI) in patients with chronic obstructive pulmonary disease (COPD) are not clear. We hypothesized that lung and non-lung variables were the primary variables, ED was the secondary variable and EI was the tertiary variable.
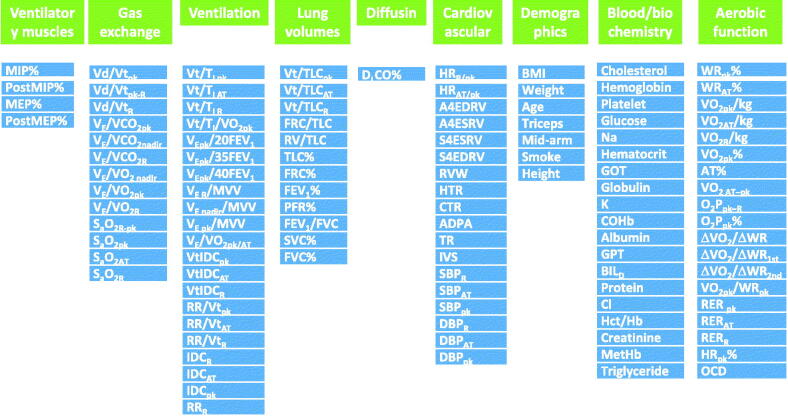
Methods: Data on demographics, blood tests, cardiac imaging, lung function tests and invasive dead space fractions (VD/VT) during incremental exercise test of 46 male COPD subjects were obtained. These variables were categorized by factor analysis and pair-wise correlation analysis was conducted. The best factor of each category was selected and then multivariate regression was conducted.
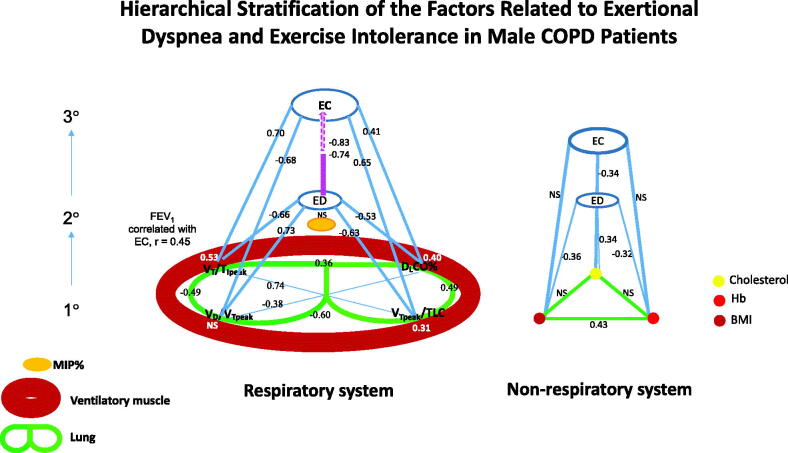
Results: Peak tidal inspiratory flow (VT/TIpeak), VD/VTpeak and tidal lung expansion capability, and resting diffusing capacity of the lungs (DLCO)% predicted were the primary pulmonary factors most related to ED, whereas body mass index (BMI), haemoglobin and cholesterol levels were the primary non-pulmonary factors. In multivariate regression analysis, VT/TIpeak, VD/VTpeak and DLCO% were the primary factors most related to ED (r2 = 0.69); ED was most related to EI (r = -0.74 to -0.83).
Conclusion: Using hierarchical stratification and statistical methods may improve understanding of the pathophysiology of ED and EI in patients with COPD. KEY MESSAGESThe pathophysiology of exertional dyspnoea (ED) and exercise intolerance (EI) in chronic obstructive pulmonary disease (COPD) is complex. The order and extent of interactions across factors are not clear. In multivariate regression analysis, we found that tidal inspiratory flow, dead space fraction and resting diffusing capacity of the lungs % but not the non-pulmonary factors affected ED.Using correlation coefficients, we further found that ED was the secondary variable and EI was the tertiary variable.Hierarchical stratification of the important factors associated with ED and EI in patients with COPD clarifies their relationships and could be incorporated into management programmes and outcome studies for these patients.
Keywords: Exertional dyspnoea; air trapping; cholesterol; diffusing capacity; exercise capacity; incremental exercise test.
Conflict of interest statement
No potential conflict of interest was reported by the author(s).
Figures
Similar articles
-
Tidal volume expandability affected by flow, dynamic hyperinflation, and quasi-fixed inspiratory time in patients with COPD and healthy individuals.Chron Respir Dis. 2022 Jan-Dec;19:14799731221133390. doi: 10.1177/14799731221133390. Chron Respir Dis. 2022. PMID: 36210794 Free PMC article.
-
Low resting diffusion capacity, dyspnea, and exercise intolerance in chronic obstructive pulmonary disease.J Appl Physiol (1985). 2019 Oct 1;127(4):1107-1116. doi: 10.1152/japplphysiol.00341.2019. Epub 2019 Aug 1. J Appl Physiol (1985). 2019. PMID: 31369329
-
Prediction and types of dead-space fraction during exercise in male chronic obstructive pulmonary disease patients.Medicine (Baltimore). 2022 Feb 11;101(6):e28800. doi: 10.1097/MD.0000000000028800. Medicine (Baltimore). 2022. PMID: 35147114 Free PMC article.
-
Beyond Spirometry: Linking Wasted Ventilation to Exertional Dyspnea in the Initial Stages of COPD.COPD. 2024 Dec;21(1):2301549. doi: 10.1080/15412555.2023.2301549. Epub 2024 Feb 13. COPD. 2024. PMID: 38348843 Review.
-
Dyspnea and activity limitation in COPD: mechanical factors.COPD. 2007 Sep;4(3):225-36. doi: 10.1080/15412550701480455. COPD. 2007. PMID: 17729066 Review.
Cited by
-
Tidal volume expandability and ventilatory efficiency as predictors of mortality in Taiwanese male patients with chronic obstructive pulmonary disease: A 10-year follow-up study - Is V̇O2peak or FEV1% the gold standard?Chron Respir Dis. 2023 Jan-Dec;20:14799731231220675. doi: 10.1177/14799731231220675. Chron Respir Dis. 2023. PMID: 38086393 Free PMC article.
-
The contribution of estimated dead space fraction to mortality prediction in patients with chronic obstructive pulmonary disease-a new proposal.PeerJ. 2024 Mar 27;12:e17081. doi: 10.7717/peerj.17081. eCollection 2024. PeerJ. 2024. PMID: 38560478 Free PMC article.
References
-
- Hurst JR, Wedzicha JA.. The biology of a chronic obstructive pulmonary disease exacerbation. Clin Chest Med. 2007;28(3):525–536. - PubMed
-
- Spruit MA, Pitta F, McAuley E, et al. . Pulmonary rehabilitation and physical activity in patients with chronic obstructive pulmonary disease. Am J Respir Crit Care Med. 2015;192(8):924–933. - PubMed
-
- Mahler DA, Harver A.. A factor analysis of dyspnea ratings, respiratory muscle strength, and lung function in patients with chronic obstructive pulmonary disease. Am Rev Respir Dis. 1992;145(2 Pt 1):467–470. - PubMed
Publication types
MeSH terms
LinkOut - more resources
Full Text Sources
Other Literature Sources
Medical