. 2022 Oct 31:11:e81943.
doi: 10.7554/eLife.81943.

Constitutively active STING causes neuroinflammation and degeneration of dopaminergic neurons in mice

Affiliations

Constitutively active STING causes neuroinflammation and degeneration of dopaminergic neurons in mice

Eva M Szego et al. Elife. .

Abstract

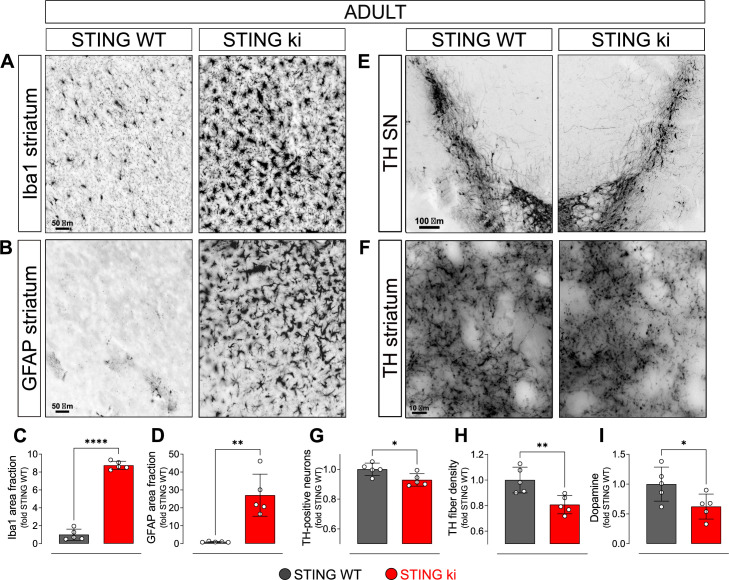
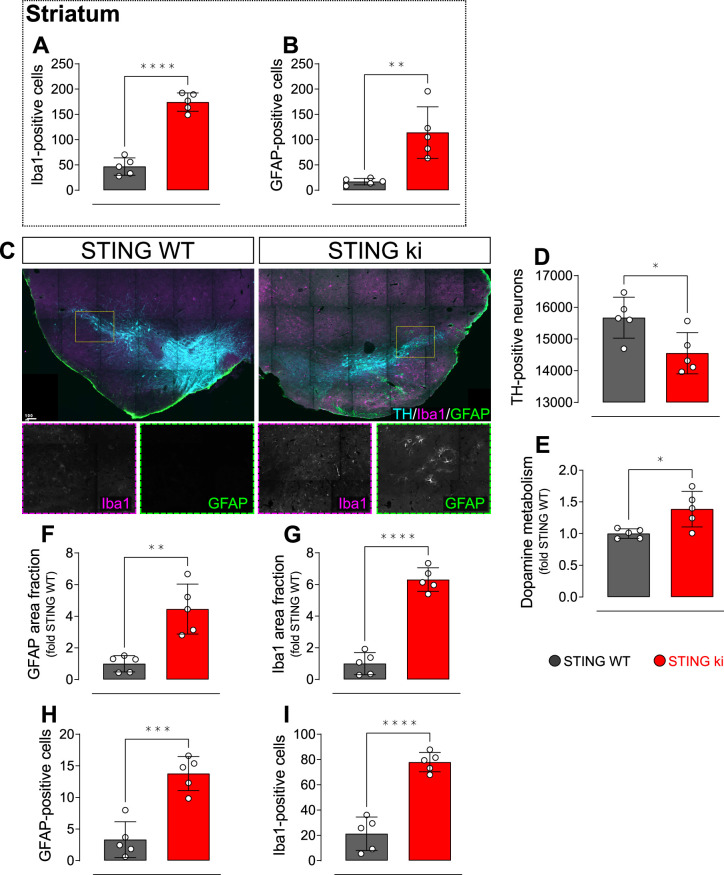
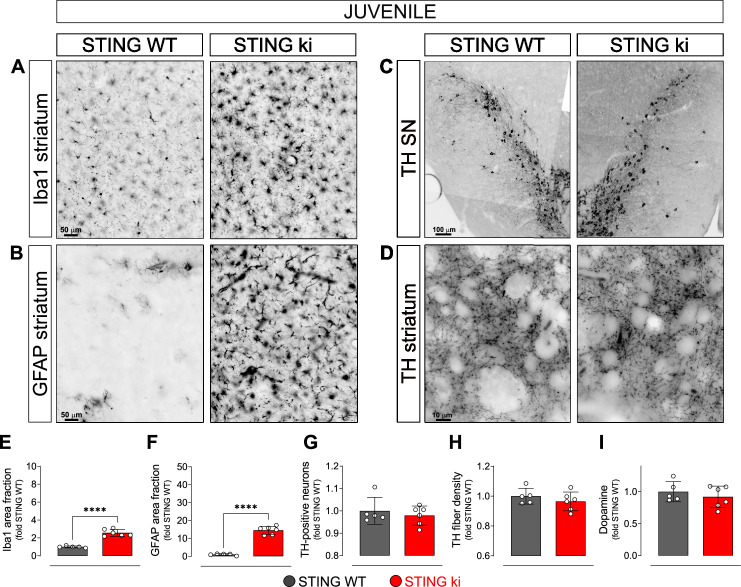
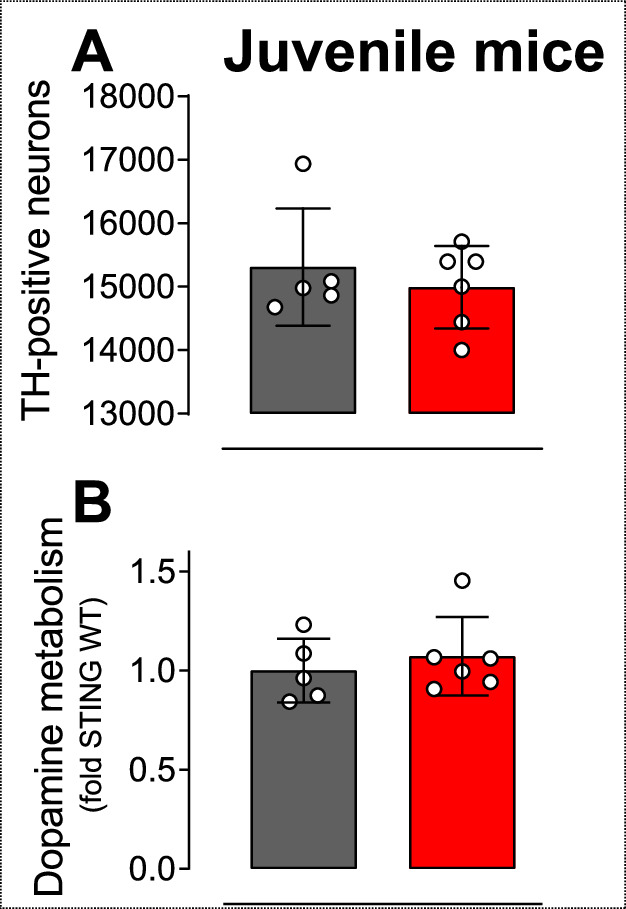
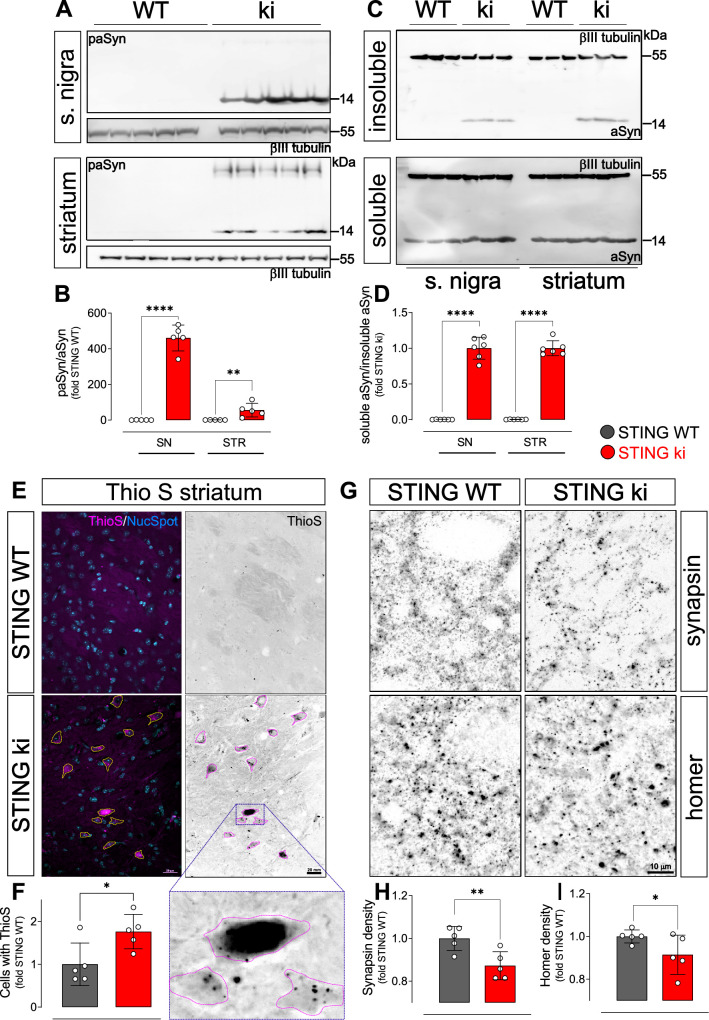
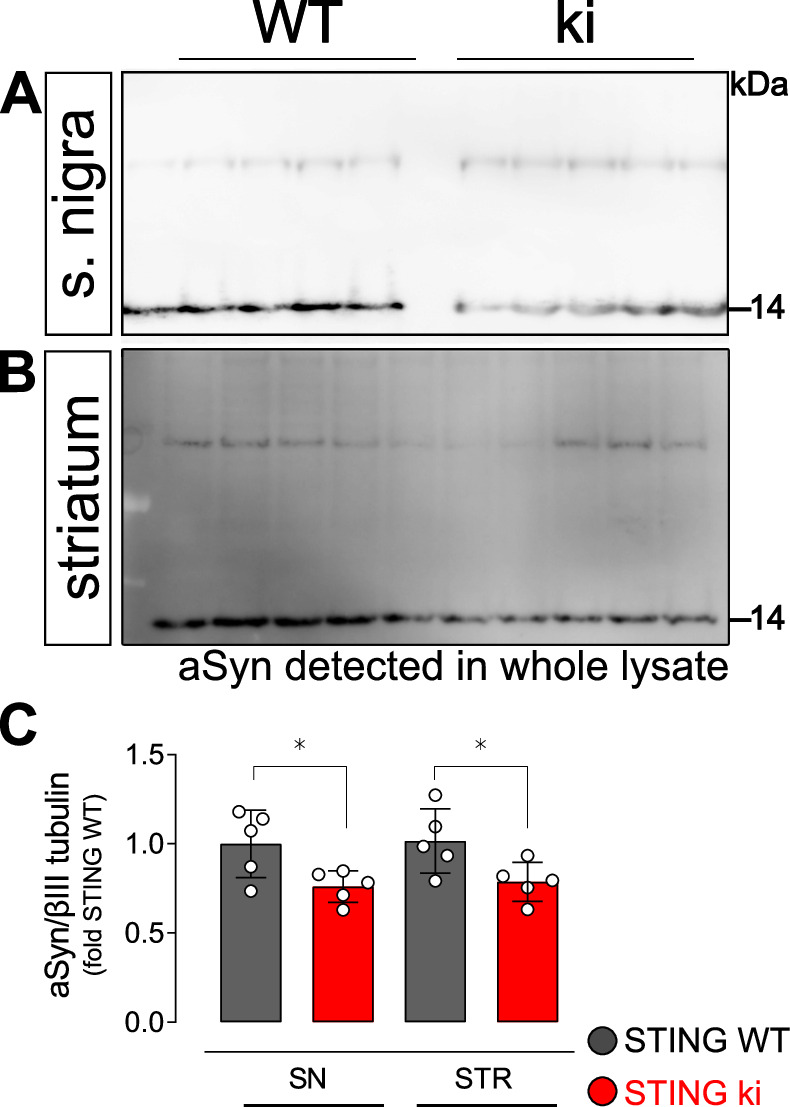
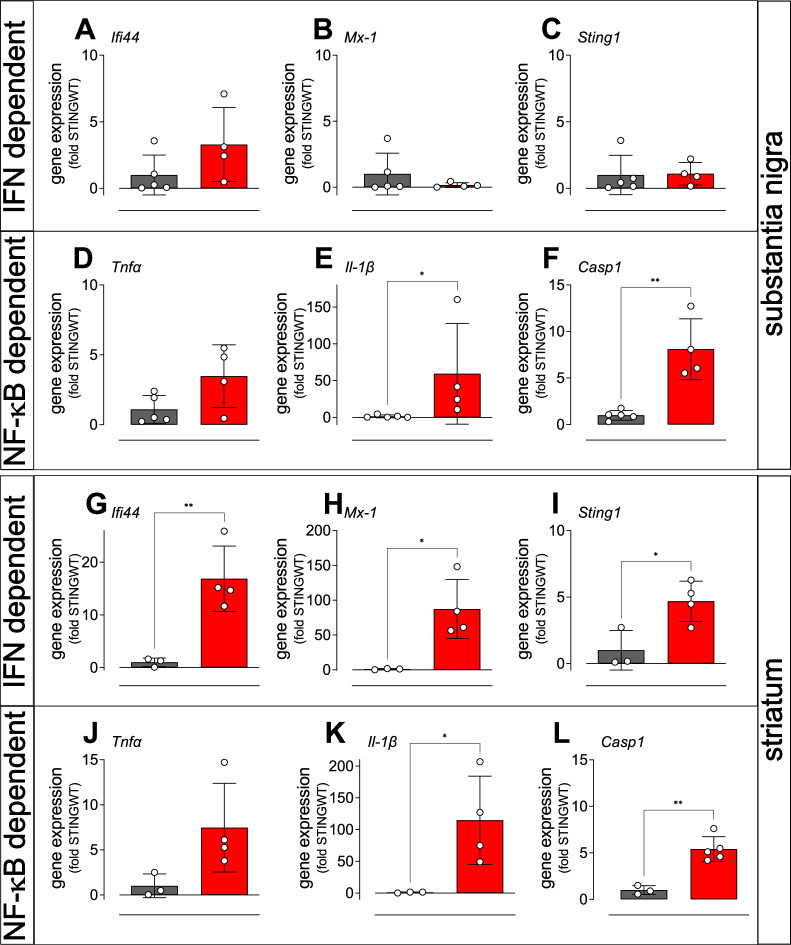
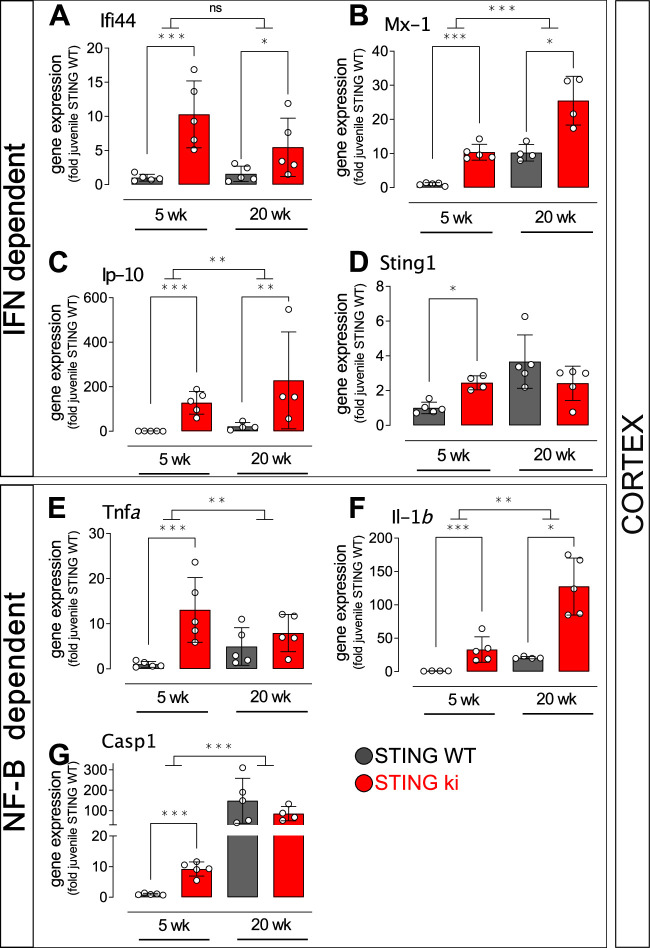
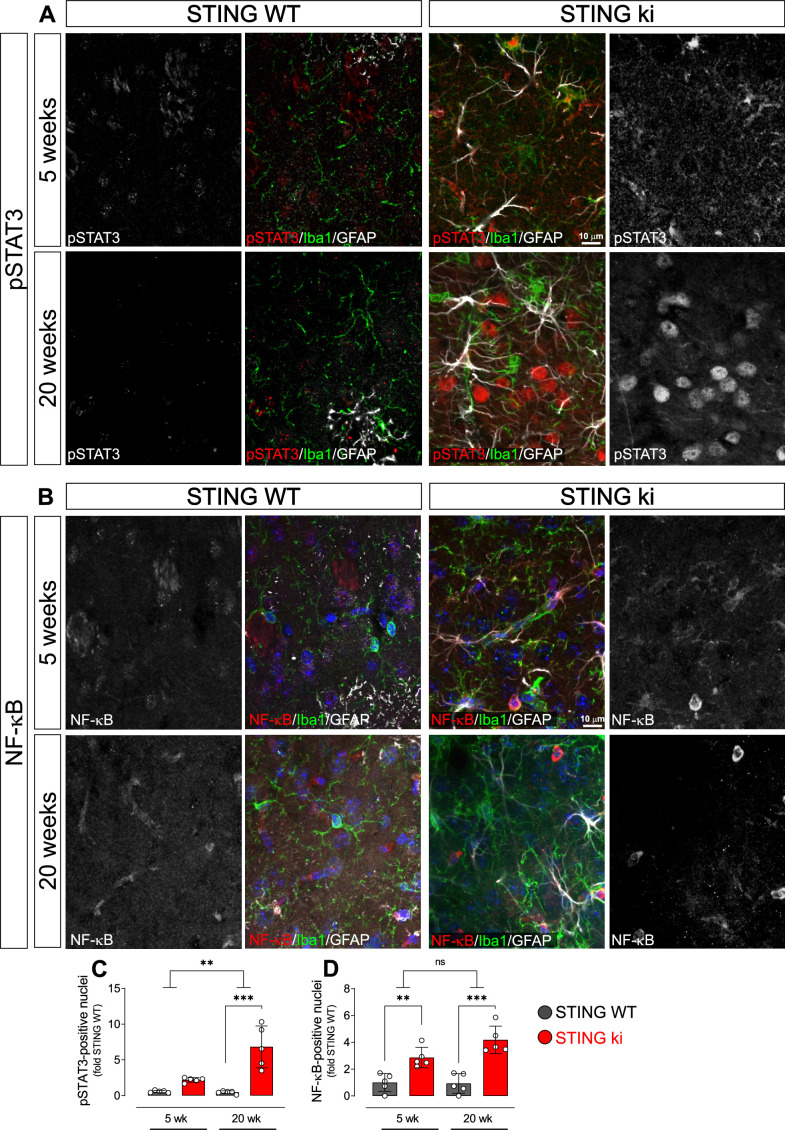
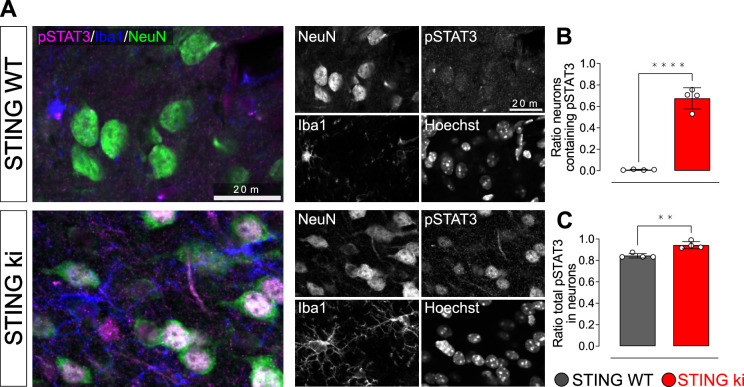
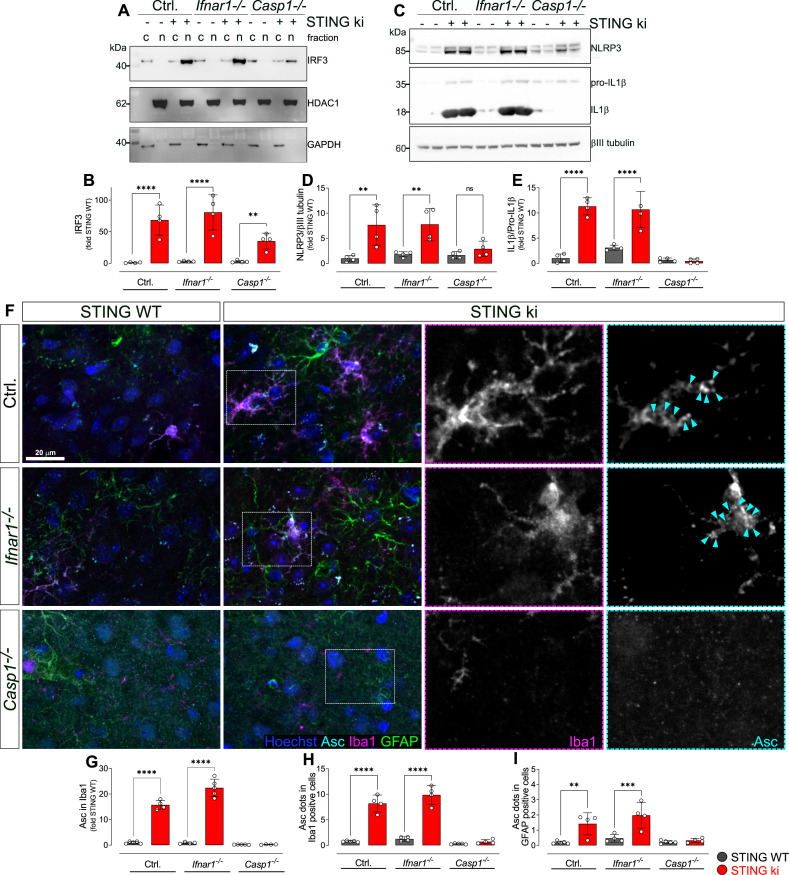
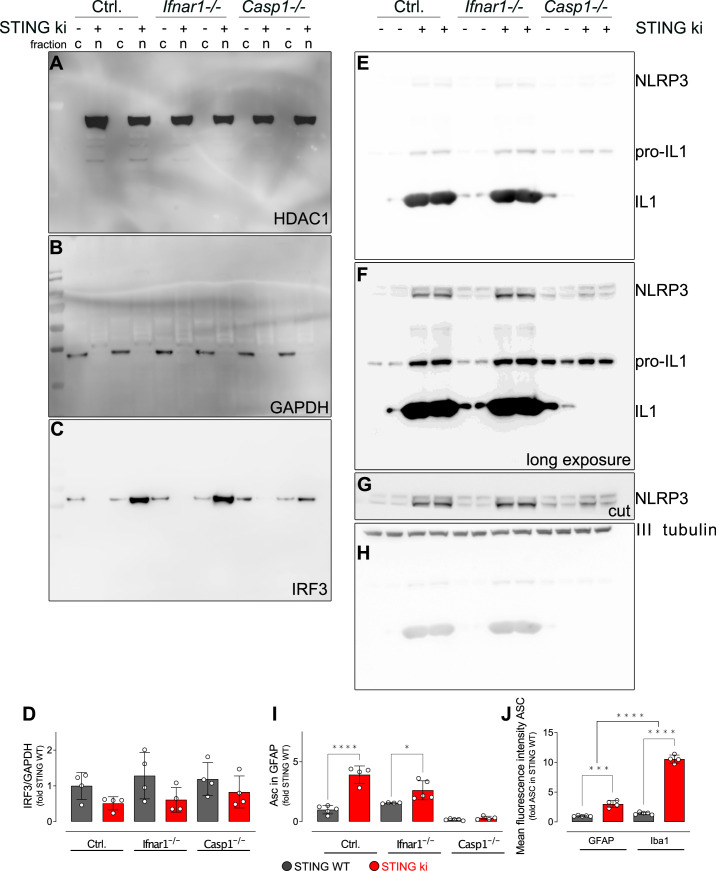
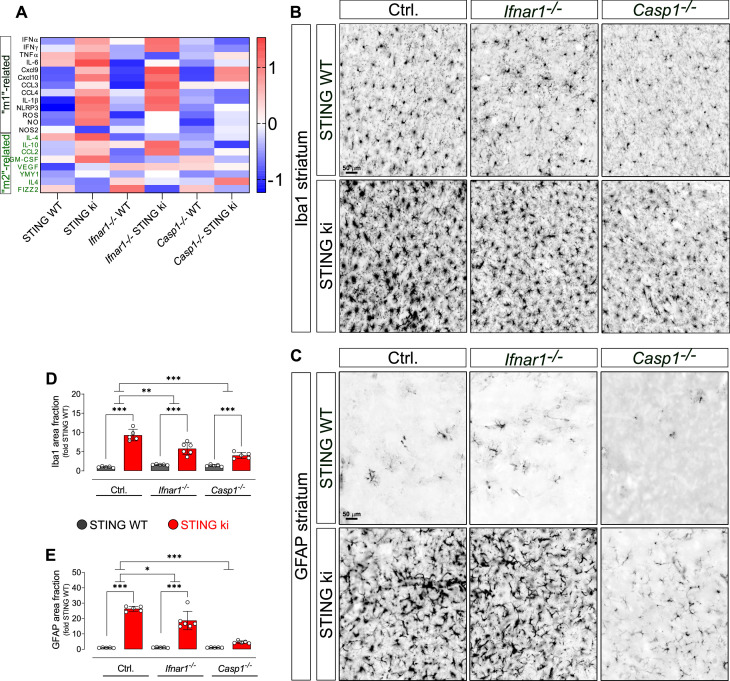
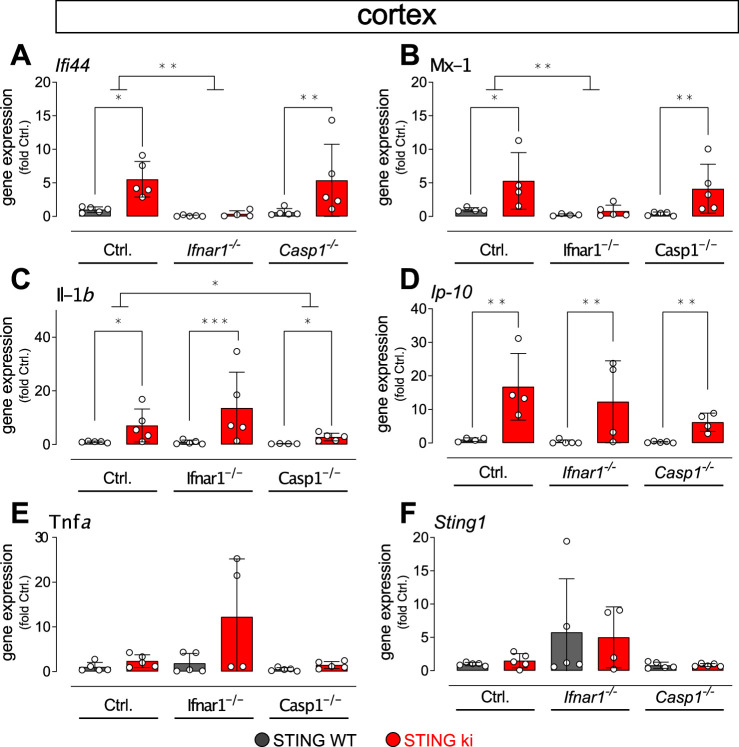
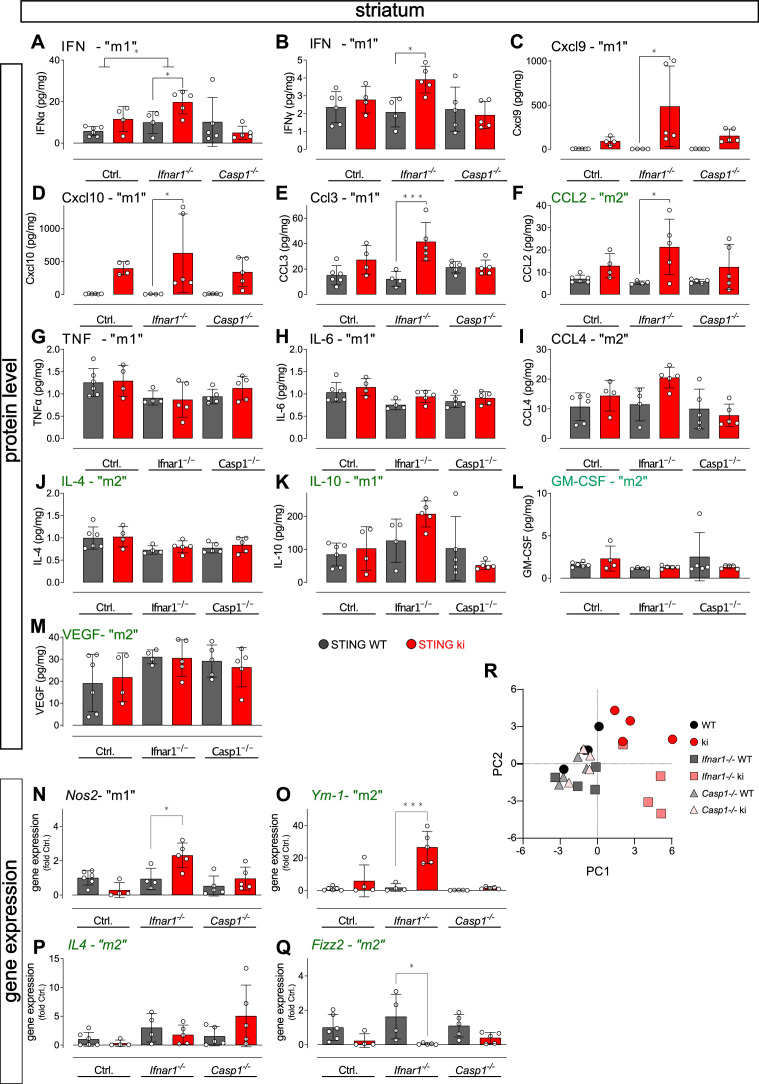
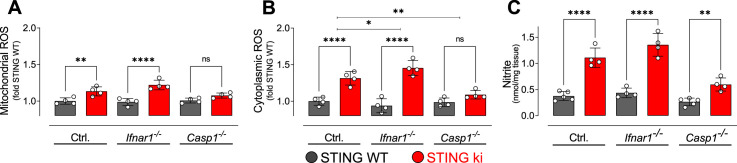
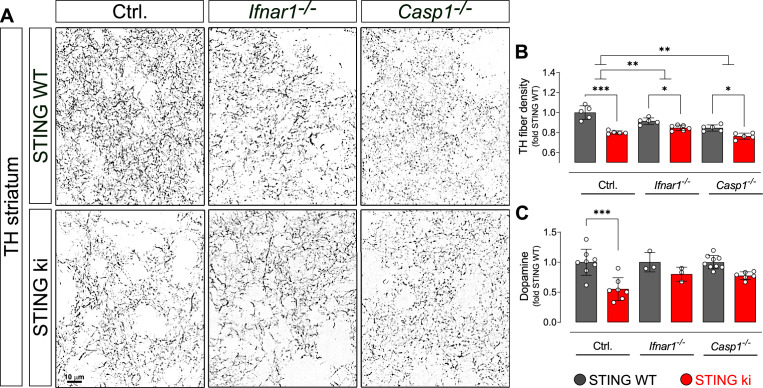
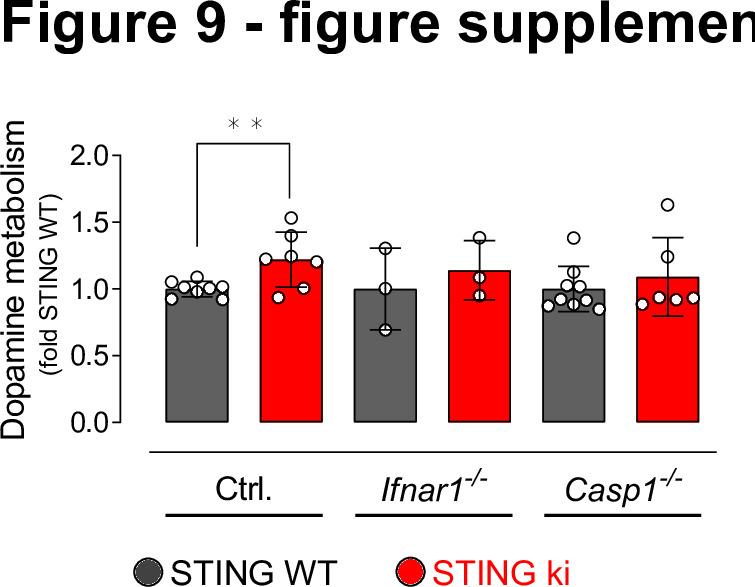
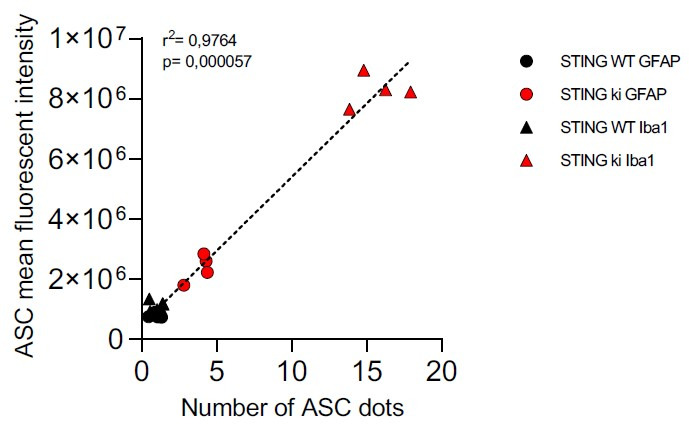
Stimulator of interferon genes (STING) is activated after detection of cytoplasmic dsDNA by cGAS (cyclic GMP-AMP synthase) as part of the innate immunity defence against viral pathogens. STING binds TANK-binding kinase 1 (TBK1). TBK1 mutations are associated with familial amyotrophic lateral sclerosis, and the STING pathway has been implicated in the pathogenesis of further neurodegenerative diseases. To test whether STING activation is sufficient to induce neurodegeneration, we analysed a mouse model that expresses the constitutively active STING variant N153S. In this model, we focused on dopaminergic neurons, which are particularly sensitive to stress and represent a circumscribed population that can be precisely quantified. In adult mice expressing N153S STING, the number of dopaminergic neurons was smaller than in controls, as was the density of dopaminergic axon terminals and the concentration of dopamine in the striatum. We also observed alpha-synuclein pathology and a lower density of synaptic puncta. Neuroinflammation was quantified by staining astroglia and microglia, by measuring mRNAs, proteins and nuclear translocation of transcription factors. These neuroinflammatory markers were already elevated in juvenile mice although at this age the number of dopaminergic neurons was still unaffected, thus preceding the degeneration of dopaminergic neurons. More neuroinflammatory markers were blunted in mice deficient for inflammasomes than in mice deficient for signalling by type I interferons. Neurodegeneration, however, was blunted in both mice. Collectively, these findings demonstrate that chronic activation of the STING pathway is sufficient to cause degeneration of dopaminergic neurons. Targeting the STING pathway could therefore be beneficial in Parkinson's disease and further neurodegenerative diseases.

Keywords: inflammasome; innate immunity; mouse; neurodegeneration; neuroinflammation; neuroscience; parkinson; synuclein.

Plain language summary

Neurodegenerative conditions such as Alzheimer’s and Parkinson’s diseases are characterised by neurons getting damaged and dying. Many factors contribute to this process, but few can be effectively controlled by therapies. Interestingly, previous studies have highlighted that inflammation, a process normally triggered by foreign agents or biological damage, is often associated with neurons degenerating. However, it is unclear whether these responses are the cause or the consequence of brain cell damage. In injured neurons, the genetic information normally contained inside a dedicated cellular compartment can start to leak into the surrounding parts of the cell. This damage triggers an inflammatory response through the STING pathway, a mechanism previously implicated in the onset of Parkinson’s disease. In these patients, the neurons that produce the signalling molecule dopamine start to die, leading to difficulty with movement. Whether STING can directly cause this neuronal loss remains unknown. To answer this question, Szegö, Malz et al. genetically engineered mice in which the STING pathway is permanently activated. The animals had fewer dopamine-producing neurons and accumulated harmful clumps of proteins; both these biological features are characteristic signs of Parkinson’s disease. Crucially, signs of inflammation were present before neurons started to show damage, suggesting that inflammatory responses could cause neurodegeneration. Further experiments revealed that STING triggers several molecular cascades; blocking one only of these pathways did not keep the neurons healthy. Neurodegenerative diseases are a growing concern around the world. The results from Szegö, Malz et al. suggest that preventing prolonged inflammatory may reduce the risk of neurodegeneration. If further research confirms these findings, in particular in humans, well-known treatments against inflammation could potentially become relevant to fight these conditions.


Conflict of interest statement

ES, LM, NB, AR, BF, HL No competing interests declared

Figures

Figure 1.
Figure 1.. Constitutive STING activation induces neuroinflammation and neurodegeneration in adult mice.
(A) Representative images of striatal sections from STING WT and STING ki mice stained for the microglia marker Iba1. Scale bar: 50 μm. (B) Representative images of striatal sections stained for the astroglia marker GFAP. Scale bar: 50 μm. (C) Representative images of midbrain sections containing the substantia nigra (SN) from STING WT and STING ki mice (stitched from two microscopy fields) stained for tyrosine hydroxylase (TH). Scale bar: 100 μm. (D) Representative images of striatal sections stained for TH from STING WT and STING ki mice. Scale bar: 10 μm. (E) Area fraction positive for Iba1, normalized to the mean of STING WT mice. Markers represent individual animals (black: STING WT animals, red: STING ki animals). Lines represent mean ± SD. Comparison by t-test (***: p=0.0007, n=5). Graph showing the counted numbers of Iba1-positive neurons is on Figure 1—figure supplement 1A. (F) Area fraction positive for GFAP, normalized to the mean of STING WT mice (**: p=0.0011; t-test, n=5). Graph showing the counted numbers of GFAP-positive neurons is on Figure 1—figure supplement 1B. (G) Number of TH-positive neurons (*: p=0.0257; t-test, n=5). Graph showing the counted numbers of dopaminergic neurons is on Figure 1—figure supplement 1D. (H) Area fraction positive for TH (**: p=0.0081; t-test, n=5). (I) Concentration of dopamine (*: p=0.0448; t-test, n=5) in striatal lysates from STING WT and STING ki animals, normalized to the mean concentration in STING WT. Graph showing quantification of the dopamine metabolites is in Figure 1—figure supplement 1E.
Figure 1—figure supplement 1.
Figure 1—figure supplement 1.. Neuroinflammation and neurodegeneration in adult mice.
(A) Number of Iba1-positive microglia in the striatum of adult mice (P=0,0000, t-test). (B) Number of GFAP-positive astroglia in the striatum of adult mice (p=0.0029, t-test). (C) Representative images on the ventral midbrain containing the substantia nigra of STING WT and STING ki mice, stained for TH (cyan), Iba1 (magenta) and GFAP (green). Scale bar: 100 µm. Insets show grayscale signal of Iba1 or GFAP staining. (D) Number of TH-positive neurons in the substantia nigra of adult mice (p=0.0257; t-test). (E) Dopamine metabolism (concentration of dopamine metabolites DOPAC +HVA) / dopamine in adult mice (p=0.0179; t-test). (F) Area fraction positive for GFAP signal in the substantia nigra as relative to the mean of STING WT (**: p=0.0078; t-test). (G) Area fraction positive for Iba1 signal in the substantia nigra as relative to the mean of STING WT (**: p=0.0078; t-test). (H) Number of counted GFAP-positive cells in the substantia nigra of adult mice (p=0.0003, t-test). (I) Number of counted Iba1-positive cells in the substantia nigra of adult mice (p=0.0000, t-test). n=5 for all graphs.
Figure 2.
Figure 2.. Neuroinflammation without neurodegeneration in juvenile mice with constitutive STING activation.
(A) Representative images of striatal sections stained for the microglia marker Iba1 from 5-week-old STING WT and STING ki mice. Scale bar: 50 μm (B) Representative images of striatal sections stained for the astroglia marker GFAP from 5-week-old STING WT and STING ki mice. Scale bar: 50 μm (C) Representative images of midbrain sections containing the substantia nigra (SN, stitched from two microscopy fields) stained for tyrosine hydroxylase (TH) from 5-week-old STING WT and STING ki mice. Scale bar: 100 μm (D) Representative images of striatal sections stained for TH from 5-week-old STING WT and STING ki mice. Scale bar: 10 μm. (E) Area fraction positive for Iba1, normalized to the mean of STING WT (***: p=0,0009; t-test, n=5–6). (F) Area fraction positive for GFAP, normalized to the mean of STING WT brains (***: p=0.0007; t-test, n=5–6). (G) Number of TH-positive neurons (mean ± SD; t-test). Graph showing the counted numbers of dopaminergic neurons is on Figure 2—figure supplement 1A. (H) Area fraction positive for TH (mean ± SD, t-test, n=5–6). (I) Dopamine concentration in striatal lysates from 5-week-old STING WT and STING ki mice, measured by HPLC and normalized to the mean of STING WT (mean ± SD, t-test, n=5–6). Dopamine metabolites are in Figure 2—figure supplement 1B.
Figure 2—figure supplement 1.
Figure 2—figure supplement 1.. Neuroinflammation without neurodegeneration in juvenile mice.
(A) Number of TH-positive neurons in the substantia nigra of juvenile mice (p=0.5188; t-test). (B) Dopamine metabolism in juvenile mice (p=0.9545; t-test). n=5–6.
Figure 3.
Figure 3.. Constitutive STING activation induces alpha-synuclein pathology and synapse loss in adult mice.
(A) Representative western blot images showing phosphorylated alpha-synuclein (S129; paSyn) and the loading control βIII-tubulin detected from the substantia nigra (upper panel) and striatum (lower panel). Total levels of aSyn detected from the same membranes are shown on Figure 3—figure supplement 1A, B. (B) Ratio of paSyn and total aSyn signals, expressed as relative to the mean of STING WT (substantia nigra (SN): p=0.000065; striatum: p=0.019; t-test, n=5). (C) Representative western blot images showing aSyn and βIII-tubulin detected from the Triton X-100 insoluble (upper panel) and soluble (lower panel) fractions prepared from the substantia nigra or from the striatum. (D) Ratio of aSyn signals detected in the Triton X-100 soluble and insoluble fractions, expressed as relative to the mean of STING ki (substantia nigra (SN): p=0.00001; striatum: p<0.00001; t-test, n=6). (E) Representative images of striatal sections from 20-week-old STING WT and STING ki mice stained with Thioflavin S (magenta) and nuclear sdye (blue) on the composite images, and ThioS BW. Scale bar: 20 μm. (F) Number of cells with inclusions positive for Thioflavin S (ThioS) per mm2 (*: p=0.0141; t-test, n=5). (G) Representative images of striatal sections from 20-week-old STING WT and STING ki mice stained for the presynaptic marker synapsin (upper panel) or for the post-synaptic marker homer (lower panel). Scale bar: 10 μm. (H–I) Area fraction positive for synapsin (H, p=0.0053) or homer (I, p=0.0408) (mean ± SD; t-test, n=5).
Figure 3—figure supplement 1.
Figure 3—figure supplement 1.. Uncropped membranes showing α-Synuclein signal detected from whole cell lysates of striatum and substantia nigra.
(A) Representative Western blot membrane showing aSyn signal in lysates prepared from the substantia nigra of STING WT and STING ki mice. (B) Representative Western blot membrane showing aSyn signal in lysates prepared from the striatum of STING WT and STING ki mice. (C) Ratio of aSyn and βIII tubulin in lysates prepared from the substantia nigra (SN) or striatum, expressed as relative to the mean of STING WT (SN: *: p=0.0462; STR: *: p=0.0491, t-test, n=5).
Figure 4.
Figure 4.. Activation of IFN and NF-κB/inflammasome related genes in the striatum and SN of STING ki mice.
(A–C) Expression of ISGs in the substantia nigra of STING WT and STING ki mice. (A) Ifi44 (p=0.1552, n=4–5), (B) Mx1 (Mann Whitney test, p=0.9048, n=4–5), (C) Sting1 (P=0.9184, n=4–5). (D–F) Expression of NF-κB/inflammasome related genes in the substantia nigra of STING WT and STING ki mice. (D) Tnfa (p=0.0691, n=4–5), (E) Il1b (Mann Whitney test, *: p=0.0159, n=4–5), (F) Casp1 (**: p=0.0018, n=4–5). (G–L) Expression of ISGs in the striatum of STING WT and STING ki mice. (G) Ifi44 (**: p=0.0078, n=3–4), (H) Mx1 (*: p=0.0183, n=3–4), (I) Sting1 (*: p=0.024, n=3–4). (J–L) Expression of NF-κB/inflammasome related genes in the striatum of STING WT and STING ki mice. (J) Tnfa (n=3–4), (K) Il1b (*: p=0.0397, n=3–4), (L) Casp1 (**: p=0.0017, n=3–5). Markers represent individual animals, bars represent mean ± SD. Analysis was t-test, if not indicated otherwise.
Figure 4—figure supplement 1.
Figure 4—figure supplement 1.. Expression of IFN and NF-κB and inflammasome dependent genes in the cortex of juvenile and adult STING ki mice.
(A–D) Expression of ISGs in the frontal cortex of STING WT and STING ki mice. (A) Ifi44 (***: p=0.0002277; *: p=0.044987, n=5), (B) Mx1 (***: p=0.0000003; *: p=0.016835; for comparison between age groups ***: p=0.000602, n=4–5), (C) Cxcl10 (***: p=0.000001; **: p=0.0017215; for comparison between age groups **: p=0.001483, n=4–5), (D) Sting1 (*: p=0.0184042, n=4–5). (E–G) Expression of NF-κB/inflammasome related genes in the frontal cortex of STING WT and STING ki mice. (E) Tnfa (***: p=0.0001448, for comparison between age groups *: p=0.03952, n=5). (F) Il1b (***: p=0.00005, *: p=0.0389, for comparison between age groups **: p=0.00241, n=4–5). (G) Casp1 (***: p=0.0000369, for comparison between age groups ***: p=0.000064, n=4–5). Markers represent individual animals, bars represent mean ± SD. Analysis was two-way ANOVA with Tukey HSD post-hoc test.
Figure 5.
Figure 5.. Nuclear translocation of pSTAT3 and NF-κB in the striatum of 5-week-old and 20 week-old STING WT and STING ki mice.
(A) Representative images of striatal sections from 5-week-old (upper images) and 20-week-old (lower images) STING WT and STING ki mice stained for Iba1 (green), GFAP (white) and phosphorylated-STAT3 (pSTAT3; red). Images show color coded merged channels (center) and in addition pSTAT3 staining in grayscale (left and right). Scale bar: 10 μm. (B) Representative images of striatal sections from 5-week-old (upper images) and 20 week-old (lower images) STING WT and STING ki mice stained for Iba1 (green), GFAP (white), and NF-κB (red). NF-kB staining is shown in grey in separate images. Scale bar: 10 μm. (C) Number of pSTAT3-positive nuclei/mm3 (***: p=0.00004; **: p=0.0025 for the interaction; two-way ANOVA, Bonferroni post-hoc test, n=5). (D) Number of NF-kB-positive nuclei/mm3 (**: p=0.009; ***: p=0.0007; mean ± SD; two-way ANOVA, Bonferroni post-hoc test, n=5).
Figure 5—figure supplement 1.
Figure 5—figure supplement 1.. Uncropped membranes showing the levels of inflammatory proteins in the striatum.
(A) Representative images of striatal sections from 20-week-old STING WT and STING ki mice stained for phosphorylated-STAT3 (pSTAT3, magenta), Iba1 (blue) and NeuN (green). Images show color-coded merged channels (left) and in addition all channels in grayscale (right). Scale bar: 20 μm. (B) Ratio of NeuN-positive cells positive for pSTAT3 as well: (number of pSTAT3- and NeuN-positive cells)/(total number of NeuN-positve cells); (****: p=0.000065; t-test). (C) Ratio of neuronal pSTAT3-positive nuclei: (number of pSTAT3- and NeuN-positive cells)/(total number of pSTAT3-positve cells); **: p=0.0025; t-test. n=4.
Figure 6.
Figure 6.. Activation of IRF3 and NF-kB-related signalling pathways in double transgenic mice with STING N153S/WT ki and knock-out for Ifnar1 or Caspase-1.
(A) Representative western blot images showing interferon regulatory factor 3 (IRF3, upper panel), the nuclear marker histone deacetylase 1 (HDAC1, middle panel) and cytoplasmic marker glycerinaldehyd-3-phosphat-dehydrogenase (GAPDH, lower panel) detected from the striatum. Images of the whole membrane stained for the different proteins are shown on Figure 6—figure supplement 1A-C. (B) Ratio of IRF3 and HDAC1, expressed as relative to the mean of STING WT (****: p<0.00001; **: p=0.0043; two-way ANOVA with Tukey post-hoc test, n=4). Ratio of IRF3 and GAPDH expressed as relative to the mean of STING WT is shown on Figure 6—figure supplement 1D. (C) Representative western blot images showing NLR family pyrin domain containing 3 (NLRP3, upper panel), Il1b and pro-Il1b (middle panel) and the loading control βIII tubulin (lower panel) detected from the striatum. Images of the whole membrane stained for the different proteins are shown on Figure 6—figure supplement 1E-H. (D) Ratio of NLRP3 and βIII tubulin, expressed as relative to the mean of STING WT (**: p<0.0057; **: p=0.0029; two-way ANOVA with Tukey post-hoc test, n=4). (E) Ratio of Il1b and pro-Il1b, expressed as relative to the mean of STING WT (****: p<0.00001; two-way ANOVA with Tukey post-hoc test, n=4). (F) Representative images of striatal sections stained for the astroglia marker GFAP (green), microglia marker Iba1 (magenta), apoptosis-associated speck-like protein (ASC, cyan) and Hoechst (blue) from STING WT or STING ki mice on a background of interferon a receptor knockout (Ifnar1-/-), caspase-1 knockout (Casp1-/-) or Ifnar1+/+, Casp1+/+ (Ctrl.). Scale bar: 20 μm. Magnified insets show Iba1 and ASC, cyan arrowheads indicate ASC specks. (G) Area fraction of ASC signal within microglia as relative to the mean of STING WT (****: p<0.00001; two-way ANOVA with Tukey post-hoc test, n=4–5). (H) Number of ASC-positive dots within microglia as relative to the mean of STING WT (****: p<0.00001; two-way ANOVA with Tukey post-hoc test, n=4–5). (I) Number of ASC-positive dots within astroglia as relative to the mean of STING WT (**: p=0.0083; ***: p=0.0006; two-way ANOVA with Tukey post-hoc test, n=4–5). Graph showing area fraction of ASC signal within astroglia is on Figure 6—figure supplement 1I.
Figure 6—figure supplement 1.
Figure 6—figure supplement 1.. Uncropped membranes showing the levels of inflammatory proteins in the striatum.
(A–C) Images of the whole membrane developed for the HDAC1 (A), GAPDH (B) and IRF3 signals. (D) Ratio of IRF3 and GAPDH signal (‘cytoplasmic IRF3’) as relative to the mean of STING WT (two-way ANOVA with Tukey HSD post-hoc test, n=4). (E–H) Images of the whole membrane developed for the NLRP3 and Il1b with short exposure time (E) or longer exposure time (F); and for βIII tubulin (H). Membrane was cut between the NLRP3 and tubulin signals. (I) Area fraction positive for ASC signal within GFAP-positive astroglia, as relative to the mean of STING WT (****: p<0.00001; *: p=0.038, two-way ANOVA with Tukey HSD post-hoc test, n=4–5). (J) Mean intensity of ASC signal in GFAP-positive or in Iba1-positive cells, expressed as relative to astroglial ASC signal in STING WT animals (***: p=0.0001; ****: p=0.000054; interaction: ****: p=0.000078, n=4–5).
Figure 7.
Figure 7.. Neuroinflammation in adult double transgenic mice with STING ki and knock-out for Ifnar1 or Caspase-1.
(A) Heatmap showing z-scores of different inflammatory markers in double transgenic mice with STING N153S/WT ki and knock-out for Ifnar1 or Caspase-1. Graphs with data for each mediator individually are on (Figure 7—figure supplement 2). (B) Representative images of striatal sections stained for the microglia marker Iba1. Sections were obtained from adult STING WT (upper images) or STING ki (lower images) mice on a background of interferon a receptor knockout (Ifnar1-/-), caspase-1 knockout (Casp1-/-) or Ifnar1+/+, Casp1+/+ (Ctrl.). Scale bar: 50 μm. (C) Representative images of striatal sections stained for the astroglia marker GFAP from STING WT (upper images) or STING ki (lower images) mice on a background of interferon a receptor knockout (Ifnar1-/-), caspase-1 knockout (Casp1-/-) or Ifnar1+/+, Casp1+/+ (Ctrl.). Scale bar: 50 μm. (D) Area fraction positive for Iba1, normalized to the mean of STING WT brains (differences in +/+ mice ***: p=0.0000001; for Ifnar1-/- ***: p=0.000003; for Casp1-/- ***: p=0.0029374; two-way ANOVA with Bonferroni post-hoc test, n=5–6). (E) Area fraction positive for GFAP, normalized to STING WT on Ctrl. Background (***: p=0.0000 for STING WT vs STING ki on Ctrl.; ***: p=0.0000 on Ifnar1-/-; background, ***: p=0.0006 on Casp1-/- background; two-way ANOVA with Bonferroni post-hoc test, n=5–6).
Figure 7—figure supplement 1.
Figure 7—figure supplement 1.. Expression of IFN- and NF-κB/inflammasome related genes in the cortex of double transgenic mice with STING N153S/WT ki and knock-out for Ifnar1 or Caspase-1.
Gene expression in the cortex (two-way ANOVA with Tukey HSD post-hoc test). (A) Ifi44 (*: p=0.01414; **: p=0.0037655; for interaction between Ctrl. and Ifnar1-/-, **: p=0.005101, n=4–5). (B) Mx1 (*: p=0.02823; **: p=0.00573, n=4–5). (C) Il1b (Ctrl. background *: p=0.04534; **: p=0.005405; Casp1-/- background *: p=0.0107096; for interaction between Ctrl. and Casp1-/-, *: p=0.01298, n=4–5). (D) Cxcl10 (Ctrl. background **: p=0.0030844; Ifnar1-/- background: p=0.025893; Casp1-/- background **: p=0.0041598, n=4–5). (E) Tnfa (all differences n.s., n=4–5). (F) Sting1 (all differences n.s., n=4–5).
Figure 7—figure supplement 2.
Figure 7—figure supplement 2.. Levels of inflammatory mediators and gene expression in the striatum of double transgenic mice with STING N153S/WT ki and knock-out for Ifnar1 or Caspase-1.
(A–M) Tissue levels of different ‘M1’ and ‘M2’ mediators in the striatum as measured by LegendPlex Immunoassay (ANOVA with Tukey HSD post-hoc test). (A) IFNα (*: p=0.0394; for interaction: *: p=0.0465); (B) IFNγ (*: p=0.0194); (C) Cxcl9 (*: p=0.0129); (D) Cxcl10 (*: p=0.0223); (E) CCL3 (***: p=0.0009); (F) CCL2 (*: p=0.0264); (G) TNFα; (H) IL-6; (I) CCL4; (J) Il4; (K) IL-10; (L) GM-CSF; (M) VEGF; (N–Q) Gene expression in the striatum (two-way ANOVA with Tukey HSD post-hoc test). (N) Nos2 (*: p=0.0214). (O) Ym-1 (***: p=0.0004). (P) Il4. (Q) Retnla, b or g (p=0.021). (R) Principal component analysis (PCA) of immune mediators shows segregation of STING ki animals on the Ifnar1+/+, Casp1+/+ (ki) and on the Ifnar1-/- (Ifnar1-/- ki) from all other groups. n=4–6.
Figure 8.
Figure 8.. Oxidative stress in the striatum of double transgenic mice with STING N153S/WT ki and knock-out for Ifnar1 or Caspase-1.
(A) Mitochondrial reactive oxygen species (ROS) of striatal lysates determined using MitoSOX and expressed relative to the mean of STING WT (**: p=0.0072; ****: p<0.00001; two-way ANOVA with Tukey post-hoc test, n=4). (B) Cytoplasmic ROS of striatal lysates determined using DCFH-DA and expressed relative to the mean of STING WT (****: p<0.00001; *: p=0,034; **: p=0.0069; two-way ANOVA with Tukey post-hoc test, n=4). (C) Nitrite levels as markers of nitric oxide activity measured in striatal lysates (****: p<0.00001; **: p=0.0052; two-way ANOVA with Tukey post-hoc test, n=4–5).
Figure 9.
Figure 9.. Degeneration of dopaminergic neurons in double transgenic mice with STING N153S/WT ki and knock-out for Ifnar1 or Caspase-1.
(A) Representative images of striatal sections stained for tyrosine hydroxylase (TH) from STING WT (upper images) or STING ki (lower images) mice on a background of interferon a receptor knockout (Ifnar1-/-), caspase-1 knockout (Casp1-/-) or Ifnar1+/+, Casp1+/+ (Ctrl.). Scale bar: 10 μm. (B) Area fraction positive for TH, normalized to STING WT on Ctrl. background (***: p=0.0000 for Ctrl. background; *: p=0.043 for Ifnar1-/-; **: p=0.0126845 for Casp1-/-; for interaction between Ctrl. background and Ifnar1-/-: p=0.00157; between Ctrl. and Casp1-/-: p=0.007326; two-way ANOVA with Bonferroni post-hoc test, n=5–6). (C) Concentration of dopamine in striatal lysates of STING WT and STING ki mice, normalized to STING WT on Ctrl. background. (***: p=0.0005; t-test, n=5–6). Dopamine metabolism is shown on Figure 9—figure supplement 1.
Figure 9—figure supplement 1.
Figure 9—figure supplement 1.. Dopamine metabolism in the striatum of double transgenic mice with STING N153S/WT ki and knock-out for Ifnar1 or Caspase-1.
Dopamine metabolism in the striatum (**: p=0.0073; two-way ANOVA, Tukey HSD post-hoc test, n=3–8).
Author response image 1.
Author response image 1.. Example for correct genotyping of animals used in the experiments.
(a) PCR product by using primers specifically detecting the N153S variant of STING. (b) PCR product by using primers specifically detecting the WT (mouse) variant of STING. Mice with ID 66, 69, 70 and 71 are STING ki expressing both the mutant Sting1 and the WT Sting1. Mice with ID 67, 68, 72, 73 are STING WT. (c) PCR product by using primers specifically detecting the mouse Ifnar. (d) PCR product by using primers specifically detecting the lack of mouse Ifnar. All mice are Ifnar-/-.
Author response image 2.

References

    1. Anderson JP, Walker DE, Goldstein JM, de Laat R, Banducci K, Caccavello RJ, Barbour R, Huang J, Kling K, Lee M, Diep L, Keim PS, Shen X, Chataway T, Schlossmacher MG, Seubert P, Schenk D, Sinha S, Gai WP, Chilcote TJ. Phosphorylation of Ser-129 is the dominant pathological modification of alpha-synuclein in familial and sporadic Lewy body disease. The Journal of Biological Chemistry. 2006;281:29739–29752. doi: 10.1074/jbc.M600933200. - DOI - PubMed
    1. Balka KR, Louis C, Saunders TL, Smith AM, Calleja DJ, D’Silva DB, Moghaddas F, Tailler M, Lawlor KE, Zhan Y, Burns CJ, Wicks IP, Miner JJ, Kile BT, Masters SL, De Nardo D. Tbk1 and IKKε act redundantly to mediate STING-induced NF-κB responses in myeloid cells. Cell Reports. 2020;31:107492. doi: 10.1016/j.celrep.2020.03.056. - DOI - PubMed
    1. Balka K.R, De Nardo D. Molecular and spatial mechanisms governing sting signalling. The FEBS Journal. 2021;288:5504–5529. doi: 10.1111/febs.15640. - DOI - PubMed
    1. Bantle CM, Rocha SM, French CT, Phillips AT, Tran K, Olson KE, Bass TA, Aboellail T, Smeyne RJ, Tjalkens RB. Astrocyte inflammatory signaling mediates α-synuclein aggregation and dopaminergic neuronal loss following viral encephalitis. Experimental Neurology. 2021;346:113845. doi: 10.1016/j.expneurol.2021.113845. - DOI - PMC - PubMed
    1. Bauernfeind FG, Horvath G, Stutz A, Alnemri ES, MacDonald K, Speert D, Fernandes-Alnemri T, Wu J, Monks BG, Fitzgerald KA, Hornung V, Latz E. Cutting edge: NF-kappab activating pattern recognition and cytokine receptors license NLRP3 inflammasome activation by regulating NLRP3 expression. Journal of Immunology. 2009;183:787–791. doi: 10.4049/jimmunol.0901363. - DOI - PMC - PubMed

Publication types

MeSH terms

Substances