. 2022 Nov 23;96(22):e0151322.
doi: 10.1128/jvi.01513-22. Epub 2022 Oct 31.

eIF4A3 Promotes RNA Viruses' Replication by Inhibiting Innate Immune Responses

Affiliations

eIF4A3 Promotes RNA Viruses' Replication by Inhibiting Innate Immune Responses

Qingxia Gao et al. J Virol. .

Abstract

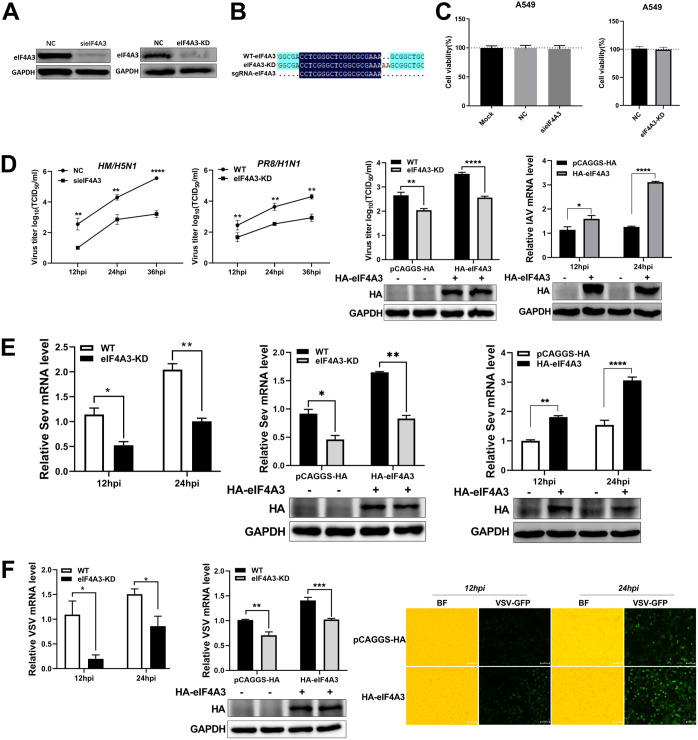
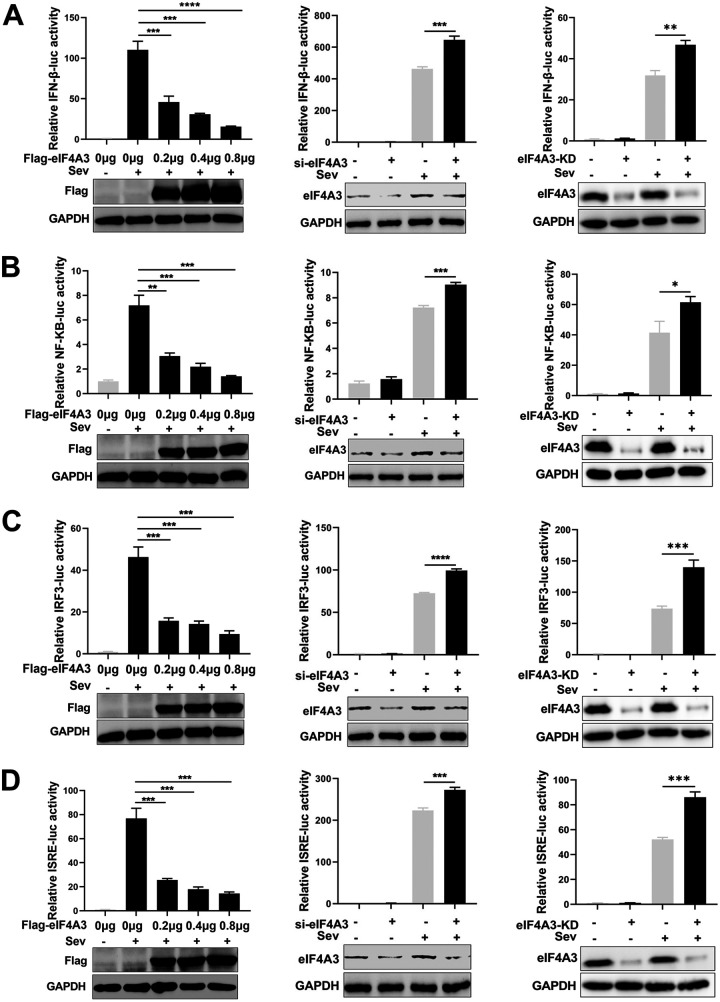
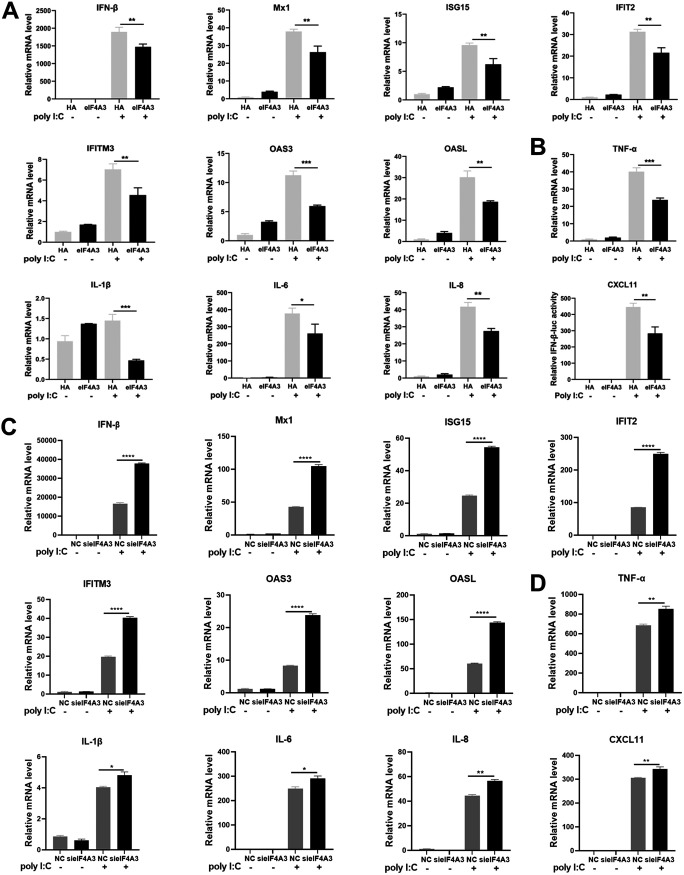
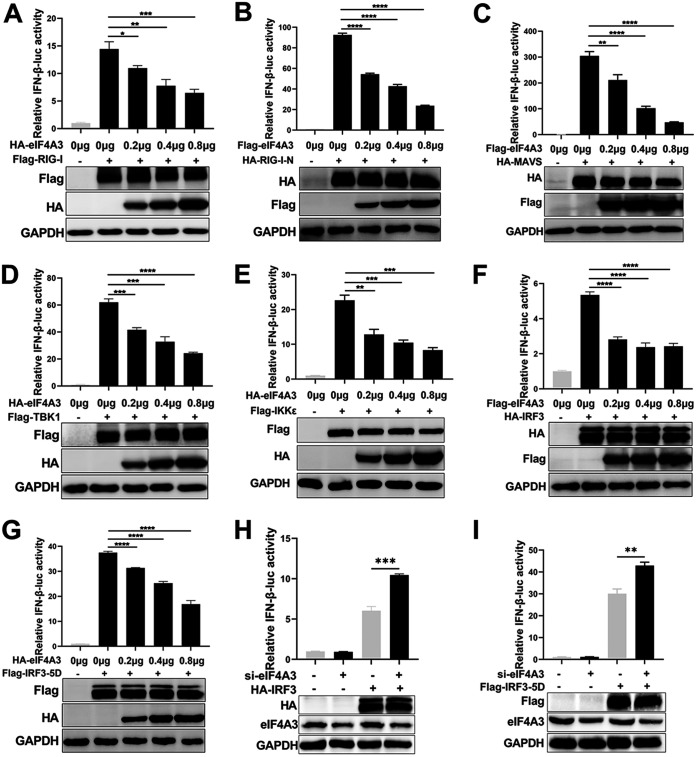
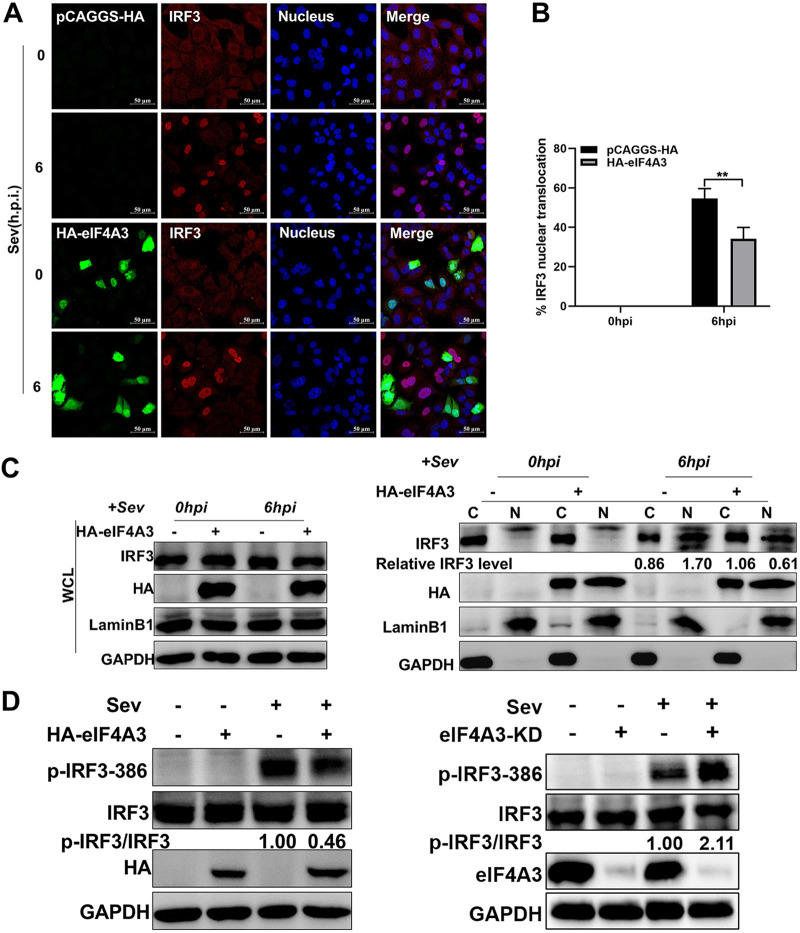
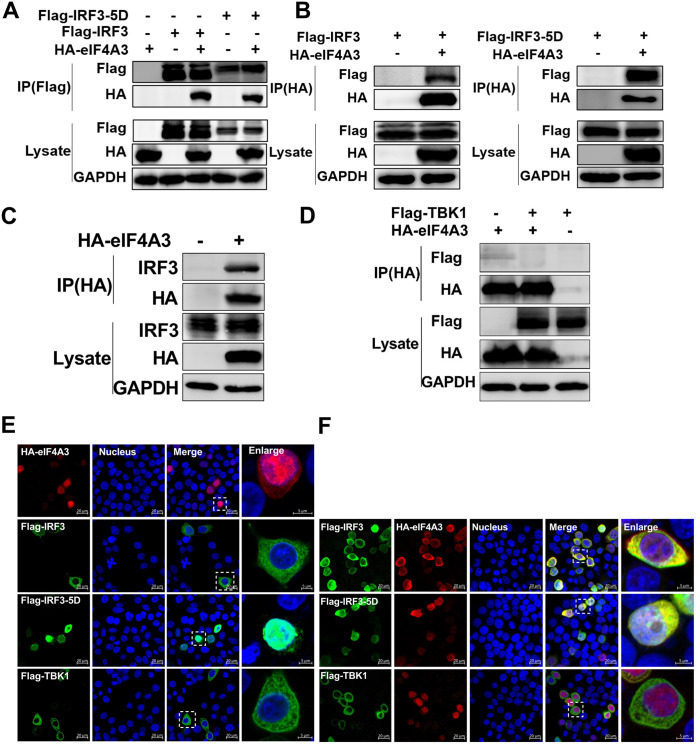
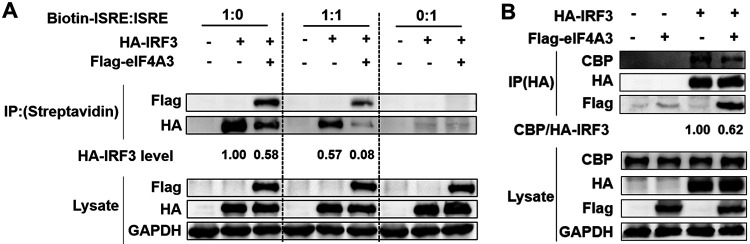
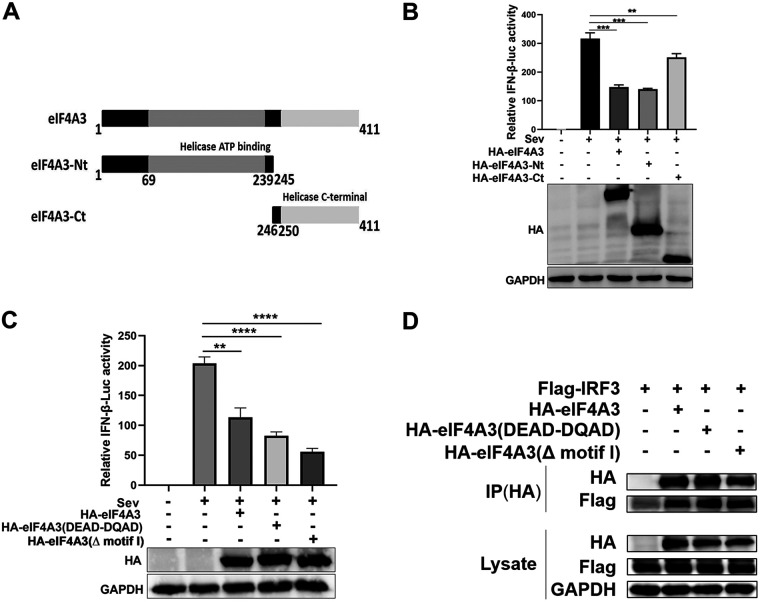
Viral infection activates the type I interferons (IFNs) and cellular antiviral responses. Eukaryotic initiation factor 4A-III (eIF4A3) has been shown to promote influenza A virus (IAV) replication by promoting viral mRNA splicing and spliced mRNA nuclear export. Here, we identified eIF4A3 as a negative regulator of virus-triggered type I IFN induction. Our study found that eIF4A3 promoted multiple RNA viruses' replication by binding to IFN regulatory factor 3 (IRF3) and impaired the interaction between tank-binding kinase 1 (TBK1) and IRF3, leading to attenuation of the phosphorylation of IRF3 by TBK1, the formation of IRF3 dimer, and the nuclear translocation of IRF3. This impaired its biological functions in the nucleus, which blocked IRF3 binding to interferon-stimulated response element (ISRE) and the interaction of IRF3 and CBP/p300, resulting in inhibiting the transcription of IFN-β and downstream IFN-stimulated genes (ISGs), thereby impairing innate antiviral immune responses against RNA viruses. These findings reveal a previously unknown function of eIF4A3 in host innate immunity and establish a mechanistic link between eIF4A3 and IRF3 activation that expands potential therapeutic strategies for viral infectious diseases. IMPORTANCE Production of type I IFN is pivotal for the cellular antiviral immunity. Virus infection leads to the activation of transcription factor IRF3 and subsequent production of type I IFN to eliminate viral infection. Thus, the regulation of IRF3 activity is an important way to affect type I IFN production. IRF3 activation requires phosphorylation, dimerization, and nuclear translocation. Here, we first reported that eIF4A3, a member of DEAD box family, served as a negative regulator of antiviral innate immune responses by inhibiting IRF3 activation. Mechanistically, eIF4A3 binds to IRF3 to impair the recruitment of IRF3 by TBK1, which is independent of eIF4A3 ATP binding, ATPase, and RNA helicase activities. Our study delineates a common mechanism of eIF4A3 promoting replication of different RNA viruses and provides important insights into the negative regulation of host antiviral innate immune responses against virus infections.

Keywords: IFN-β; IRF3; eIF4A3; innate immune responses.


Conflict of interest statement

The authors declare no conflict of interest.

Figures

FIG 1
FIG 1
The positive regulation of eIF4A3 on IAV, SeV, and VSV replication. (A to D) eIF4A3 promotes the replication of IAV. (A) The silencing efficiency of eIF4A3 or CRISPR-mediated knockdown efficiency of eIF4A3 was measured by Western blot assay. (B) The Sanger sequencing result indicated that a frameshift occurred in the eIF4A3 knockdown cells (eIF4A3-KD). (C) The cell viability of sieIF4A3 cells or eIF4A3 knockdown cells was measured by CCK-8 assay (mean ± SD of three independent experiments; *, P < 0.05; **, P < 0.01; ***, P < 0.001; ****, P < 0.0001; two-tailed Student’s t test). (D) The effect of eIF4A3 on HM and PR8 replication. A549 cells were transfected with sieIF4A3 or NC for 24 h, and were infected with HM virus (MOI, 0.01). The cell supernatants were harvested at 12 hpi, 24 hpi, and 36 hpi. Virus titers were determined by TCID50 assay on MDCK cells. eIF4A3 knockdown A549 cells or WT A549 cells were infected with PR8 (MOI, 0.1). Cell supernatants were collected at 12 hpi, 24 hpi, and 36 hpi, and virus titers were determined by TCID50 assay on MDCK cells. eIF4A3 knockdown A549 cells and WT A549 cells were transfected with HA-eIF4A3 or vector for 24 h and were infected with PR8 virus (MOI, 0.1). Cell supernatants were collected at 24 hpi, and virus titers were determined by TCID50 assay on MDCK cells. A549 cells were transfected with HA-eIF4A3 or vector for 24 h and were infected with PR8 at an MOI of 0.1. Samples were collected at 12 hpi and 24 hpi. The mRNA level of NP was detected by qRT-PCR. The viral RNAs levels were normalized to the GAPDH level (mean ± SD of three independent experiments *, P < 0.05; **, P < 0.01; ***, P < 0.001; ****, P < 0.0001; two-tailed Student’s t test). (E) The effect of eIF4A3 on SeV replication. eIF4A3 knockdown A549 cells or WT A549 cells were infected with SeV virus at an MOI of 1.0. Samples were collected at 12 hpi and 24 hpi. The mRNA level of SeV-N was detected by qRT-PCR, and the viral RNAs levels were normalized to the GAPDH level. eIF4A3 knockdown A549 cells and WT A549 cells were transfected with HA-eIF4A3 or vector for 24 h and were infected with SeV virus at an MOI of 1.0. Samples were collected at 24 hpi. The mRNA level of SeV-N was detected by qRT-PCR, and the viral RNAs levels were normalized to the GAPDH level. A549 cells were transfected with HA-eIF4A3 or vector for 24 h and were infected with SeV virus at an MOI of 1.0. Samples were collected at 12 hpi and 24 hpi. The mRNA level of SeV-N was detected by qRT-PCR. The viral RNA levels were normalized to the GAPDH level (mean ± SD of three independent experiments; *, P < 0.05; **, P < 0.01; ***, P < 0.001; ****, P < 0.0001; two-tailed Student’s t test). (F) The effect of eIF4A3 on VSV-GFP replication. eIF4A3 knockdown A549 cells or WT A549 cells were infected with VSV-GFP (MOI, 1.0). Samples were collected at 12 hpi and 24 hpi. The VSV-GFP viral RNA level was determined by qRT-PCR. The viral RNA levels were normalized to the GAPDH level. eIF4A3 knockdown A549 cells or WT A549 cells were transfected with HA-eIF4A3 or vector for 24 h and infected with VSV-GFP (MOI, 1.0). Samples were collected at 24 hpi. The VSV-GFP viral RNA level was determined by qRT-PCR. The viral RNA levels were normalized to the GAPDH level. A549 cells were transfected with HA-eIF4A3 or vector for 24 h and infected with VSV-GFP (MOI, 1.0). The VSV-GFP was visualized by fluorescence microscopy at 12 hpi and 24 hpi (×100 magnification) (mean ± SD of three independent experiments; *, P < 0.05; **, P < 0.01; ***, P < 0.001; ****, P < 0.0001; two-tailed Student’s t test).
FIG 2
FIG 2
(A to D) The negative regulation of eIF4A3 on IFN-β, NF-κB, IRF3, and ISRE promoter. HEK293T cells were transfected with increasing amounts of Flag-eIF4A3 or sieIF4A3 and the IFN-β/NF-κB/IRF3/ISRE luciferase reporter. Then, 24 h after transfection, the cells were stimulated by SeV for 10 h and measured by the luciferase assays. eIF4A3 knockdown A549 cells or WT A549 cells were transfected with the IFN-β/NF-κB/IRF3/ISRE luciferase reporter. The cells were stimulated with SeV for another 10 h after 24 h posttransfection and measured by the luciferase assays. For all experiments described above, the data are presented as the mean ± SD of three independent experiments (*, P < 0.05; **, P < 0.01; ***, P < 0.001; ****, P < 0.0001; two-tailed Student’s t test).
FIG 3
FIG 3
The inhibition of eIF4A3 on the transcription of IFN-β and ISGs. (A and B) Overexpression of eIF4A3 inhibited the mRNA of IFN-β, ISGs, and cytokines. A549 cells were transfected with HA-eIF4A3 or control vector (HA), followed by stimulation with or no stimulation with poly(I·C) (100 ng) for 6 h. The mRNA levels of the indicated target genes were measured by qRT-PCR. (C and D) sieIF4A3 promoted the mRNA of IFN-β, ISGs, and cytokines. A549 cells were treated with negative-control RNAs (NC) and siRNAs targeting eIF4A3 (sieIF4A3) for 24 h, and then cells were both induced or uninduced by poly(I·C) (100 ng) for 6 h. The mRNA levels of the indicated target genes were detected by qRT-PCR. All the mRNA levels were normalized to the GAPDH level (mean ± SD of three independent experiments; *, P < 0.05; **, P < 0.01; ***, P < 0.001; ****, P < 0.0001; two-tailed Student’s t test).
FIG 4
FIG 4
The reduction of eIF4A3 on the RIG-I inducing pathway. (A to G) The effect of eIF4A3 on the activation of IFN-β promoter induced by RIG-I (A), RIG-I-N (B), MAVS (C), TBK1 (D), IKKε (E), IRF3 (F), and IRF3-5D (G). HEK293T cells were transfected with the IFN-β-luc (0.3 μg) and pRL-TK (0.02 μg), plus the indicated signal molecules (0.3 μg), along with an increasing amount of HA-eIF4A3 (0, 0.2, 0.4, and 0.8 μg). Then, 24 h after transfection, IFN-β promoter luciferase activities were detected by dual-luciferase reporter assay. (H and I) The effect of eIF4A3 on the activation of IFN-β promoter induced by IRF3 (H) and IRF3-5D (I). HEK293T cells were transfected with sieIF4A3 for 6 h and then transfected with IFN-β-luc (0.3 μg), pRL-TK (0.02 μg), and IRF3 or IRF3-5D (1 μg). Then, 24 h after transfection, IFN-β promoter luciferase activities were detected by dual-luciferase reporter assay. For all experiments described above, the data are presented as the mean ± SD of three independent experiments (*, P < 0.05; **, P < 0.01; ***, P < 0.001; ****, P < 0.0001; two-tailed Student’s t test).
FIG 5
FIG 5
The inhibition of eIF4A3 on IRF3 activation. (A to C) Effect of eIF4A3 on nuclear translocation of IRF3. A549 cells were transfected with HA-eIF4A3 or vector (HA) and simulated with SeV for 6 h after 24 h of transfection. (A) Confocal microscopy was performed using an anti-IRF3 rabbit antibody (red) and anti-HA mouse antibody (green). DAPI was used to stain for the nucleus (blue). Samples were examined with a confocal microscope (LSM 880; Zeiss). Images are representative of three independent experiments. Scale bar = 50 μM. (B) Quantitative analysis of IRF3 translocation. At least 100 cells in each group were scored (*, P < 0.05; **, P < 0.01; ***, P < 0.001; ****, P < 0.0001; two-tailed Student’s t test). (C) Western blot analysis of the distribution of IRF3 in the cytoplasmic and nuclear factions. The indicated cells were subjected to isolation of cytoplasmic and nuclear fractions. Lamin B1 and GAPDH were used as the loading control for nuclear and cytoplasmic fractions, respectively. The band intensities were quantified, and relative cytoplasmic IRF3 levels (IRF3/GAPDH) and relative nuclear IRF3 levels (IRF3/lamin B1) are shown below. (D) Effect of eIF4A3 on the phosphorylation of IRF3 induced by SeV. A549 cells were transfected with HA-eIF4A3 or vector (HA), and simulated with SeV for 6 h after 24 h of transfection or eIF4A3 knockdown A549 cells and WT A549 cells infected with SeV for 6 h. The cell lysates were harvested for the Western blot analysis using anti-IRF3 antibody and anti-Ser386 phosphorylated IRF3 antibody. The band intensities were quantified, and relative IRF3 levels (p-IRF3-386/IRF3) are shown below.
FIG 6
FIG 6
The interaction between eIF4A3 and IRF3. (A and B) Immunoblot analysis of the interactions between IRF3, IRF3-5D, and eIF4A3. HEK293T cells were transfected with HA-eIF4A3, Flag-IRF3, and Flag-IRF3-5D, followed by lysing at 24 h posttransfection. A co-IP assay was carried out using anti-HA immunomagnetic beads or anti-Flag immunomagnetic beads, followed by a Western blot assay. (C) The endogenous interaction between eIF4A3 and IRF3. HEK293T cells were transfected with HA-eIF4A3, followed by lysing at 24 h posttransfection. Immunoblot analysis was performed by using anti-HA immunomagnetic beads. (D) The interaction between eIF4A3 and TBK1. HEK293T cells were transfected with HA-eIF4A3 and Flag-TBK1, followed by lysing at 24 h posttransfection. Immunoblot analysis was performed by using anti-HA immunomagnetic beads. (E) Subcellular location of HA-eIF4A3, Flag-IRF3, Flag-IRF3-5D, or Flag-TBK1. HeLa cells were grown on coverslips and transfected with HA-eIF4A3, Flag-IRF3, Flag-IRF3-5D, or Flag-TBK1. Cells were fixed at 24 h posttransfection and stained for detecting eIF4A3 (red) and signal molecules (green) using the anti-HA rabbit antibodies and anti-Flag mouse antibodies, followed by the Alexa Fluor 594-conjugated AffiniPure goat anti-rabbit secondary antibodies and Alexa Fluor 488-conjugated AffiniPure goat anti-mouse secondary antibodies. DAPI was used to stain the nucleus (blue). Samples were examined with a confocal microscope (LSM 880; Zeiss). Images are representative of three independent experiments. Scale bar = 20 μM. (F) Colocalization of Flag-IRF3, Flag-IRF3-5D, or Flag-TBK1 and HA-eIF4A3. HeLa cells were grown on coverslips and transfected with HA-eIF4A3, Flag-IRF3, Flag-IRF3-5D, and Flag-TBK1. The remaining steps are the same as in panel E.
FIG 7
FIG 7
The inhibition of eIF4A3 on TBK1-IRF3 signaling. (A) The effect of eIF4A3 on the interaction between IRF3 and TBK1. Coimmunoprecipitation and immunoblot analysis of HEK293T cells transfected with Flag-TBK1, HA-IRF3, and Myc-eIF4A3 or sieIF4A3 HEK293T cells. The band intensities were quantified, and relative precipitated HA-IRF3/Flag-TBK1 or IRF3/TBK1 ratios are shown below. (B) Effect of eIF4A3 on the phosphorylation of IRF3 induced by TBK1. HEK293T cells were transfected with Flag-TBK1, HA-IRF3, and Myc-eIF4A3 to detect p-IRF3 at Ser 386 by Western blot analysis. The band intensities were quantified, and relative IRF3 levels (p-IRF3/IRF3) are shown below. (C) Identification of a binding site for the IRF3-eIF4A3 interaction. Coimmunoprecipitation and immunoblot analysis of HEK293T cells transfected with HA-eIF4A3, Flag-EGFP, Flag-EGFP-ΔIRF3 and Flag-IRF3 or HA-TBK1, Flag-EGFP, Flag-EGFP-ΔIRF3, and Flag-IRF3. (D) Effect of eIF4A3 on the dimer formation of IRF3 induced by TBK1. HEK293T cells were transfected with Flag-TBK1, HA-IRF3, and Myc-eIF4A3 to detect IRF3 dimer by native PAGE analysis; * represents the indicated protein.
FIG 8
FIG 8
eIF4A3 impedes IRF3 binding onto ISRE and the interaction of IRF3 and CBP/p300. (A) Effect of eIF4A3 on IRF3 binding to ISRE. HEK293T cells were transfected with HA-IRF3 in the absence or presence of Flag-eIF4A3 and infected with SeV at 24 h posttransfection. At 12 hpi, cells were lysed, the biotinylated or unbiotinylated DNA probes were incubated with streptavidin beads for 2 h at 4°C, and then the probe-coated beads were incubated with cell lysates at 4°C overnight. The beads were washed five times with cold IP lysis buffer, and Western blot analysis was done to detect IRF3 and eIF4A3 by using an anti-HA and anti-Flag antibody. The band intensities were quantified, and the HA-IRF3 levels are shown below. (B) The interaction between IRF3 and CBP/p300 in the absence or presence of Flag-eIF4A3. HEK293T cells were transfected with the HA-IRF3 and Flag- eIF4A3 or its control expression vector (Flag). After 24 h, cells were infected with SeV for 12 h. A co-IP assay was carried out using anti-HA antibody to immunoprecipitate endogenous CBP. The band intensities were quantified, and relative precipitated CBP/HA-IRF3 ratios are shown.
FIG 9
FIG 9
The inhibition of eIF4A3 on IFN-β does not rely on ATP binding, RNA-dependent ATPase, or RNA helicase activities. (A) Schematic diagram of the eIF4A3 truncated segments. (B) Effect of eIF4A3, eIF4A3-Nt, or eIF4A3-Ct on the IFN-β luciferase activity. HEK293T cells were transfected with the HA-eIF4A3, HA-eIF4A3-Nt, HA-eIF4A3-Ct, or vector (HA) and the IFN-β luciferase reporter, plus the pRL-TK. Then, 24 h after transfection, the cells were stimulated by SeV for 10 h and measured by the luciferase assays (*, P < 0.05; **, P < 0.01; ***, P < 0.001; ****, P < 0.0001; two-tailed Student’s t test). (C) Effect of eIF4A3, eIF4A3(DEAD-DQAD), or eIF4A3(Δ motif I) on the IFN-β luciferase activity. HEK293T cells were transfected with the HA-eIF4A3, HA-eIF4A3(DEAD-DQAD), HA-eIF4A3(Δ motif I), or vector (HA) and the IFN-β luciferase reporter, plus the pRL-TK. Then, 24 h after transfection, the cells were stimulated by SeV for 10 h and measured by the luciferase assays (*, P < 0.05; **, P < 0.01; ***, P < 0.001; ****; P < 0.0001; two-tailed Student’s t test). (D) Interactions between Flag-IRF3 and HA-eIF4A3, HA-eIF4A3(DEAD-DQAD), or HA-eIF4A3(Δ motif I). HEK293T cells were transfected with Flag-IRF3 and HA-eIF4A3, HA-eIF4A3(DEAD-DQAD), or HA-eIF4A3(Δ motif I), followed by lysing at 24 h posttransfection. A co-IP assay was carried out using anti-HA immunomagnetic beads, followed by a Western blot assay.

Similar articles

Cited by

References

    1. Akira S, Uematsu S, Takeuchi O. 2006. Pathogen recognition and innate immunity. Cell 124:783–801. 10.1016/j.cell.2006.02.015. - DOI - PubMed
    1. Kumar H, Kawai T, Akira S. 2011. Pathogen recognition by the innate immune system. Int Rev Immunol 30:16–34. 10.3109/08830185.2010.529976. - DOI - PubMed
    1. Meylan E, Curran J, Hofmann K, Moradpour D, Binder M, Bartenschlager R, Tschopp J. 2005. Cardif is an adaptor protein in the RIG-I antiviral pathway and is targeted by hepatitis C virus. Nature 437:1167–1172. 10.1038/nature04193. - DOI - PubMed
    1. Xu LG, Wang YY, Han KJ, Li LY, Zhai Z, Shu HB. 2005. VISA is an adapter protein required for virus-triggered IFN-beta signaling. Mol Cell 19:727–740. 10.1016/j.molcel.2005.08.014. - DOI - PubMed
    1. Seth RB, Sun L, Ea CK, Chen ZJ. 2005. Identification and characterization of MAVS, a mitochondrial antiviral signaling protein that activates NF-kappaB and IRF 3. Cell 122:669–682. 10.1016/j.cell.2005.08.012. - DOI - PubMed

Publication types

MeSH terms