

Temperature synchronizes temporal variation in laying dates across European hole-nesting passerines
- PMID: 36314902
- PMCID: PMC10078612
- DOI: 10.1002/ecy.3908
Temperature synchronizes temporal variation in laying dates across European hole-nesting passerines
Abstract
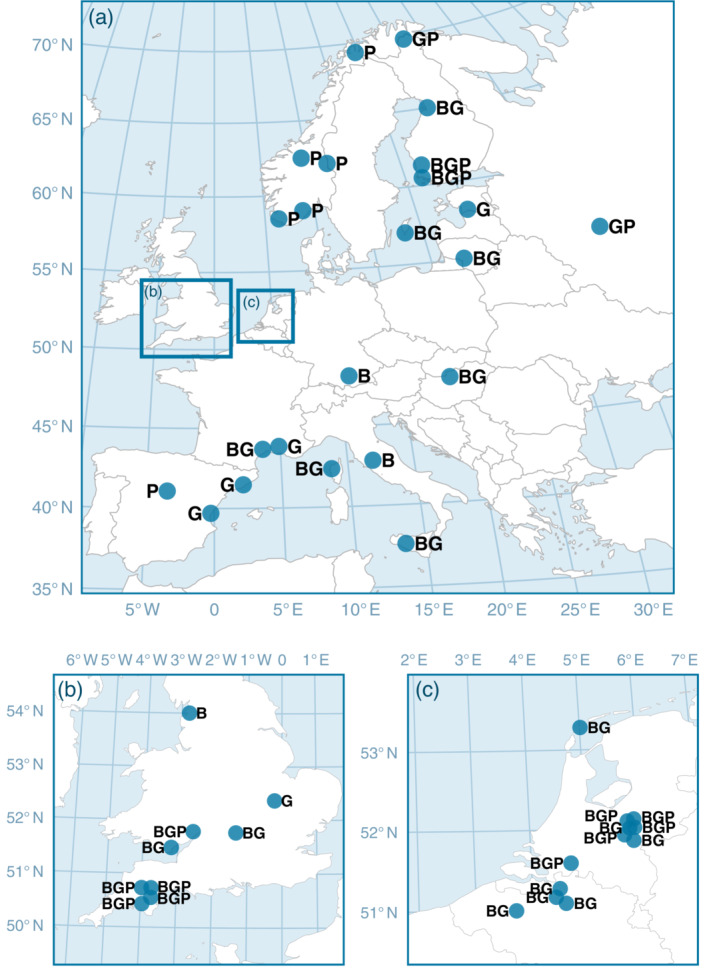
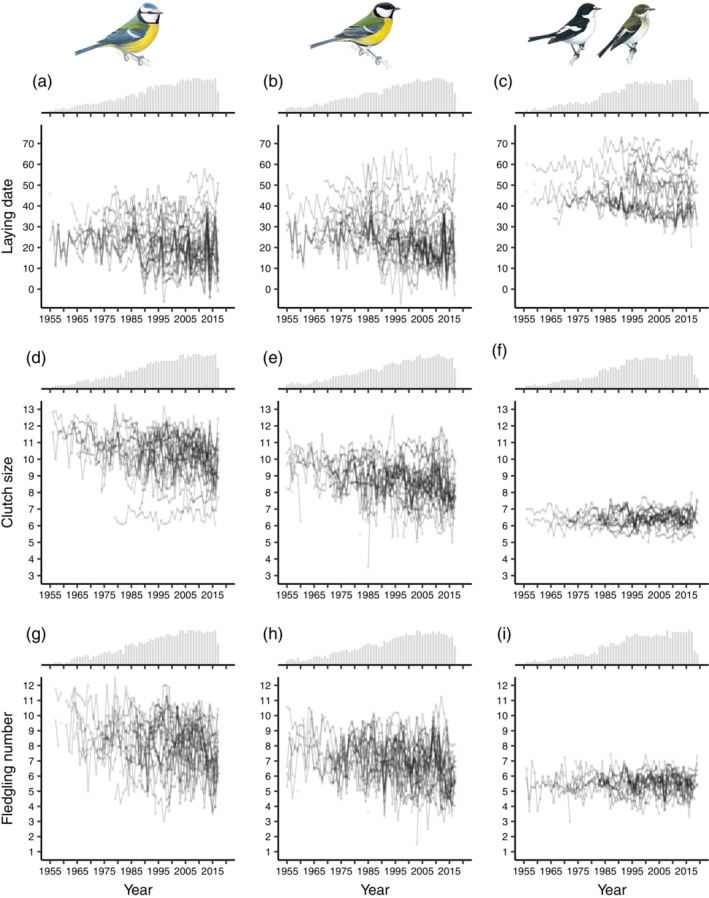
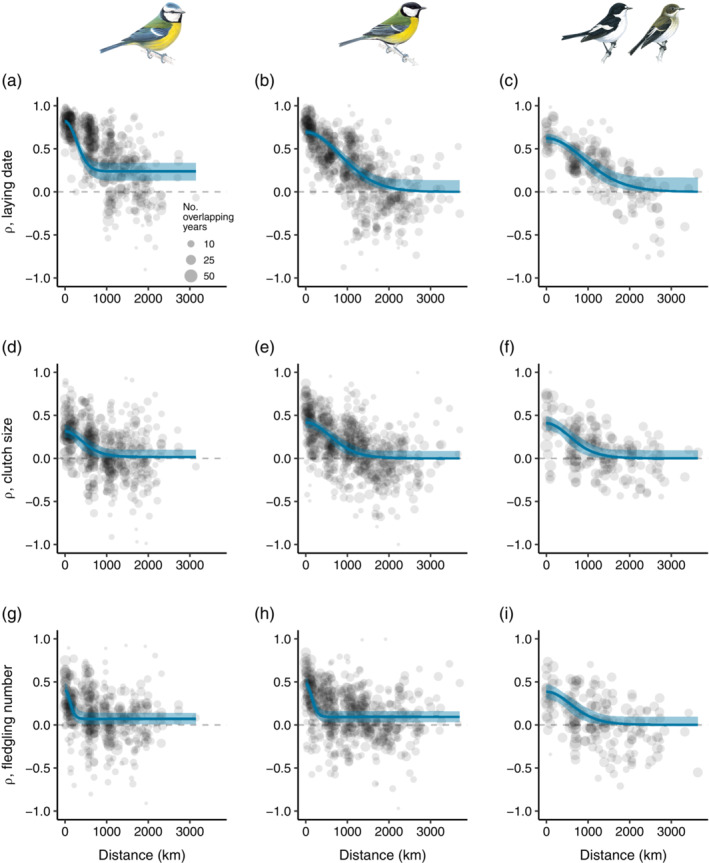
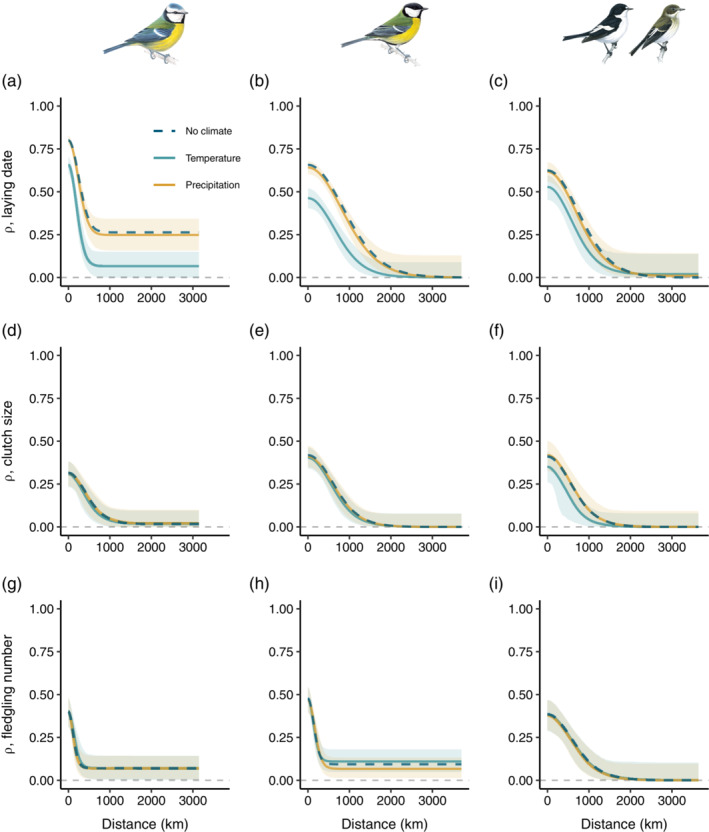
Identifying the environmental drivers of variation in fitness-related traits is a central objective in ecology and evolutionary biology. Temporal fluctuations of these environmental drivers are often synchronized at large spatial scales. Yet, whether synchronous environmental conditions can generate spatial synchrony in fitness-related trait values (i.e., correlated temporal trait fluctuations across populations) is poorly understood. Using data from long-term monitored populations of blue tits (Cyanistes caeruleus, n = 31), great tits (Parus major, n = 35), and pied flycatchers (Ficedula hypoleuca, n = 20) across Europe, we assessed the influence of two local climatic variables (mean temperature and mean precipitation in February-May) on spatial synchrony in three fitness-related traits: laying date, clutch size, and fledgling number. We found a high degree of spatial synchrony in laying date but a lower degree in clutch size and fledgling number for each species. Temperature strongly influenced spatial synchrony in laying date for resident blue tits and great tits but not for migratory pied flycatchers. This is a relevant finding in the context of environmental impacts on populations because spatial synchrony in fitness-related trait values among populations may influence fluctuations in vital rates or population abundances. If environmentally induced spatial synchrony in fitness-related traits increases the spatial synchrony in vital rates or population abundances, this will ultimately increase the risk of extinction for populations and species. Assessing how environmental conditions influence spatiotemporal variation in trait values improves our mechanistic understanding of environmental impacts on populations.
Keywords: birds; climate; clutch size; comparative analysis; fitness-related traits; fledgling number; phenology; spatial synchrony; timing of breeding; weather.
© 2022 The Authors. Ecology published by Wiley Periodicals LLC on behalf of The Ecological Society of America.
Conflict of interest statement
The authors declare no conflict of interest.
Figures
References
-
- Ahola, M. , Laaksonen T., Sippola K., Eeva T., Rainio K., and Lehikoinen E.. 2004. “Variation in Climate Warming along the Migration Route Uncouples Arrival and Breeding Dates.” Global Change Biology 10: 1610–7.
-
- Ahola, M. P. , Laaksonen T., Eeva T., and Lehikoinen E.. 2009. “Great Tits Lay Increasingly Smaller Clutches than Selected for: A Study of Climate‐ and Density‐Related Changes in Reproductive Traits.” Journal of Animal Ecology 78: 1298–306. - PubMed
-
- Bailey, L. D. , and van de Pol M.. 2016. “Tackling Extremes: Challenges for Ecological and Evolutionary Research on Extreme Climatic Events.” Journal of Animal Ecology 85: 85–96. - PubMed
-
- Berven, K. A. , and Gill D. E.. 1983. “Interpreting Geographic Variation in Life‐History Traits.” American Zoologist 97: 85–97.
Publication types
MeSH terms
Associated data
LinkOut - more resources
Full Text Sources