. 2022 Dec 5;221(12):e202203081.
doi: 10.1083/jcb.202203081. Epub 2022 Oct 31.

The central scaffold protein CEP350 coordinates centriole length, stability, and maturation

Affiliations

The central scaffold protein CEP350 coordinates centriole length, stability, and maturation

Onur Rojhat Karasu et al. J Cell Biol. .

Abstract

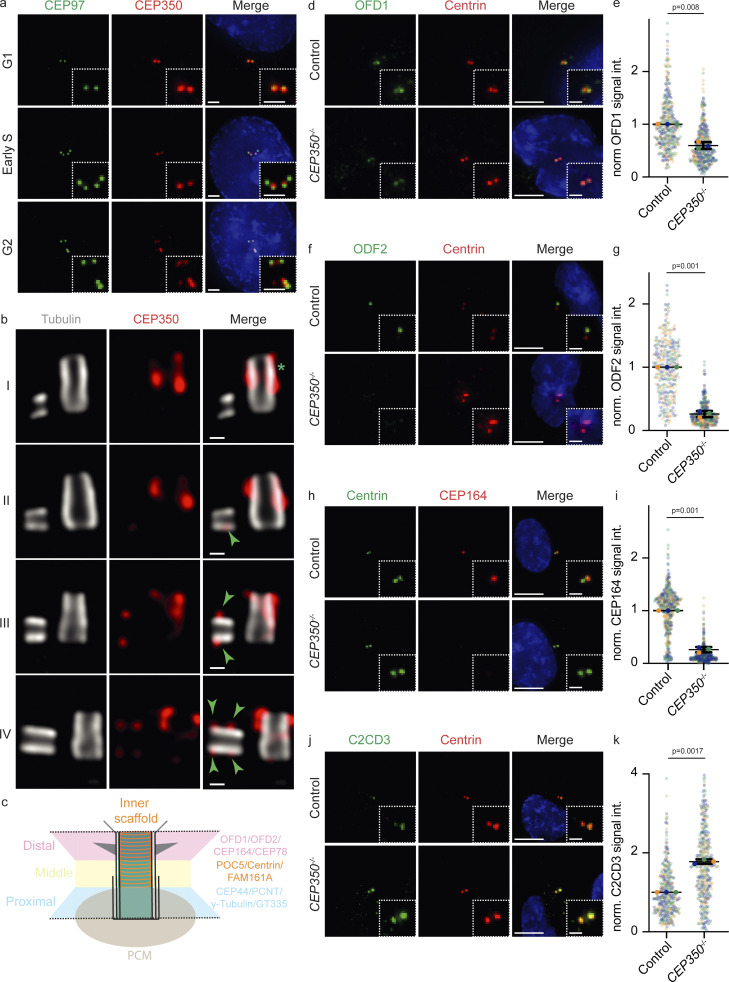
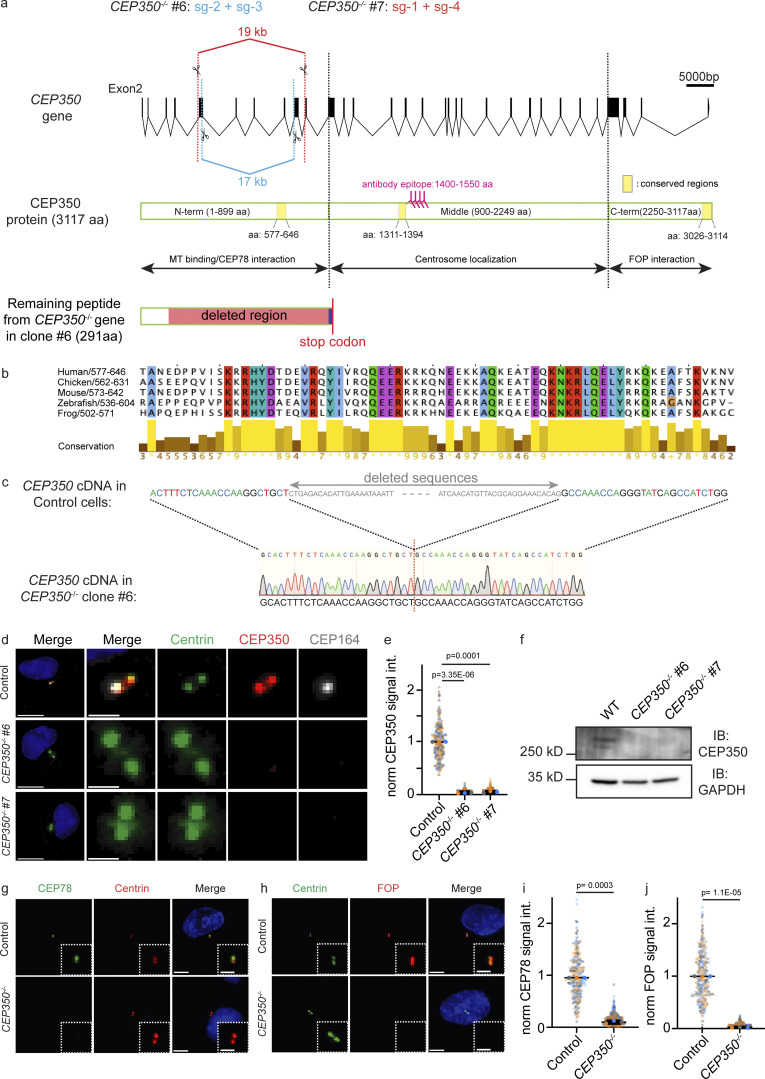
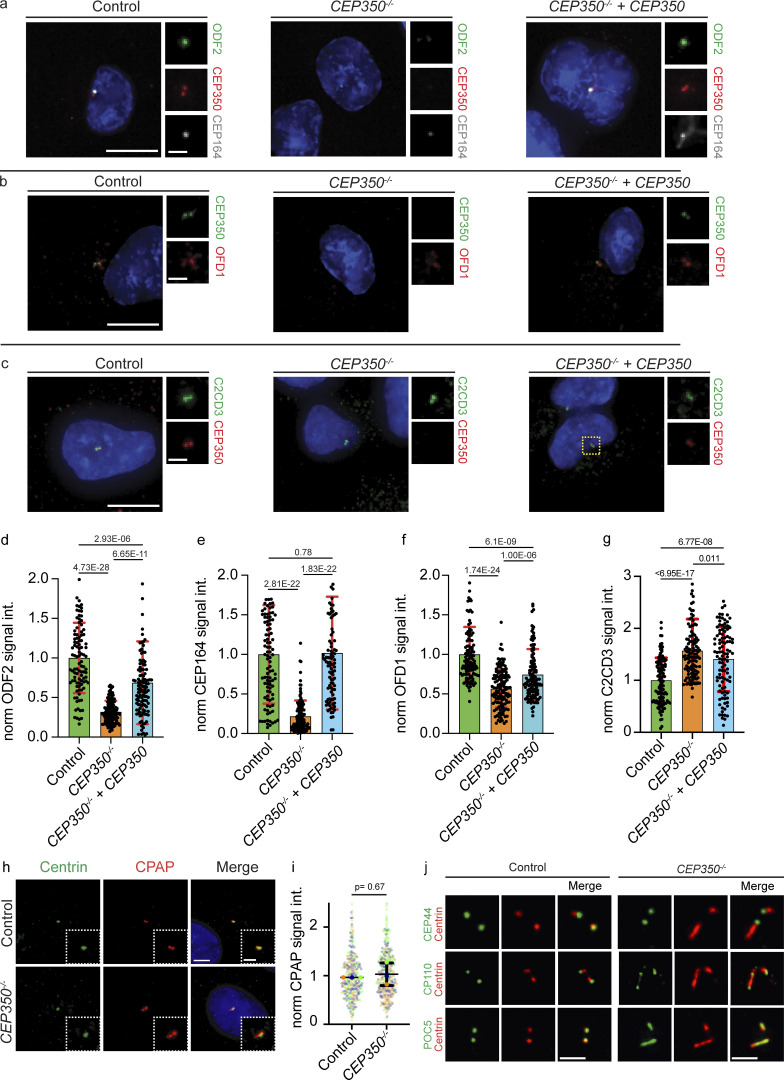
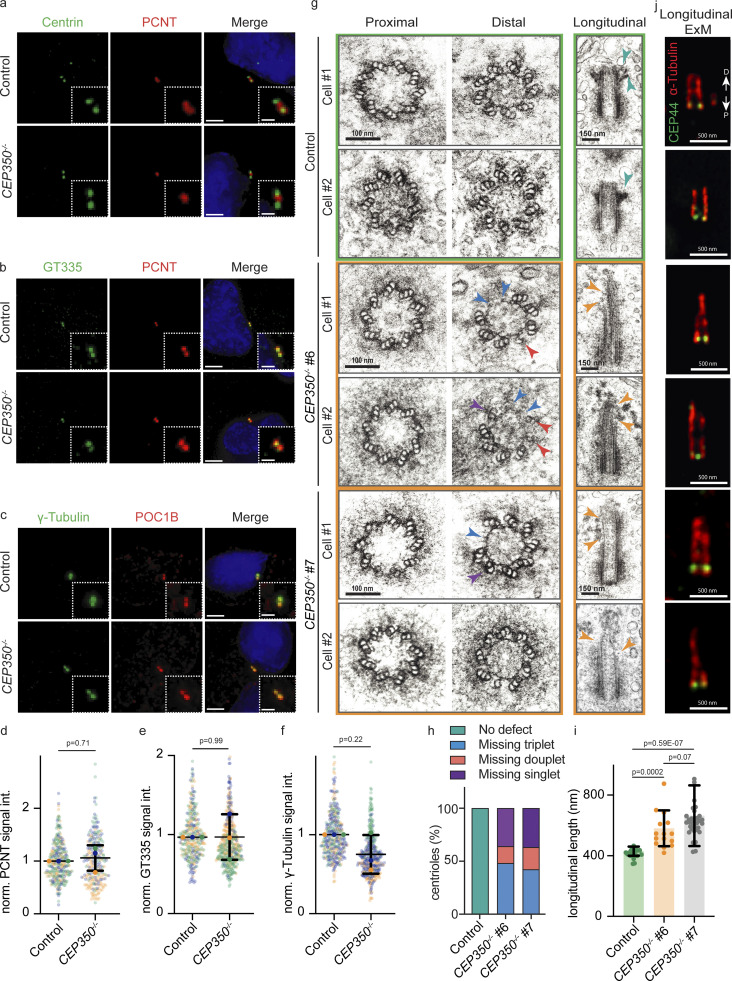
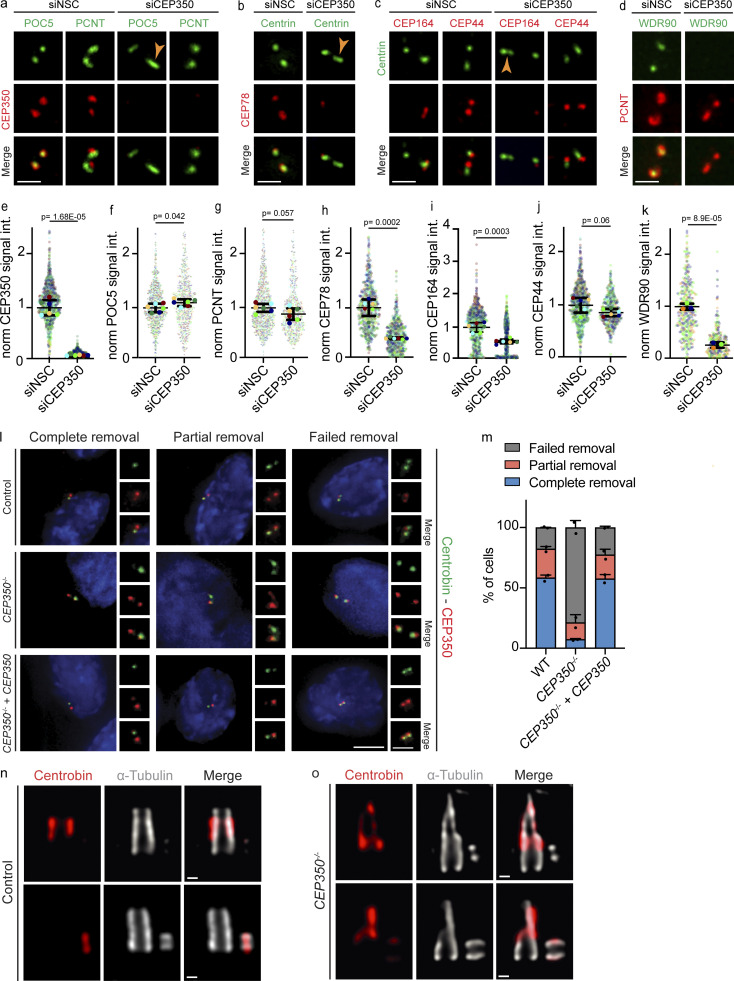
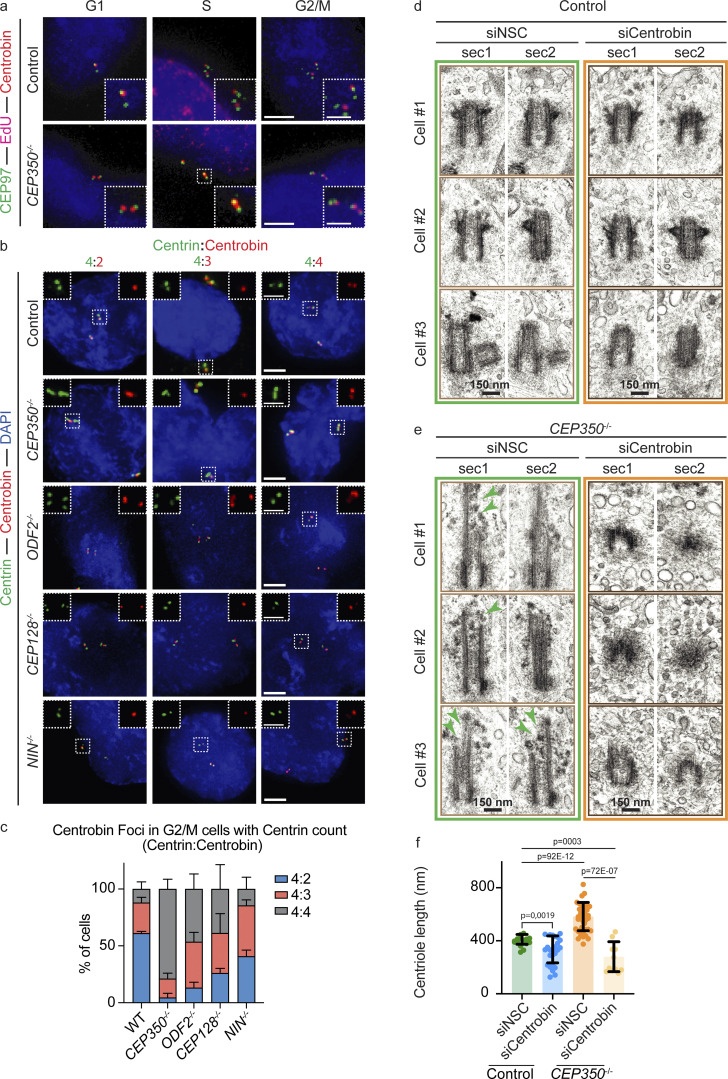
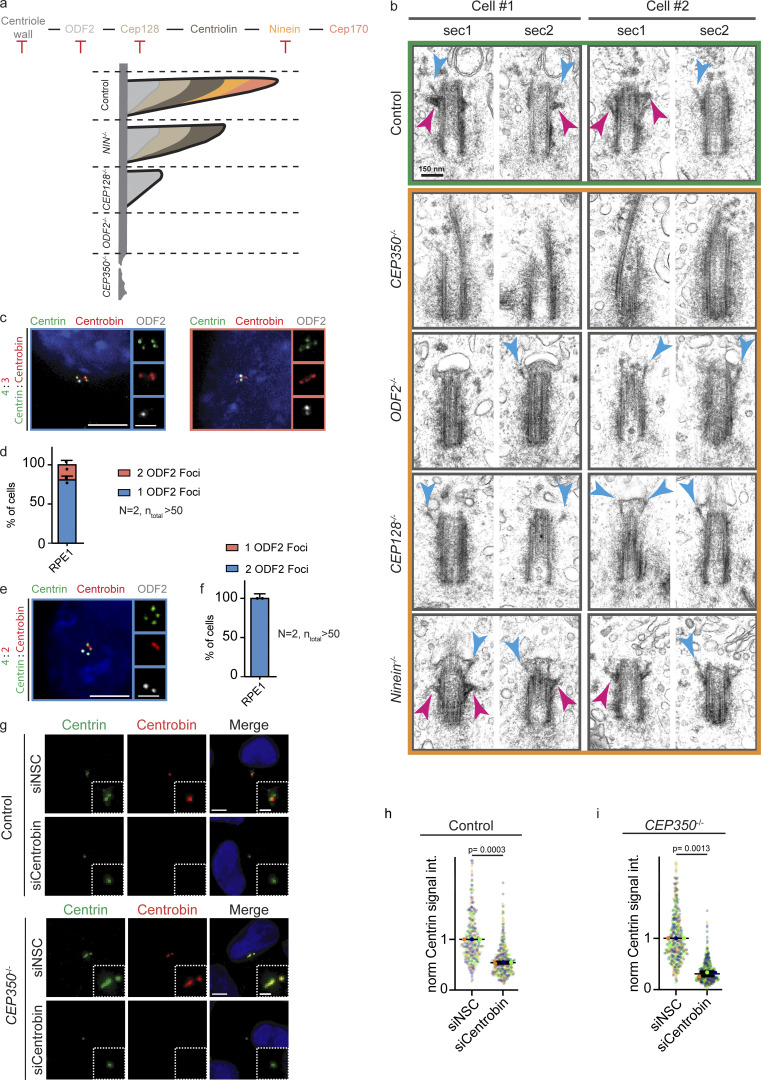
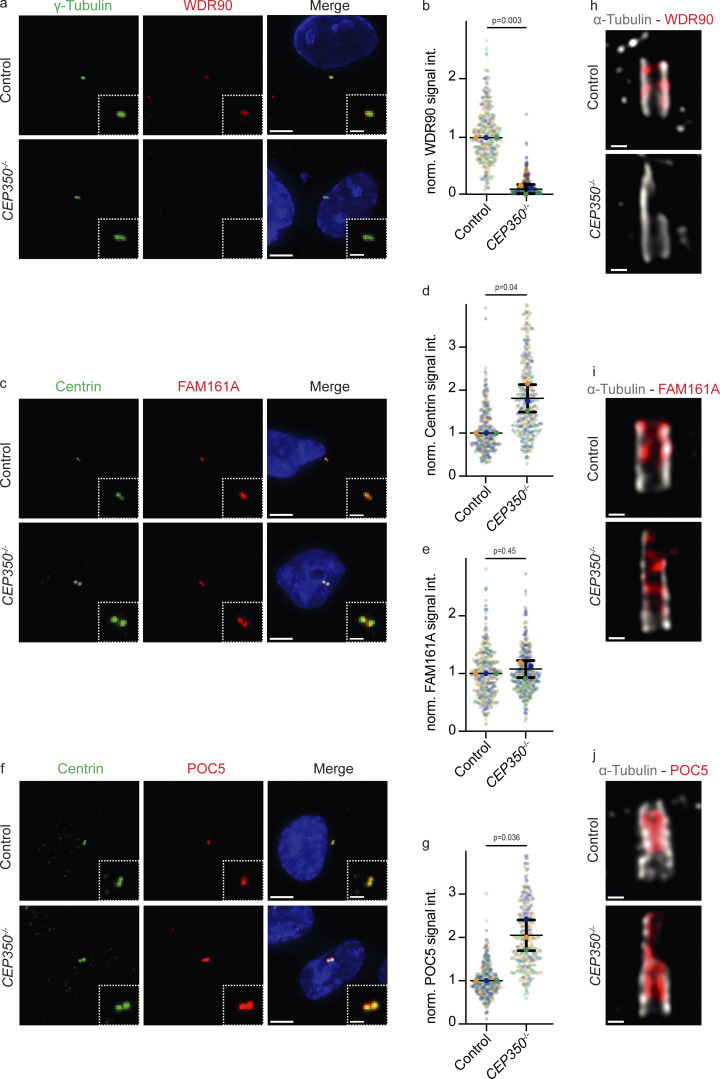
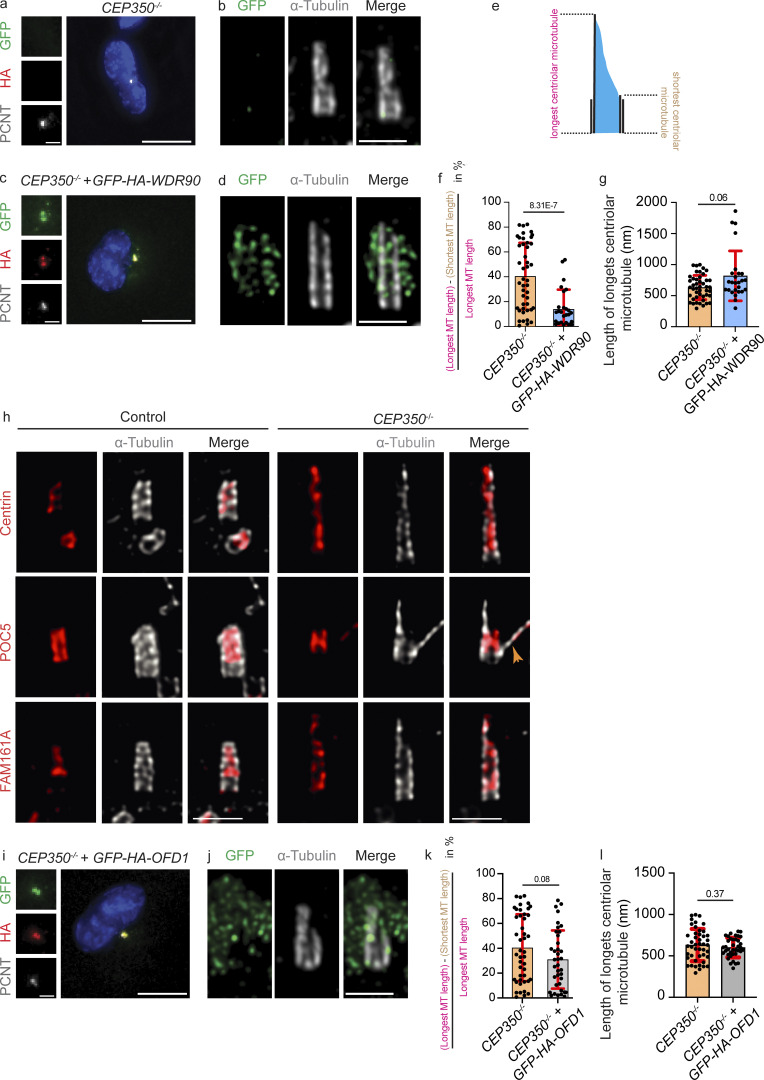
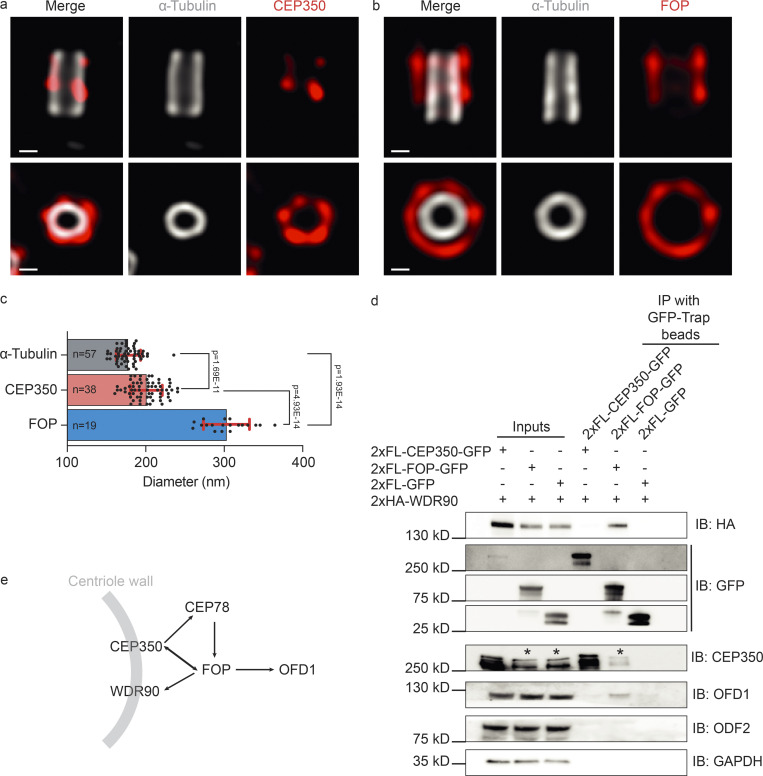
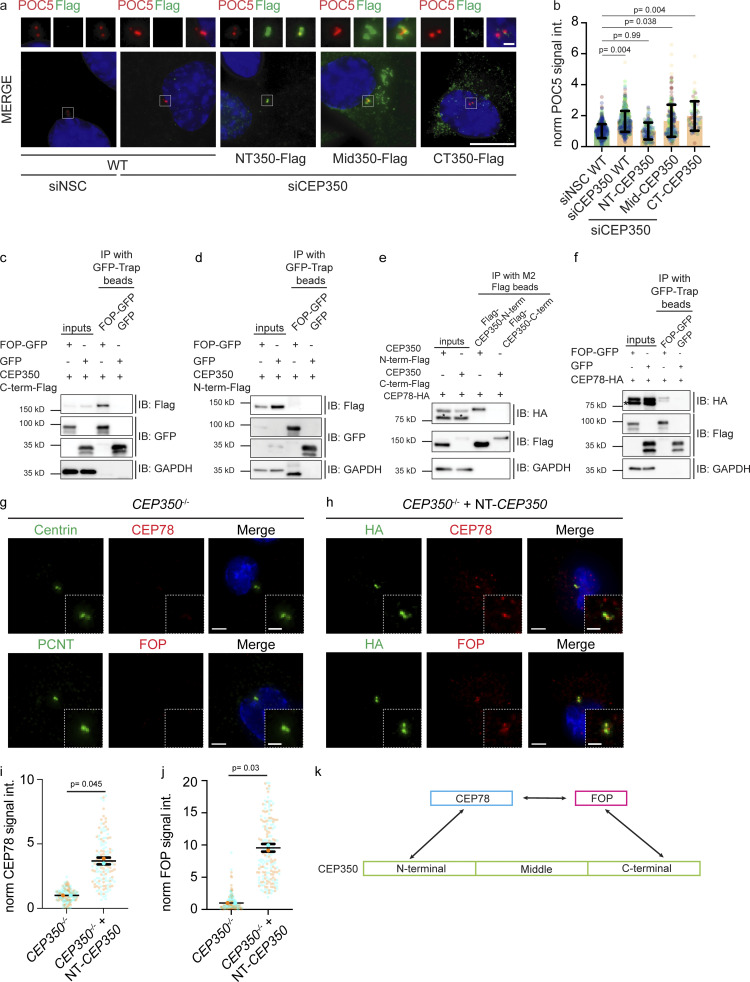
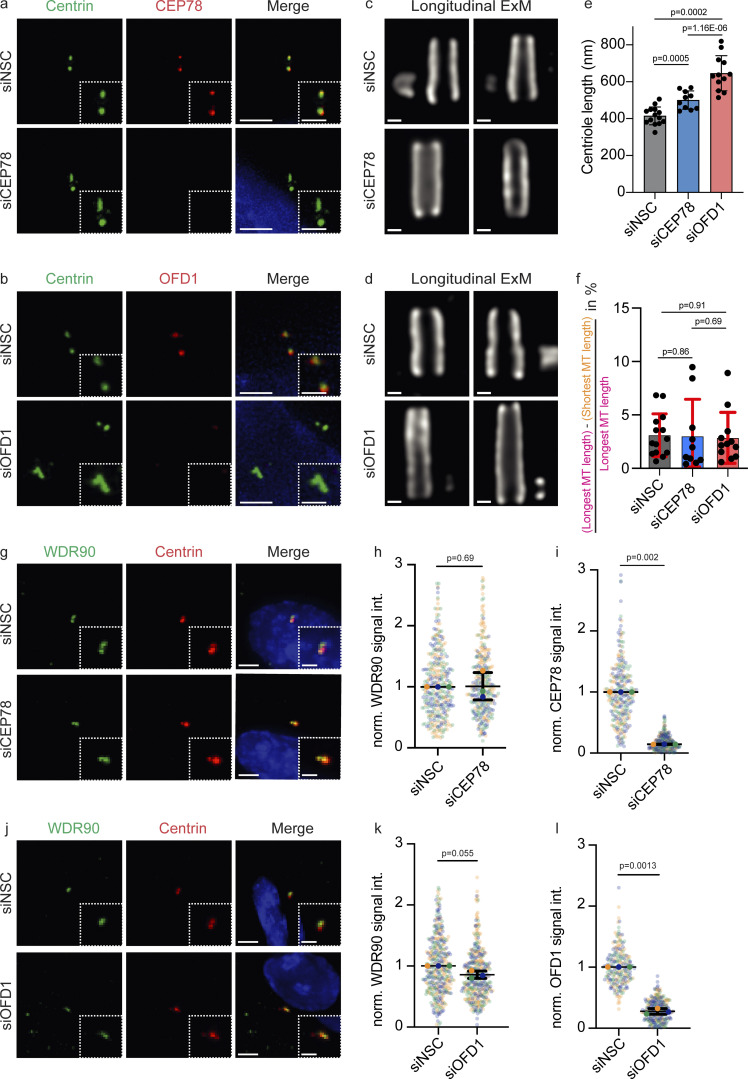
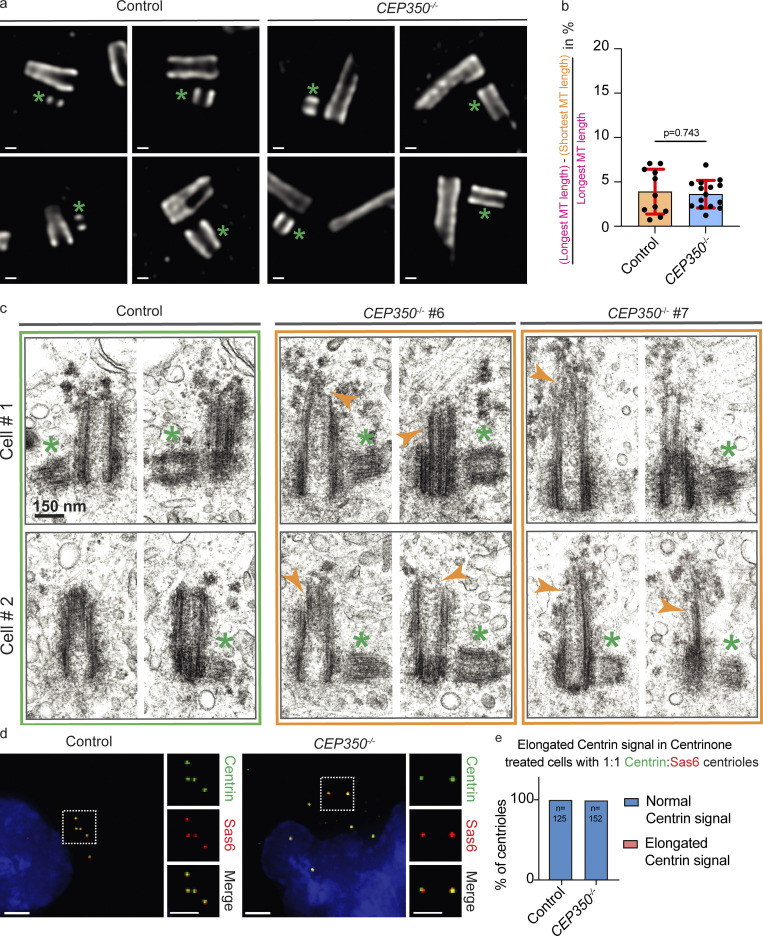
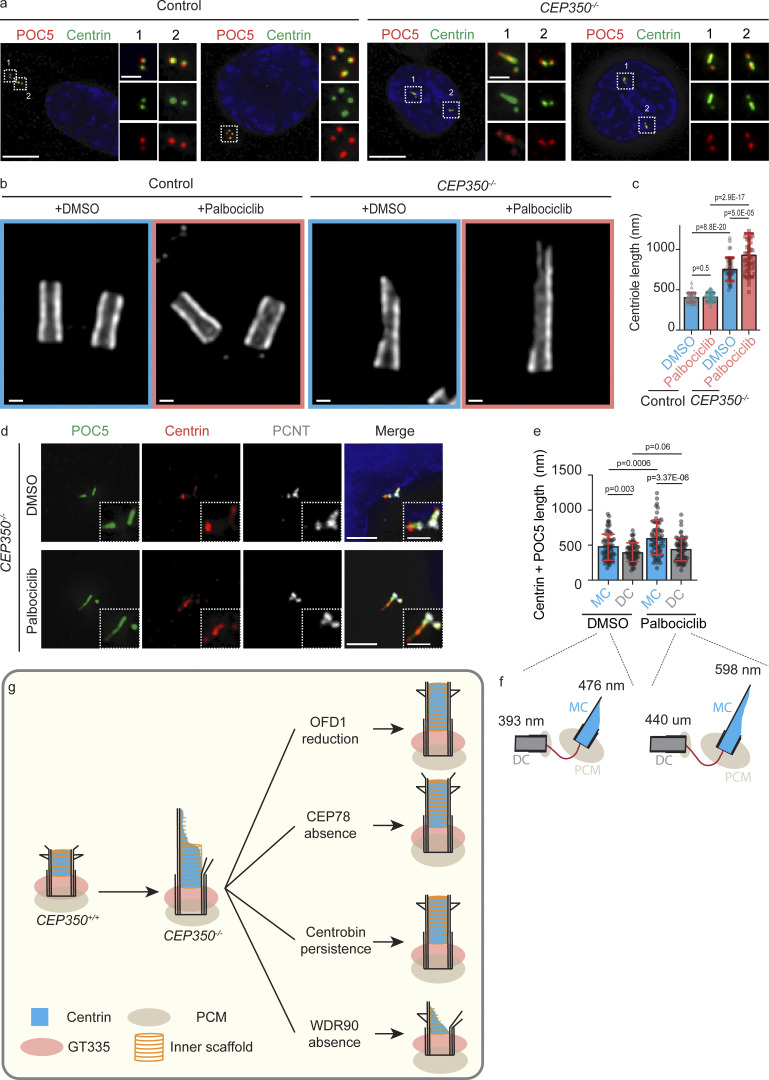
The centriole is the microtubule-based backbone that ensures integrity, function, and cell cycle-dependent duplication of centrosomes. Mostly unclear mechanisms control structural integrity of centrioles. Here, we show that the centrosome protein CEP350 functions as scaffold that coordinates distal-end properties of centrioles such as length, stability, and formation of distal and subdistal appendages. CEP350 fulfills these diverse functions by ensuring centriolar localization of WDR90, recruiting the proteins CEP78 and OFD1 to the distal end of centrioles and promoting the assembly of subdistal appendages that have a role in removing the daughter-specific protein Centrobin. The CEP350-FOP complex in association with CEP78 or OFD1 controls centriole microtubule length. Centrobin safeguards centriole distal end stability, especially in the compromised CEP350-/- cells, while the CEP350-FOP-WDR90 axis secures centriole integrity. This study identifies CEP350 as a guardian of the distal-end region of centrioles without having an impact on the proximal PCM part.


Figures

Figure 1.
Figure 1.
CEP350 is stepwise recruited to assembling centrioles. (a) IF images of cycling CEP350 WT control cells that were fixed and stained for CEP97 (green), CEP350 (red), and DNA with DAPI (blue) to understand the relative recruitment time of CEP350. (b) u-ExM images showing the step-wise centriolar recruitment of CEP350. Centrioles of CEP350 WT control cells were stained with α-tubulin (gray) and CEP350 (red) antibodies. Green arrowheads indicate CEP350 signal at daughter centrioles. The green asterisk marks the mother centriole with CEP350 at its distal end. I, II, III, and IV represent recruitment phases of CEP350 that were ordered according to the length of the daughter centriole. (c) Centriole regions based on protein composition and structural compartmentalization are represented as a cartoon. (d) OFD1 (green), Centrin (red), and DAPI (blue) in control and CEP350−/− cells. (e) Quantification of the OFD1 signals at centrioles represented in d. (f) Image of ODF2 (green), Centrin (red), and DNA by DAPI (blue) in control and CEP350−/− cells. (g) Quantification of the ODF2 signals at centrioles in f. (h) Centrin (green), CEP164 (red), and DAPI (blue) in control and CEP350−/− cells. (i) Quantification of the CEP164 signals at centrioles in h. (j) C2CD3 (green), Centrin (red), and DAPI (blue) in control and CEP350−/− cells. (k) Quantification of the C2CD3 signals at centrioles in j. (a, b, d, f, h, and j) Cells were extracted by CSK (see Materials and methods), and then either methanol- (a, d, f, and h) or formalin-fixed (j). The enlargements on the bottom right of panels a, d, f, h, and j are magnifications of the centriole signals shown in the center. Scale bars: (a) 2 μm, (b) 100 nm, (d, f, h, and j) 10 μm in main panels, and (a, d, f, h, and j) 2 μm in inset magnifications. Data are presented as mean ± SD where error bars represent the SD. N = 3, n > 240 cells in total. Statistics were derived from two-tailed unpaired t test analysis of at least three biologically independent experiments. Each independent experiment repetition is represented with same color on different groups of graphs. Source data are provided in Data S1.
Figure S1.
Figure S1.
Genetically different CEP350−/− cell lines were created by CRISPR/Cas9 and CEP350 loss was verified by IF and WB. (a) Different combinations of sgRNA guides were cloned in pX458 and electroporated in RPE-1 TP53−/− and RPE-1 TP53+/+ cells. 48 h after electroporation, single cells were FACS-sorted in 96-well plates and grown clones were analyzed by mRNA extraction and following cDNA production to use in PCR screen. WT CEP350 gene (ENST00000367607.8) is represented with coding exons and all introns to illustrate the sgRNA guided double CRISPR cuts, and the coding CEP350 protein (CCDS1336) is shown. CEP350 protein is divided into N-terminus (1–899 aa), middle (900–2249 aa), and C-terminus (2250–3117 aa), which are used to analyze domain interactions of CEP350 in rescue and IP experiments (see Fig. 6). Yellow marked domains are shown as the most conserved CEP350 regions in different species analyzed by Clustal-Omega tool of European Molecular Biology Laboratory. Remaining peptide from mutated CEP350 gene is shown for CEP350−/− clone #6 in comparison to the WT CEP350 protein to illustrate cut-out region and consecutive frame shift (represented in dark blue), which later leads to a premature stop codon at the 291 aa. (b) The result of CEP350 protein conservation among its orthologs was represented by Jalview tool to demonstrate conserved aa sequences at the N-terminus of CEP350 protein (577–646 aa). (c) After mRNA extraction and cDNA conversion, the PCR product of CEP350−/− clone #6 was sequenced to represent the missing sequences in CEP350 gene in comparison to WT CEP350. In absence of CEP350 WT band, cells were analyzed by IF. (d) IF analysis of control and CEP350−/− (clone #6 and #7) cells with Centrin (green), CEP350 (red), and CEP164 (gray) antibodies. (e) Loss of CEP350 signal was quantified in control (CEP350 WT) cells and CEP350−/− clones (2 and 6% of control in clone #6 and #7, respectively). (f) Absence of CEP350 protein was verified by WB with indicated antibodies. GAPDH is used as the loading control. (g and h) IF images of cycling control cells and CEP350−/− cells fixed with methanol and stained for (g) CEP78 (green), Centrin (red), and DNA with DAPI (blue) or (h) Centrin (green), FOP (red), and DNA with DAPI (blue). (i and j) Quantifications of the CEP78 and FOP signals at centrioles from cells in g and h. The enlargements on the bottom right are magnifications of the centriole signals shown in the center, and each independent experiment repetition is represented with the same color in CEP350−/− and control cells in respective graphs. Scale bars: (a) 5,000 bp, (d) 2 μm in panel and 1 μm in magnifications, (g and h) 5 μm in main panels and 2 μm in inset magnifications. (e, i, and j) N = 3, n > 240 cells. Data are presented as mean ± SD where error bars represent the SD. Statistics were from two-tailed unpaired t test analysis of indicated numbers of biologically independent experiments. Source data are provided in Data S1. Source data are available for this figure: SourceData FS1.
Figure S2.
Figure S2.
siRNA depletion of CEP350 verifies the distal protein recruitment defects observed in CEP350−/− cells. (a–c) Control, CEP350−/−, and CEP350−/− cells complemented with CEP350 (CEP350−/− + CEP350) were CSK extracted, fixed, and stained for IF by (a) ODF2 (green), CEP350 (red), CEP164 (gray), and DAPI (blue); (b) CEP350 (green) OFD1 (red), and DAPI (blue); and (c) C2CD3 (green), CEP350 (red), and DAPI (blue). (d–g) Quantifications of ODF2 (d), CEP164 (e), OFD1 (f), and C2CD3 (g). Data are presented as mean ± SD where error bars represent the SD of N = 2, n > 100 cells in total. (h) Centrin (green), CPAP (red), and DAPI (blue) in control and CEP350−/− cells are shown. The enlargements on the left of or bottom right of main panels are magnifications of the centriole signals shown in the center. (i) Quantification of CPAP levels from panel h presented as mean ± SD where error bars represent the SD of N = 3, n > 240 cells in total. Each independent experimental repetition is represented with the same color in CEP350−/− and control cells. (j) Cycling control cells and CEP350−/− cells were CSK extracted, fixed with methanol, and stained for IF with indicated antibodies to show abnormal localization of centriolar distal end proteins (CP110, POC5, and Centrin) in CEP350−/− cells. Scale bars: (a, b, c, and h) 5 μm in main panels and 2 μm in inset magnifications, (j) 1 μm. (d, e, f, g, and i) Statistics were derived from two-tailed unpaired t test analysis of indicated numbers of biologically independent experiments. Source data are provided in Data S1.
Figure 2.
Figure 2.
CEP350 loss has no effect on the recruitment of proximal PCM proteins but distal-end centriole microtubule structures are defective. (a–c) IF images of cycling control cells and CEP350−/−cells. All cells were methanol fixed and stained with (a) Centrin (green), PCNT (red), and DAPI (blue); (b) GT335 for polyglutamylation (green), PCNT (red), and DAPI (blue); and (c) γ-tubulin (green), POC1B (red), and DAPI (blue). The enlargements on the bottom right are magnifications of the centriole signals shown in the center. (d–f) Quantifications of centriolar signals in panels a–c, respectively. (g) Electron micrographs of centrioles of control cells and CEP350−/− cells (clones #6 and #7) in cross and longitudinal sections. Two different cells (#1 and #2) are shown for each condition. The A-C linker was used to identify the end of centrioles. Microtubule damages are indicated by arrowheads in cross-sections (blue for missing triplets, red for missing doublets, and purple for missing singlets). Green arrowheads in the longitudinal sections of the control cells highlight the position of the distal and subdistal appendages. Ochre arrowheads indicate centriole microtubule defects in longitudinal sections of centrioles in CEP350−/− cells. (h) MT defects observed in centrioles in g were quantified (n = 5 for control, n = 21 for CEP350−/− clone #6, and n = 13 for CEP350−/− clone #7). Color of bars corresponds to arrowheads in g. (i) Longitudinal length analysis from centrioles in g of control and CEP350−/− clone #6 and clone #7 cells (n = 20 for control cells, n = 15 for clone #6, and n = 33 for clone #7). Data are presented as mean ± SD, where error bars represent the SD. (j) Fixed cells were expanded with an expansion factor of 4 for u-ExM and stained with CEP44 (green) and α-tubulin (red) antibodies. Proximal (P) and distal (D) directions are indicated by white arrows. All cells were CSK extracted. Scale bars: (a–c) 5 μm in main panels and 2 μm in inset magnifications, (g) 100 nm in cross-sections and 150 nm in longitudinal sections, (j) 500 nm. (d–f) Data are presented as mean ± SD of N = 3, n > 240 cells in total where error bars represent the SD. Statistics were derived from two-tail unpaired t test analysis of at least three biologically independent experiments. Each independent experiment repetition is represented with the same color on different groups of graphs. Source data are provided in Data S1.
Figure S3.
Figure S3.
Centrobin mainly localizes to middle-subdistal regions of centrioles, and its depletion prevents Centrin elongation in CEP350−/− cells. (a–d) CEP350 was siRNA depleted from RPE-1 TP53−/− cells for 72 h, and the cells were CSK extracted, methanol fixed, and stained for IF with (a) CEP350 (red), POC5 (green), and PCNT (green); (b) CEP78 (red) and Centrin (green); (c) CEP164 (red), Centrin (green), and CEP44 (red); and (d) WDR90 (green) and PCNT (red). Ochre arrowheads point towards the visibly elongated centrioles. (e–k) Quantifications of CEP350 (e), POC5 (f), PCNT (g), CEP78 (h), CEP164 (i), CEP44 (j), WDR90 (k) from panels a–d. Each independent experiment repetition is represented with the same color in siCEP350 and siNSC cells in respective graphs. (l) Control, CEP350−/−, and CEP350−/− complemented with CEP350 (CEP350−/− + CEP350) cells were CSK extracted, fixed, and stained for IF by Centrobin (green), CEP350 (red), and DAPI (blue). G1 cells with two centrosomes were classified as complete removal (two CEP350, one Centrobin signal), partial removal (two CEP350, one potent, and one faint Centrobin signal), and failed removal (two CEP350 and two potent Centrobin signals). (m) Quantification of cells from l showing complete removal (blue bars), partial removal (red bars), and failed removal (gray bars). N = 2 and n > 48 cells. (n and o) (n) Control and (o) CEP350−/− cells were CSK extracted, fixed, and expanded with an expansion factor of 4 for u-ExM. Samples were stained for Centrobin (red) and α-tubulin (gray). Scale bars: (a–d) 1 μm, (l) 5 μm in main panels and 2 μm in inset magnifications, (n and o) 100 nm. (e–k and m) Data are presented as mean ± SD, where error bars represent the SD. (e–k) N = 3, n > 240 cells. (m) N = 2, n > 48. Statistics was derived from two-tailed unpaired t test analysis of at indicated numbers of biologically independent experiments. Source data are provided in Data S1.
Figure 3.
Figure 3.
Subdistal appendage proteins play an important role in Centrobin removal. (a) IF images of cycling control cells and CEP350−/− cells fixed with methanol and stained with CEP97 (green), EdU (magenta), and Centrobin (red). The enlargements on the bottom right are magnifications of the centriole signals shown in the center. (b) G2/M phase control cells and CEP350−/−, ODF2−/−, CEP128−/−, NIN−/− cells were stained for Centrin (green), Centrobin (red), DAPI (blue) to analyze Centrobin removal defects. The 4:2 ratio of Centrin:Centrobin indicates Centrobin removal from both mother centrioles, 4:3 a partial removal failure, and 4:4 a complete removal defect. (c) Cells in panel b were quantified for 4:2, 4:3, and 4:4 Centrin:Centrobin ratios to indicate Centrobin removal defects in different cell lines (N = 3, n = 50 for each condition). (d and e) Control cells (d) and CEP350−/− cells (e) were treated for 72 h with the siNSC and siCentrobin siRNA. Cells were analyzed by thin section EM. Shown are two longitudinal sections (sec1 and sec2) through centrioles of three cells each for CEP350−/ and control. (f) Centrioles in panels d and e were quantified for longitudinal centriole lengths. n = 16 for siNSC in WT, n = 25 for siCentrobin in WT, n = 38 for siNSC in CEP350−/−, and n = 11 for siCentrobin in CEP350−/−. Scale bars: (a and b) 5 μm in main panels, 2 μm in inset magnifications, and (d and e) 150 nm. (c and f) Data are presented as mean ± SD where error bars represent the SD. Statistics were from multiple comparison of two-way ANOVA multiple comparison analysis of three independent experiments (c) or two-tailed unpaired t test analysis of single measurements (f). Source data are provided in Data S1.
Figure S4.
Figure S4.
Centriole core proteins extend together with elongating CEP350−/−. (a) Cartoon representation of subdistal appendage formation in control, ODF2−/−, CEP128−/−, NIN−/−, and CEP350−/− cells according to Chong et al. (2020). (b) EM micrographs form control, CEP350−/−, ODF2−/−, CEP128−/−, and NIN−/− are shown to visualize subdistal appendage structures (magenta arrowheads) and distal appendage structures (cyan arrowheads). (c) Cells where Centrobin was removed from one of the centrioles (4:3 Centrin:Centrobin) were analyzed with ODF2. (d) Quantification of ODF2 centriole signal in 4:3 Centrin:Centrobin cells. In 83% of cells, ODF2 was localized only on the Centrobin lacking centriole, and in 17% of cells, second mother centriole was also showing an ODF2 signal despite the presence of Centrobin. (e) Cells where Centrobin is removed from two of the centrioles (4:2 Centrin:Centrobin) were analyzed with ODF2 to show presence of ODF2 on Centrobin lacking centrioles. (f) Quantification of ODF2 centriole signal in 4:2 Centrin:Centrobin cells. All the Centrobin lacking centrioles showed ODF2 presence. (d and f) N = 2, n > 50. (g) Control and CEP350−/− cells were depleted of Centrobin with siRNA, and after 72 h cells were CSK extracted, methanol-fixed, and stained with Centrin (green), Centrobin (red), and DNA with DAPI (blue). (h and i) Centrin signals were quantified from panel g with N = 3, n > 240 cells. Each independent experimental repetition is represented with the same color in CEP350−/− and control cells in respective graphs (h and i). Scale bars: (c, e, and g) 5 μm in main panels and 2 μm in inset magnifications, (b) 150 nm. Data are presented as mean ± SD where error bars represent the SD. Statistics was derived from two-tailed unpaired t test analysis of indicated numbers of biologically independent experiments. Source data are provided in Data S1.
Figure 4.
Figure 4.
WDR90 recruitment to centriole wall is defected in CEP350−/− cells. (a, c, and f) Control cells and CEP350−/− cells are methanol fixed and stained for IF with (a) γ-tubulin (green) and WDR90 (red); (c) Centrin (green) and FAM161A (red); and (f) Centrin (green) and POC5 (red). DNA was stained with DAPI. The enlargements on the bottom right are magnifications of the centriole signals shown in the center. (b, d, e, and g) Quantifications of centriolar signals of panels a, c, and f. N = 3, n > 240 cells. Data are presented as mean ± SD where error bars represent the SD. Each independent experiment repetition is represented with the same color on different groups of graphs. Statistics were derived from two-tailed unpaired t test analysis of at least three biologically independent experiments. (h–j) Control cells and CEP350−/− cells were fixed, expanded with an expansion factor of 4 for u-ExM, and stained with (h) α-tubulin (gray) and WDR90 (red); (i) α-tubulin (gray) and FAM161A (red); and (j) α-tubulin (gray) and POC5 (red). All cells were CSK extracted. Scale bars: (a, c, and f) 5 μm in main panels and 2 μm in inset magnifications, (h–j) 100 nm. Source data are provided in Data S1.
Figure S5.
Figure S5.
CEP350−/− centrioles do not overelongate in their first cell cycle. (a–d) CEP350−/− and WDR90 complemented CEP350−/− (CEP350−/− + GFP-HA-WDR90) cells were CSK extracted, fixed and stained for IF by GFP (green), HA (red), and PCNT (gray; a and c), or expanded by a factor of 4 and stained for u-ExM with α-tubulin (gray) and GFP (green) to observe centriolar microtubules (b and d). (e) Centriole MT loss within each centriole was calculated by the length of the longest MT, minus the length of the shortest MT and then divided by the length of the longest MT. (f) Centriole MT loss within centrioles was quantified (n = 45 for CEP350−/− cells, n = 28 for CEP350−/− + GFP-HA-WDR90). Average MT loss was found as 40% for CEP350−/− cells and 14% for CEP350−/− + GFP-HA-WDR90 cells. (g) Average MT length of CEP350−/− and WDR90 complemented sCEP350−/− (CEP350−/− + GFP-HA-WDR90) cells was quantified as 631 nm in CEP350−/− cells and 789 nm in CEP350−/− + GFP-HA-WDR90 cells. (h) Control cells and CEP350−/− cells were CSK extracted, fixed, and expanded with an expansion factor of 4 and stained for u-ExM with antibodies of Centrin (red), POC5 (red), and FAM161A (red). The centriole wall was stained with α-tubulin (gray). The ochre arrowhead shows the peeling off of centriolar microtubule filaments from centrioles. (i) CEP350−/− and OFD1 complemented CEP350−/− (CEP350−/− + GFP-HA-OFD1) cells were CSK extracted, fixed, and stained for IF by GFP (green), HA (red), and PCNT (gray). (j) CEP350−/− and OFD1 complemented CEP350−/− (CEP350−/− + GFP-HA-OFD1) cells were also CSK extracted, fixed, and expanded by a factor of 4 and stained for u-ExM with α-tubulin (gray) and GFP (green) to observe centriolar MTs. (k) Centriole MT loss within centrioles was quantified (n = 45 for CEP350−/− cells, n = 38 for CEP350−/− + GFP-HA-OFD1). (l) Average MT length of CEP350−/− and OFD1 complemented CEP350−/− (CEP350−/− + GFP-HA-OFD1) cells was quantified as 631 nm in CEP350−/− cells and 600 nm for CEP350−/− + GFP-HA-OFD1 cells. Scale bars: (a, c, and i) 10 μm in main panels and 2 μm in inset magnifications, (b, d, and j) 400 nm, (h) 500 nm. Data are presented as mean ± SD where error bars represent the SD. Statistics was derived from two-tailed unpaired t test analysis of indicated numbers of single quantifications. Source data are provided in Data S1.
Figure 5.
Figure 5.
CEP350/FOP complex interacts with WDR90 and OFD1 to ensure centriole stability and length control. (a and b) Cycling control cells were fixed, expanded with an expansion factor of 4 and stained for u-ExM with (a) α-tubulin (gray) and CEP350 (red) and (b) α-tubulin (gray) and FOP (red). (c) Quantification of tubulin (centriole wall), CEP350, and FOP signal diameters (n = 57 for tubulin, n = 38 for CEP350, and n = 19 for FOP signal diameter quantification) presented as mean ± SD where error bars represent the SD. (d) 2xHA-WDR90 was co-expressed with 2xFlag-CEP350-GFP, 2xFlag-FOP-GFP, and 2xFlag-GFP in HEK293T cells with transient transfection. Agarose GFP-Trap beads were used as baits and the presence of WDR90 was checked together with indicated proteins by IB using the indicated antibodies. Represented results are from three independent experiments. Asterisks indicate the endogenous CEP350 protein. (e) Protein interactions of CEP350/FOP complex based on co-IP experiments in d. All imaged cells were CSK extracted. Scale bars: (a and b) 100 nm. (c) Statistics were from two-tailed unpaired t test of single measurements. Source data are provided in Data S1. Source data are available for this figure: SourceData F5.
Figure 6.
Figure 6.
CEP350 N-terminus is sufficient to rescue centriole length control by recruiting CEP78 and FOP to CEP350−/− centrioles. (a) siCEP350-treated cells were complemented with siRNA-resistant CEP350 N-terminus (NT350-Flag), middle region (Mid350-Flag), and C-terminus (CT350-Flag) and stained with POC5 (red) and Flag (green). All imaged cells were CSK extracted. (b) Quantification of POC5 signal intensity at centrioles from a. N = 6, n > 50 cells for each condition. (c and d) FOP-GFP and GFP plasmids were coexpressed with (c) 2xFlag-CEP350-C-term and (d) 2xFlag-CEP350-N-term in HEK293T cells with transient transfection. Agarose GFP-Trap beads were used as baits and the presence of CEP350-C-terminus and CEP350-N-terminus was analyzed with anti-Flag antibodies. (e and f) (e) 2xFlag-CEP350-N-term, 2xFlag-CEP350-C-term, and (f) FOP-GFP and GFP were coexpressed with 2xHA-CEP78 in HEK293T cells with transient transfection. M2 flag beads and GFP trap beads were used as baits and the presence of CEP78 was checked with anti-HA antibodies. GAPDH was used as a loading control for input lanes in c–f. Asterisks indicate the unspecific bands of the stated antibodies. (g and h) (g) CEP350−/− cells and (h) CEP350−/− cells with overexpressed NT-CEP350 were CSK extracted, methanol-fixed, and stained for IF with the indicated antibodies. DNA was stained with DAPI. The enlargements on the bottom right are magnifications of the centriole signals shown in the center. (i and j) Cells represented in panels g and h were quantified for signal intensities. Data are presented as mean ± SD of N = 2, n > 100 cells in total where error bars represent the SD. Statistics were derived from two-tailed unpaired t test analysis of at least two biologically independent experiments. Each independent experiment repetition is represented with the same color on different groups of graphs. (a, g, and h) Scale bars: 5 μm in main panels and 2 μm in inset magnifications. (k) A model of protein interactions identified in c–f are represented. Source data are provided in Data S1. Source data are available for this figure: SourceData F6.
Figure 7.
Figure 7.
Centriole length and stability are independent factors. (a–d) Cycling control cells were treated with indicated siRNAs to observe centriole elongation with IF and u-ExM. (a) siCEP78-treated cells were stained with Centrin (green) and CEP78 (red) and then analyzed by IF. (b) siOFD1-treated cells were stained with Centrin (green) and OFD1 (red) and then analyzed by IF. (c and d) Cells from panels a and b were fixed, expanded with an expansion factor of 4 for u-ExM, and stained with α-tubulin (gray). (e) Centriole length of siCEP78 and siOFD1 from u-ExM images represented in c and d was measured. (f) Relative length differences of centriole microtubules in c and d. Relative length difference was calculated as indicated in Fig. S5 e. (e and f) n = 14 for siNSC, n = 10 for siCEP78, and n = 12 for siOFD1. (g and j) The cells from a and b were stained for IF WDR90 (green) and Centrin (red). (h, i, k, and l) Levels of WDR90 (h and k), CEP78 (i), and OFD1 (l) were quantified. N = 3, n > 240 cells. All cells were extracted by CSK. (a, b, g, and j) The enlargements on the bottom right are magnifications of the centriole signals shown in the center. Scale bars: (a, b, g, and j) 5 μm in main panels and 2 μm in inset magnifications, (c and d) 100 nm. (e, f, h, i, k, and l) Data are presented as mean ± SD where error bars represent the SD. (e and f) From one experiment. (h, i, k, and l) N = 3, n > 240 cells. Statistics were from two-tailed unpaired t test analysis of single measurements or three independent experiments. Each independent experiment repetition is represented with the same color on different groups of graphs. Source data are provided in Data S1.
Figure 8.
Figure 8.
CEP350−/− centrioles do not overelongate in their first cell cycle. (a) Control and CEP350−/− cells were fixed and expended by a factor of 4 and stained for u-ExM with α-tubulin (gray) to follow daughter centriole elongation. Green asterisks indicate the daughter centrioles. (b) Relative length differences within centrioles represented in panel a were measured (n = 11 for control and n = 15 for CEP350−/− cells) as outlined in Fig. S5 e. Data are presented as mean ± SD where error bars represent the SD. The statistic is from two-tailed unpaired t test analysis of indicated numbers of single measurements. (c) Electron micrographs of control and CEP350−/− centrioles were shown. Daughter centrioles were indicated with green asterisks, and defects on mother centrioles are indicated by ochre arrowheads. (d) Control and CEP350−/− cells were treated with Centrinone for 4 d. Centrinone was washed out after. 14 h after the washout, cells were methanol fixed for IF by Centrin (green) and Sas6 (red) in order to identify de novo centrioles (1:1 Centrin:Sas6 centrioles). (e) De novo centrioles were counted for elongated Centrin phenotype in control and CEP350−/− cells. n = 125 for control and n = 152 for CEP350−/− cells. Scale bars: (a) 100 nm, (c) 150 nm, and (d) 2 μm in main panels and 2 μm in inset magnifications. Source data are provided in Data S1.
Figure 9.
Figure 9.
Centriole elongation block after mitosis is defective in CEP350−/− cells. (a) Cycling control and CEP350−/− cells were fixed and stained for POC5 (red) and Centrin (green) antibodies. G2 cells were selected according to POC5 recruitment to daughter centrioles (weaker Centrin and POC5 signals). The images on the right-hand side are enlargements of the boxed areas in the main image numbered 1 and 2. (b) Control cells and CEP350−/− cells were treated with DMSO (solvent control) and 100 nM Palbociclib for 16 h. After 16 h, cells are fixed, expanded with an expansion factor of 4, and stained for u-ExM with α-tubulin. (c) Longitudinal length of centrioles from panel b was measured. n = 40 for control DMSO, n = 49 for control Palbociclib, n = 40 for CEP350−/− DMSO, and n = 46 for CEP350−/− Palbociclib. (d) G1 arrested control cells and CEP350−/− cells were methanol-fixed and stained for IF with POC5 (green), Centrin (red), and PCNT (gray). The enlargements on the bottom right are magnifications of the centriole signals shown in the center. (e) Quantification of d. Centrin and POC5 signal lengths that were observed in panel d were measured for each cell. n = 72 cells in DMSO control and n = 75 cells in Palbociclib treatment. MC, mother centriole; DC, daughter centriole. (f) Average length of mother centriole and daughter centriole from panel e is shown above the centriole cartoons. (g) A model for CEP350 driven centriole length and stability mechanisms is shown. Scale bars: (a) 5 and 1 μm in inset magnifications, (b) 100 nm, (d) 2 and 2 μm in inset magnifications. (c and e) Data are presented as mean ± SD where error bars represent the SD. Statistics were from two-tailed unpaired t test analysis of indicated numbers of biologically single measurements. Source data are provided in Data S1.

Similar articles

Cited by

References

    1. Arquint, C., and Nigg E.A.. 2014. Stil microcephaly mutations interfere with APC/C-mediated degradation and cause centriole amplification. Curr. Biol. 24:351–360. 10.1016/j.cub.2013.12.016 - DOI - PubMed
    1. Atorino, E.S., Hata S., Funaya C., Neuner A., and Schiebel E.. 2020. CEP44 ensures the formation of bona fide centriole wall, a requirement for the centriole-to-centrosome conversion. Nat. Commun. 11:903. 10.1038/s41467-020-14767-2 - DOI - PMC - PubMed
    1. Azimzadeh, J., Hergert P., Delouvée A., Euteneuer U., Formstecher E., Khodjakov A., and Bornens M.. 2009. hPOC5 is a centrin-binding protein required for assembly of full-length centrioles. J. Cell Biol. 185:101–114. 10.1083/jcb.200808082 - DOI - PMC - PubMed
    1. Blomen, V.A., Májek P., Jae L.T., Bigenzahn J.W., Nieuwenhuis J., Staring J., Sacco R., Van Diemen F.R., Olk N., Stukalov A., et al. . 2015. Gene essentiality and synthetic lethality in haploid human cells. Science. 350:1092–1096. 10.1126/science.aac7557 - DOI - PubMed
    1. Bornens, M. 2002. Centrosome composition and microtubule anchoring mechanisms. Curr. Opin. Cell Biol. 14:25–34. 10.1016/s0955-0674(01)00290-3 - DOI - PubMed

Publication types

MeSH terms