. 2023 Jan 2;220(1):e20220679.
doi: 10.1084/jem.20220679. Epub 2022 Oct 31.

Clonal lineage tracing reveals mechanisms skewing CD8+ T cell fate decisions in chronic infection

Affiliations

Clonal lineage tracing reveals mechanisms skewing CD8+ T cell fate decisions in chronic infection

Moujtaba Y Kasmani et al. J Exp Med. .

Abstract

Although recent evidence demonstrates heterogeneity among CD8+ T cells during chronic infection, developmental relationships and mechanisms underlying their fate decisions remain incompletely understood. Using single-cell RNA and TCR sequencing, we traced the clonal expansion and differentiation of CD8+ T cells during chronic LCMV infection. We identified immense clonal and phenotypic diversity, including a subset termed intermediate cells. Trajectory analyses and infection models showed intermediate cells arise from progenitor cells before bifurcating into terminal effector and exhausted subsets. Genetic ablation experiments identified that type I IFN drives exhaustion through an IRF7-dependent mechanism, possibly through an IFN-stimulated subset bridging progenitor and exhausted cells. Conversely, Zeb2 was critical for generating effector cells. Intriguingly, some T cell clones exhibited lineage bias. Mechanistically, we identified that TCR avidity correlates with an exhausted fate, whereas SHP-1 selectively restricts low-avidity effector cell accumulation. Thus, our work elucidates novel mechanisms underlying CD8+ T cell fate determination during persistent infection and suggests two potential pathways leading to exhaustion.


Conflict of interest statement

Disclosures: S.M. Kaech reported personal fees from EvolveImmune Therapeutics, Affini-T Therapeutics, Arvinas, Pfizer, and Barer Institute outside the submitted work. No other disclosures were reported.

Figures

None
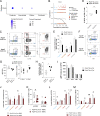
Graphical abstract
Figure 1.
Figure 1.
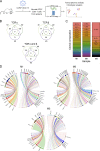
scTCR-seq reveals clonal heterogeneity among LCMV GP33-specific CD8+ T cells. (A) Experimental design for scRNA-seq and scTCR-seq following chronic infection with LCMV Clone 13. (B) Venn diagrams showing overlap among samples of CDR3 nucleotide sequences for the TCR α chain, β chain, or paired α and β chains. (C) Bar plot showing percentage breakdown of the 50 largest clones per sample, each with at least two constituent cells. (D) Chord diagrams showing V and J gene pairings for TCR α and β chains per sample. Each band represents one unique V-J pair, with band thickness corresponding to the number of instances of that pair. For visual clarity, frequencies are only shown for TCR genes used by at least 10% of cells and gene names are only shown for TCR genes used by at least 3% of cells.
Figure 2.
Figure 2.
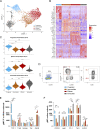
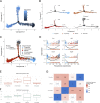
scRNA-seq defines a unique transcriptional state that may represent transitioning CD8+ T cells during chronic viral infection. (A) UMAP plot of splenic GP33+ CD8+ T cells from four mice on days 28, 33, 33, and 35 after LCMV Clone 13 infection. Each dot represents one cell, cells are colored by cluster identity. (B) Heatmap of the top 10 differentially expressed genes per cluster. (C) Violin plots of module scores based on the top 100 differentially expressed genes in the progenitor, effector, and exhausted clusters as published in Zander et al. (2019). (D) Representative flow plots of splenic GP33+CD44+CD8+ T cell subsets using the markers CX3CR1, Ly108, and CXCR6. Cells were harvested on day 30 p.i. (E) Summary data of D showing relative expression of TFs and effector molecules among the subsets. (F) As in E but showing the relative expression of surface molecules. gMFI, geometric MFI. Data (mean ± SEM) in E and F are from three to six mice and are representative of at least three independent experiments. * P < 0.05, ** P < 0.01, *** P < 0.001. See also Fig. S1.
Figure S1.
Figure S1.
Characterization of antigen-specific CD8+ T cell subsets in chronic viral infection. Related to Fig. 2. (A) UMAP plot as in Fig. 2 A but with higher computational resolution to allow for visualization of five, rather than four, CD8+ T cell subsets. (B) Dot plot showing expression of genes stimulated by type I IFN signaling in CD8+ T cell scRNA-seq data. (C) Representative flow plot showing staining of the IFN-induced protein BST2 in antigen-experienced (PD-1hi) CD8+ T cells. (D) Violin plot showing transcript expression of Cxcr6. (E) Frequency of CD107a+ IFNγ+ CD8+ T cells in each subset upon ex vivo stimulation with GP33 peptide. (F) Line graphs showing frequencies (left) and numbers (right) of GP33-specific CD8+ T cell subsets at different timepoints after LCMV Clone 13 infection. (G and H) Representative flow plots (G) and quantification of cell surface PD-1 MFI (H) in subsets of TCR transgenic P14 CD8+ T cells on days 15 and 21 p.i. (I–K) Representative flow plots (I) and inhibitory receptor MFI on subsets of GP276-specific (J) and NP396-specific (K) CD8+ T cells on day 21 after LCMV Clone 13 infection. Data (mean ± SEM) in E are from three mice per experiment and are pooled from three independent experiments. Data (mean ± SEM) in F are from six to nine mice per timepoint and are pooled from three independent experiments. Data (mean ± SEM) in H are from five P14 chimeric mice per timepoint and are representative of three independent experiments. Data (mean ± SEM) in J and K are from three mice per group and are representative of three independent experiments. * P < 0.05, ** P < 0.01, *** P < 0.001. gMFI, geometric MFI.
Figure 3.
Figure 3.
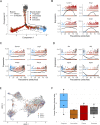
Trajectory and clonotypic analyses support the transitional nature of intermediate cells and CD8+ T cell clonal multipotency. (A) Monocle tree trajectory plot showing predicted cellular differentiation based on trajectory analysis. Cells are colored by Seurat cluster. (B–D) Plots showing effector (B), exhausted (C), and IFN-stimulated (D) gene expression over pseudotime. Dashed and solid lines denote transition from the progenitor to the effector or exhausted Monocle state, respectively. Colors denote the Seurat cluster identity of each cell. (E) UMAP plot as in Fig. 2 A but colored by clone membership. Three representative clones shown. (F) Inverse Simpson diversity index calculated for clones in each cluster. Only clones with some, but not all, constituent cells in the progenitor cluster were included. Higher values indicate more clonal diversity. See also Fig. S2.
Figure S2.
Figure S2.
Cellular and clonal trajectory analyses of CD8+ T cell subsets. Related to Fig. 3. (A) Monocle tree trajectory as in Fig. 3 A but colored according to pseudotime. (B) Monocle tree trajectory as in Fig. 3 A but split by Seurat cluster for ease of viewing. Percentages show proportion of each Seurat phenotype spread among the three Monocle branches. (C) Monocle tree trajectory as in Fig. 3 A but colored by five, rather than four, CD8+ T cell subsets. (D) Monocle pseudotime expression of type I IFN–stimulated genes as in Fig. 3 D but colored by five Seurat subsets. (E) STARTRAC Expansion Index calculated on a clonal level and grouped by Seurat cluster. Higher scores indicate increased clonal expansion. (F) As in C but using the STARTRAC Transition Index. Higher scores indicate increased potential of phenotypic transition. (G) Pairwise STARTRAC Transition Index. Higher scores indicate increased potential of intercluster transition between the two clusters indicated.
Figure 4.
Figure 4.
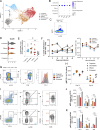
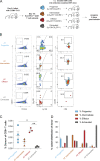
The intermediate population can give rise to both effector and exhausted CD8+ T cells in vivo. (A) Experimental design. (B) Representative flow plots showing the proportion of recovered donor cells in the spleen, and their respective phenotypes, following adoptive transfer (AT). (C) Summary data showing the proportion of donor-derived cells in the spleen. (D) Summary data showing the percentage subset distribution of donor-derived cells at 8 d after adoptive transfer. Data (mean ± SEM) in C and D are from three to four mice per group and are representative of two independent experiments. * P < 0.05, ** P < 0.01.
Figure S3.
Figure S3.
Impact of type I IFN signaling and expression of the TF IRF7 on CD8+ T cell differentiation. Related to Fig. 5. (A) Violin plot showing module scores of IFN signaling. (B) Representative flow plots of GP33+ CD44+ CD8+ T cell subsets collected from blood on day 24 p.i. with LCMV Clone 13. Mice were given either vehicle control (top) or Poly (I:C) (bottom). (C) Summary of frequency of GP33 antigen-specific CD8+ T cells in the spleens of control mice or mice given Poly (I:C). (D) Subset distribution of GP33 antigen-specific CD8+ T cells in the spleens of control mice or mice given Poly (I:C). (E) Subset distribution frequencies of GP33 antigen-specific CD8+ T cells in the blood of control mice or mice given Poly (I:C). (F) Summary of the ratio in MFI of T-bet to Eomes in GP33-specific CD8+ T cells from control and Poly (I:C)–treated mice. (G) Frequency of splenic CD107a+ IFNγ+ CD8+ T cells upon ex vivo stimulation with GP33 peptide. (H) Feature plots depicting SCENIC regulon activity of Stat1, Stat2, Irf9, and Irf7 regulons in CD8+ T cell subsets. (I) Summary data showing the relative expression of co-inhibitory receptors on GP33+ CD8+ T cells from the spleens of WT mice or Irf7−/− mice. Data (mean ± SEM) in C–G are from three to four mice per group and are pooled from two independent experiments. Data (mean ± SEM) in I are from four mice per group and are representative of two independent experiments. * P < 0.05, ** P < 0.01, *** P < 0.001. gMFI, geometric MFI.
Figure 5.
Figure 5.
Type I IFN–induced IRF7 is intrinsically required for differentiation of exhausted CD8+ T cells. (A) Experimental design for type I IFN signaling studies using Poly (I:C). (B and C) Representative flow plots (B) and quantified subset distribution frequencies (C) of GP33 antigen-specific CD8+ T cells in the spleens of control mice or mice given Poly (I:C). (D) Experimental design for IRF7−/− MBM chimera experiments. (E and F) Representative flow plots (E) and summary data (F) showing the subset distribution of WT and IRF7−/− CD8 T cells. (G) Summary depicting the ratio in geometric MFI (gMFI) of T-bet to Eomes in WT and IRF7−/− GP33-specific CD8+ T cells. (H) Frequency of CD107a+ IFNγ+ CD8+ T cells upon ex vivo stimulation with GP33 peptide. Data (mean ± SEM) in B and C are from three to four mice per group and are pooled from two independent experiments. Data (mean ± SEM) in E–H are from four mice per group and are representative of two independent experiments. * P < 0.05, ** P < 0.01, *** P < 0.001. See also Fig. S3.
Figure 6.
Figure 6.
The TF Zeb2 is intrinsically required for differentiation of effector CD8+ T cells. (A and B) Representative flow plots (A) and summary data(B) showing the frequencies of GP33/GP276 antigen-specific CD8+ T cell subsets collected from spleens of WT (Zeb2flox/flox GzB-Cre) or Zeb2 cKO (Zeb2flox/flox GzB-Cre+) mice on day 30 p.i. with LCMV Clone 13. (C and D) Representative flow plots (C) and summary data (D) showing the proportion of Zeb2+/+ and Zeb2−/− P14 CD8+ T cells with a progenitor, intermediate, effector, or exhausted phenotype. P14 cells were adoptively transferred 1 d before LCMV Clone 13 infection and analyzed 18 d p.i. Data (mean ± SEM) in B are from three mice per group and are representative of two independent experiments. Data (mean ± SEM) in D are from five mice per group and are representative of two independent experiments. * P < 0.05, ** P < 0.01, *** P < 0.001.
Figure S4.
Figure S4.
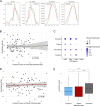
TCR quantitative affinity and quantitative avidity. Related to Fig. 7. (A) TCRdist analysis of CDR3 amino acid sequences of CD8 T cell clones. len, length; charge, amino acid charge; hydro, hydrophobicity. (B) Linear regression between quantitative affinity and percent of cells per clone in the exhausted Monocle state. Each point represents one clone. Gray shaded region, 95% confidence interval. (C) Dot plot showing expression of CD3 genes per cluster. Dot size, percent of cells expressing the gene; color, scaled expression. (D) As in B but with the percent of cells per clone in the effector Monocle state. (E) Box plot of quantitative avidity calculated on a per cell basis and grouped by Seurat cluster. Each box shows the lower quartile, median, and upper quartile. Whiskers span 1.5× interquartile range. * P < 0.05, *** P < 0.001.
Figure 7.
Figure 7.
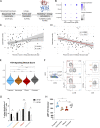
TCR:pMHC quantitative avidity correlates with phenotypic skewing of CD8+ T cell clones. (A) Diagram of TCR modeling workflow. (B) Dot plot showing TCR constant chain gene expression per cluster. Dot size, percent of cells expressing each gene; color, scaled expression. (C) Linear regression between quantitative avidity and percent of cells per clone in the exhausted Monocle state. Each point represents one clone. Gray shaded region, 95% confidence interval. (D) As in C but with the percent of cells per clone in the effector Monocle state. (E) Violin plot of TCR signaling module scores calculated using a published gene set (KEGG hsa04660). Horizontal black lines denote mean values. (F and G) Representative flow plots (F) and summary data (G) showing subset distributions of GP33hi (high avidity) and GP33lo (low avidity) splenic CD8+ T cells harvested 30 d p.i. with LCMV Clone 13. (H) Quantification of GP33 MFI in subsets from F. Data (mean ± SEM) in G and H are from four mice and are representative of at least four independent experiments. * P < 0.05, ** P < 0.01, *** P < 0.001. gMFI, geometric MFI. See also Fig. S4.
Figure S5.
Figure S5.
SHP-1 expression and impact on CD8+ T cell fate decisions. Related to Fig. 8. (A) Dot plot showing gene expression of Ptpn6 (encodes SHP-1) among CD8+ T cell clusters. (B) Gene expression of Ptpn6 over pseudotime. Dashed and solid lines denote transition from the progenitor to the effector or exhausted Monocle state, respectively. Colors denote the Seurat cluster identity of each cell. (C) Representative flow plots of splenic CD8+ T cells harvested from Ptpn6flox/flox dLck-Cre or Ptpn6flox/flox dLck-Cre+ mice 28 d p.i. with LCMV Clone 13. (D) Summary of frequency of GP33+ splenic CD8+ T cells in C. (E) Quantification of subset proportions from C. (F) Representative flow plots of splenic CD8+ T cells gated by GP33hi and GP33lo populations. (G) Summary of GP33 mean MFI (left) and frequency of GP33hi and GP33lo CD8+ T cells (right) in F. (H) Frequency of CD107a+ IFNγ+ CD8+ T cells upon ex vivo stimulation with GP33 peptide. (I) Summary of MFI of surface markers on GP33+ CD8+ T cells. (J) Summary of absolute numbers of GP33+ CD8+ T cell subsets. (K) Summary of frequency of GP276+ and NP396+ splenic CD8+ T cells. (L) Quantification of subset proportions of GP276+ splenic CD8+ T cells. (M) As in L, but with NP396+ splenic CD8+ T cells. Data (mean ± SEM) in D, E, and G–I are from three mice per group and are representative of two independent experiments. Data (mean ± SEM) in J–M are from five mice per group and are pooled from two independent experiments. One data point was excluded as its value was >2.5 SDs from the mean. * P < 0.05, ** P < 0.01. gMFI, geometric MFI.
Figure 8.
Figure 8.
SHP-1 intrinsically maintains progenitor CD8+ T cell quiescence and limits effector cell differentiation. (A) Linear regression between quantitative avidity and expression of Ptpn6 (encodes SHP-1). Gray shaded region, 95% confidence interval. Each point denotes one cell. Cells with 0 reads of Trac, Trbc1, Trbc2, or Ptpn6 were excluded. (B) Experimental design for SHP-1 MBM chimera studies. (C) Representative flow plots of splenic CD8+ T cells harvested from Ptpn6flox/flox dLck-Cre or Ptpn6flox/flox dLck-Cre+ MBM chimera mice. (D) Summary of frequency of GP33+ splenic CD8+ T cells in C. (E) Summary of frequency of GP33hi and GP33lo CD8+ T cells in C. (F) Quantification of subset proportions from C. (G) Frequency of TNFα+ IFNγ+ CD8+ T cells upon ex vivo stimulation with GP33 peptide. Data (mean ± SEM) in D–G are from five mice per group and are pooled from two independent experiments. * P < 0.05, ** P < 0.01. See also Fig. S5.
Figure 9.
Figure 9.
Model of CD8+ T cell differentiation during chronic viral infection. (A) Five subset bifurcative model of CD8+ T cell differentiation during chronic viral infection. Various signaling pathways and transcription factors affect CD8+ T cell quiescence, differentiation, and fate decisions. Some data indicate the existence of an IFN-stimulated subset that acts as a direct transition state between progenitor and exhausted cells.

References

    1. Ahmadzadeh, M., Johnson L.A., Heemskerk B., Wunderlich J.R., Dudley M.E., White D.E., and Rosenberg S.A.. 2009. Tumor antigen-specific CD8 T cells infiltrating the tumor express high levels of PD-1 and are functionally impaired. Blood. 114:1537–1544. 10.1182/blood-2008-12-195792 - DOI - PMC - PubMed
    1. Alfei, F., Kanev K., Hofmann M., Wu M., Ghoneim H.E., Roelli P., Utzschneider D.T., von Hoesslin M., Cullen J.G., Fan Y., et al. . 2019. TOX reinforces the phenotype and longevity of exhausted T cells in chronic viral infection. Nature. 571:265–269. 10.1038/s41586-019-1326-9 - DOI - PubMed
    1. Alford, R.F., Leaver-Fay A., Jeliazkov J.R., O’Meara M.J., DiMaio F.P., Park H., Shapovalov M.V., Renfrew P.D., Mulligan V.K., Kappel K., et al. . 2017. The Rosetta all-atom energy function for macromolecular modeling and design. J. Chem. Theor. Comput. 13:3031–3048. 10.1021/acs.jctc.7b00125 - DOI - PMC - PubMed
    1. Allard, M., Couturaud B., Carretero-Iglesia L., Duong M.N., Schmidt J., Monnot G.C., Romero P., Speiser D.E., Hebeisen M., and Rufer N.. 2017. TCR-ligand dissociation rate is a robust and stable biomarker of CD8+ T cell potency. JCI Insight. 2:e92570. 10.1172/jci.insight.92570 - DOI - PMC - PubMed
    1. Barber, D.L., Wherry E.J., Masopust D., Zhu B., Allison J.P., Sharpe A.H., Freeman G.J., and Ahmed R.. 2006. Restoring function in exhausted CD8 T cells during chronic viral infection. Nature. 439:682–687. 10.1038/nature04444 - DOI - PubMed

Publication types

Substances