. 2022 Oct 3;63(11):28.
doi: 10.1167/iovs.63.11.28.

Bioinformatics Analysis and Experimental Identification of Immune-Related Genes and Immune Cells in the Progression of Retinoblastoma

Affiliations

Bioinformatics Analysis and Experimental Identification of Immune-Related Genes and Immune Cells in the Progression of Retinoblastoma

Shuilian Chen et al. Invest Ophthalmol Vis Sci. .

Abstract

Purpose: Retinoblastoma (RB) is the most common type of aggressive intraocular malignancy in children. The alteration of immunity during RB progression and invasion has not yet been well defined. This study investigated significantly altered immune-associated genes and cells related to RB invasion.

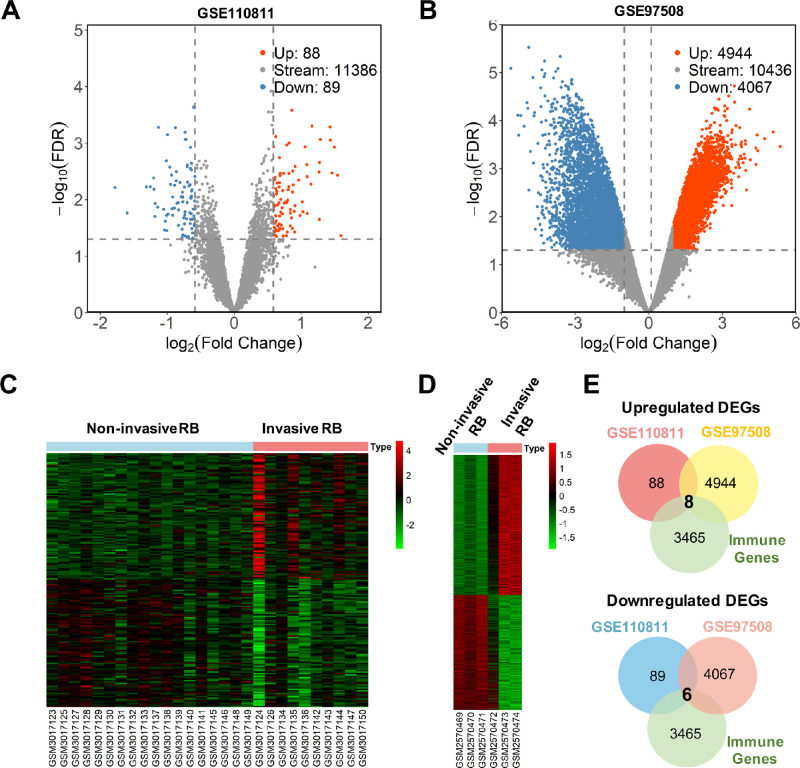
Methods: The differentially expressed immune-related genes (IRGs) in noninvasive RB and invasive RB were identified by analysis of two microarray datasets (GSE97508 and GSE110811). Hub IRGs were further identified by real time PCR. The single-sample gene set enrichment analysis algorithm and Pearson correlation analysis were used to define immune cell infiltration and the relationships between hub IRGs and immune cells. Cell viability and migration were evaluated by CCK-8 and Transwell assays. A xenograft mouse model was used to verify the relationship between Src homology 3 (SH3) domain GRB2-like 2 (SH3GL2) expression and myeloid-derived suppressor cells (MDSCs).

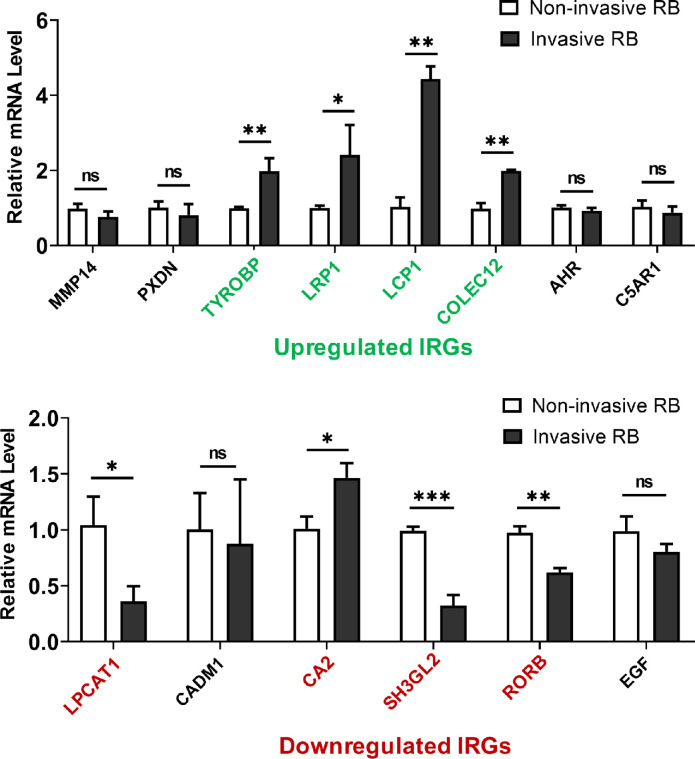
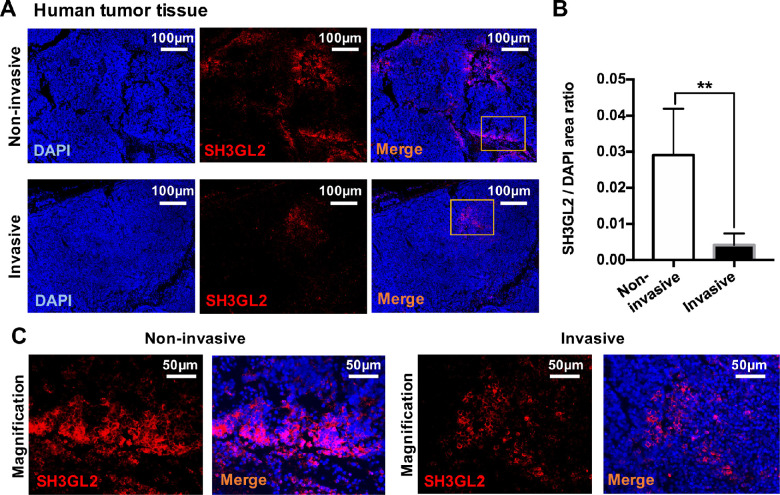
Results: Eight upregulated genes and six downregulated IRGs were identified in invasive RB. Seven IRGs were confirmed by real-time PCR. Moreover, the proportions of MDSCs were higher in invasive RB tissues than in noninvasive RB tissues. Furthermore, correlation analysis of altered immune genes and cells suggested that SH3GL2, Langerhans cell protein 1 (LCP1) and transmembrane immune signaling adaptor TYROBP have strong connections with MDSCs. Specifically, decreased SH3GL2 expression promoted the migration of RB cells in vitro, increased the tumor size and weight, and increased the numbers of MDSCs in the tumor and spleen in vivo.

Conclusions: This study indicated that SH3GL2 and MDSCs play a critical role in RB progression and invasion and provide candidate targets for the treatment of RB.


Conflict of interest statement

Disclosure: S. Chen, None; X. Chen, None; P. Zhang, None; S. Chen, None; X. Wang, None; Q. Luo, None; Z. Cui, None; Y. Huang, None; L. Wan, None; X. Hou, None; H. Yao, None; X. Liu, None; A. He, None; Z. Jiang, None; J. Qiu, None; Y. Li, None; K. Yu, None; J. Zhuang, None

Figures

Figure 1.
Figure 1.
Schematic representation of the study protocol. The workflow consisted of exploring altered immune-associated genes and immune infiltrating cells and analyzing their relationship during RB development.
Figure 2.
Figure 2.
Screening and identification of differentially expressed IRGs. (A) Volcano plot of DEGs among invasive RB samples and noninvasive controls from the GSE110811 dataset; (B) Volcano plot of DEGs among invasive RB samples and noninvasive controls from the GSE97508 dataset; (C) Heatmap of DEGs from the GSE110811 dataset; (D) Heatmap of DEGs from the GSE97508 dataset; (E) Venn diagrams of overlapping DEGs from two datasets and IRGs derived from the AmiGO2 and KEGG databases.
Figure 3.
Figure 3.
Validation of differentially expressed IRGs in the low-invasive RB cell line WERI-RB1 and the high-invasive RB cell line Y79. (A) Validation of upregulated IRGs in two different kinds of RB cell lines by qRT-PCR; (B) Validation of downregulated IRGs in two different RB cell lines by qRT-PCR.
Figure 4.
Figure 4.
Results of immune cell infiltration analysis by the ssGSEA algorithm. (A) Heat map of the 28 immune cell proportions and compositions in invasive and noninvasive RB tissues. (B) Quantified comparison of the distribution of 28 infiltrating immune cells in invasive and noninvasive RB tissues.
Figure 5.
Figure 5.
Correlation between hub IRGs and infiltrating immune cells from two datasets. The size of the dots represented the strength of the correlation. The color of the dots represented the P value, and a darker purple color indicated a lower P value. Red labels denote consistent and significant correlations; based on the red label, two key immune cells were labeled in gold. *P < 0.05 was considered statistically significant.
Figure 6.
Figure 6.
SH3GL2 expression is low in invasive retinoblastoma cells and affects cell viability and migration in vitro. (A, B) The protein level of SH3GL2 in WERI-Rb1 or Y79 cells was determined by Western blot assay, and the quantitative data were shown as histograms (n = 6; *P < 0.05). (C, D) WERI-Rb1 cells were transfected with si-NC or si-SH3GL2, and Y79 cells were transfected with OE-NC or OE-SH3GL2. After transfection, SH3GL2 protein level was detected by western blot analysis, and the relative protein levels are represented as histograms. (E) Viability of RB cells after transfection (n = 4; *P < 0.05, **P < 0.01). (FI) Transwell assays represented the relative migration levels of different RB cell lines after transfection (n = 3; *P < 0.05, ***P < 0.001).
Figure 7.
Figure 7.
Downregulation of SH3GL2 in retinoblastoma promotes tumor growth in vivo. (A) Representative macroscopic images of tumors after intratumoral injection of si-NC or si-SH3GL2 for 12 days. (B) The line chart of the tumor volume from xenotransplantation model (n = 5; *P < 0.05). (C) The tumor weight of the xenotransplantation model (n = 5; *P < 0.05). (D) The protein levels of SH3GL2 in tumors from the si-NC group and si-SH3GL2 group were represented by western blot assay. (E). Relative quantification of SH3GL2 protein level in tumors (n = 5; *P < 0.05).
Figure 8.
Figure 8.
Downregulation of SH3GL2 in retinoblastoma promotes tumor invasivenesss in vivo. (A) Representative macroscopic images and H&E staining of livers from si-NC or si-SH3GL2 groups. Bar: 400 µm. Magnification bar: 100 µm. (B) Quantification data showed relative metastatic area in livers from si-NC and si-SH3GL2 groups (n = 5; *P < 0.05). (C) Immunofluorescence analysis of MMP9 (red) and DAPI (blue). Bar: 100 µm. (D) Quantification data showed MMP9/DAPI ratio from si-NC and si-SH3GL2 groups (n = 5; *P < 0.05).
Figure 9.
Figure 9.
Downregulation of SH3GL2 in retinoblastoma increases MDSCs in tumor and spleen tissues. (A) Immunofluorescence analysis of both Gr-1 (green)- and CD11b (red)-positive cells showed that MDSCs in tumor tissues were increased in the si-SH3GL2-injected group. Bar: 100 µm. Magnified images from the merged figures (yellow box); the yellow triangle indicated the MDSCs in the tumor tissues. Bar: 25 µm. (B) Quantification of the number of Gr-1- and CD11b-positive cells/field in tumors (n = 5; *P < 0.05). (C) Immunofluorescence analysis of both Gr-1 (green)- and CD11b (red)-positive cells showed that the MDSCs in the spleen tissues were increased in the si-SH3GL2-injected group. Bar: 100 µm. Magnified images from the merged figures (yellow box); the yellow triangle showed the MDSCs in the spleen tissues. Bar: 25 µm. (D) Quantification of the Gr-1- and CD11b-positive cells/field in spleens (n = 5; *P < 0.05).
Figure 10.
Figure 10.
SH3GL2 shows low expression in the human invasive retinoblastoma. (A) Immunofluorescence analysis of SH3GL2 (red) and DAPI (blue) in human tumor tissue. Bar: 100 µm (B) Quantification data showed SH3GL2/DAPI ratio from noninvasive and invasive groups (n = 6; **P < 0.01). (C) Magnified images from the merged figures (yellow box). Bar: 50 µm.

References

    1. Dimaras H, Corson TW, Cobrinik D, et al. .. Retinoblastoma. Nat Rev Dis Primers. 2015; 1: 1–23. - PMC - PubMed
    1. Ma J, Han H, Ma L, et al. .. The immunostimulatory effects of retinoblastoma cell supernatant on dendritic cells. Protein Cell. 2014; 5: 307–316. - PMC - PubMed
    1. Krishnakumar S, Kandalam M, Mohan A, et al. .. Expression of Fas ligand in retinoblastoma. Cancer. 2004; 101: 1672–1676. - PubMed
    1. Bezzi M, Seitzer N, Ishikawa T, et al. .. Diverse genetic-driven immune landscapes dictate tumor progression through distinct mechanisms. Nat Med. 2018; 24: 165. - PubMed
    1. Chew V, Toh HC, Abastado J-P.. Immune microenvironment in tumor progression: characteristics and challenges for therapy. J Oncol. 2012; 2012: 608406. - PMC - PubMed

Publication types

Substances