. 2022 Oct 31;13(1):6508.
doi: 10.1038/s41467-022-34075-1.

Multidimensional memory topography in the medial parietal cortex identified from neuroimaging of thousands of daily memory videos

Affiliations

Multidimensional memory topography in the medial parietal cortex identified from neuroimaging of thousands of daily memory videos

Wilma A Bainbridge et al. Nat Commun. .

Abstract

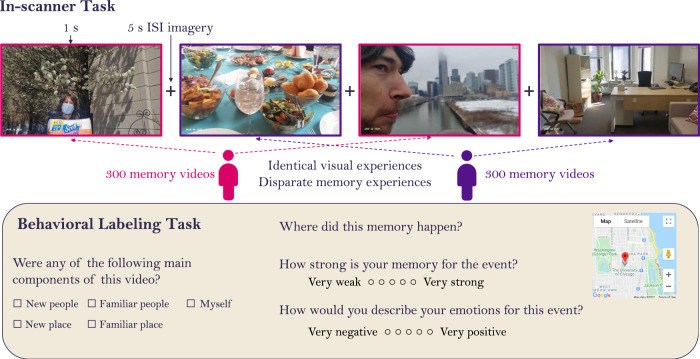
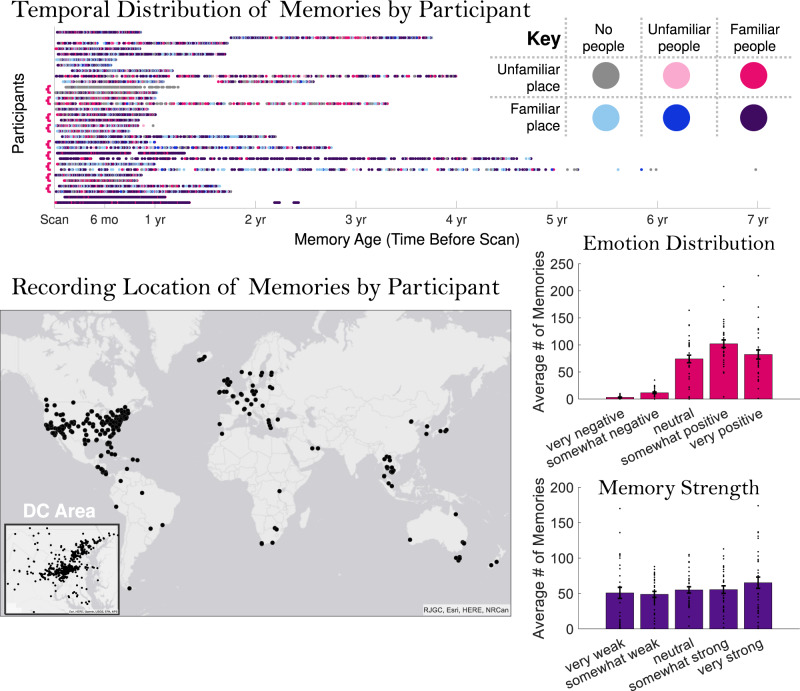
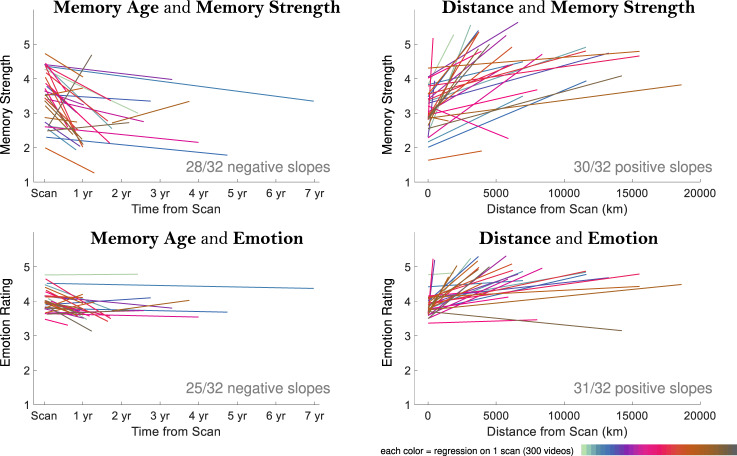
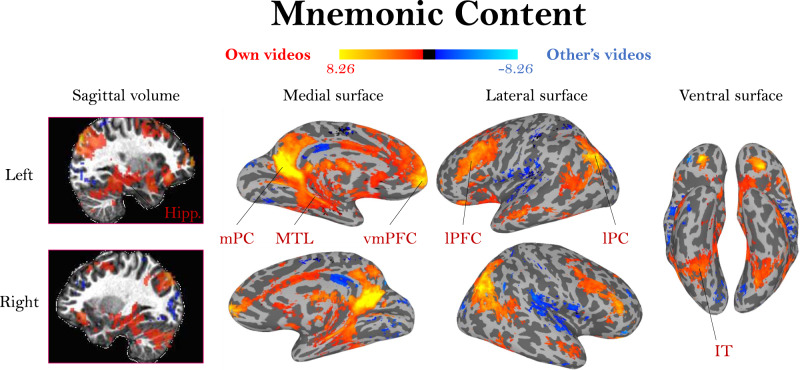
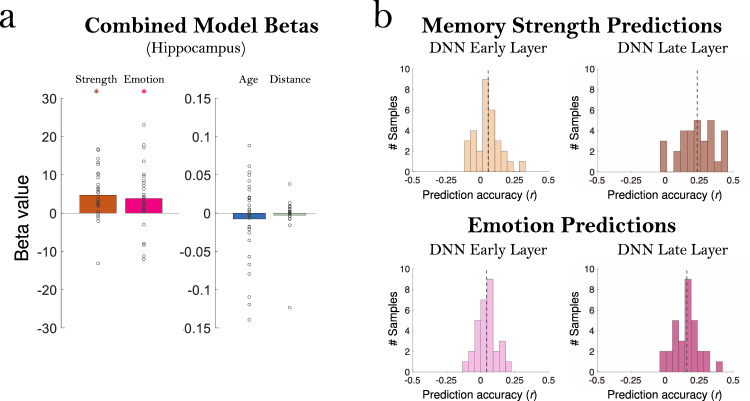
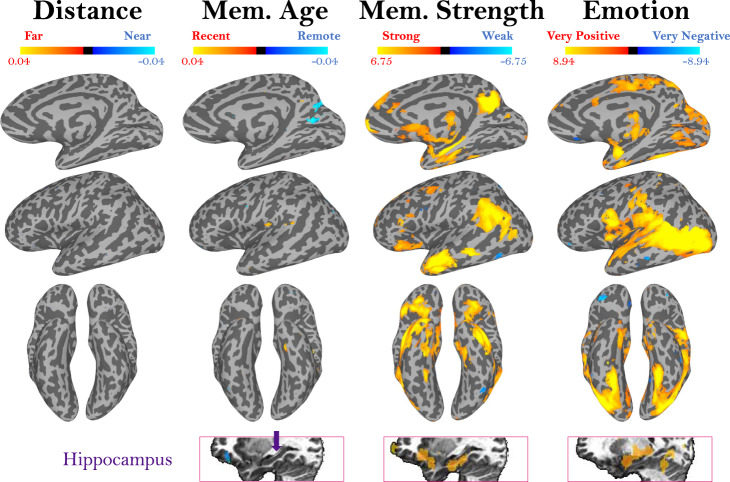
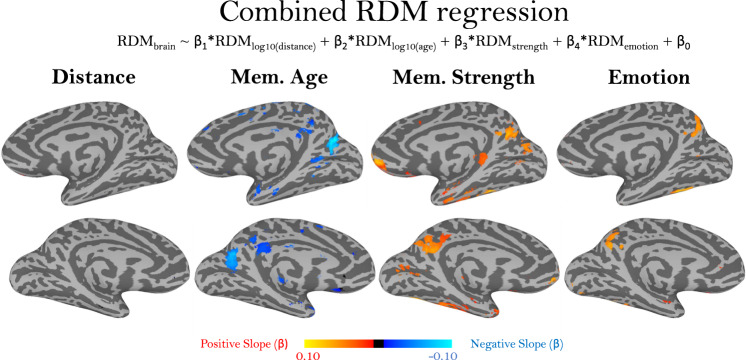
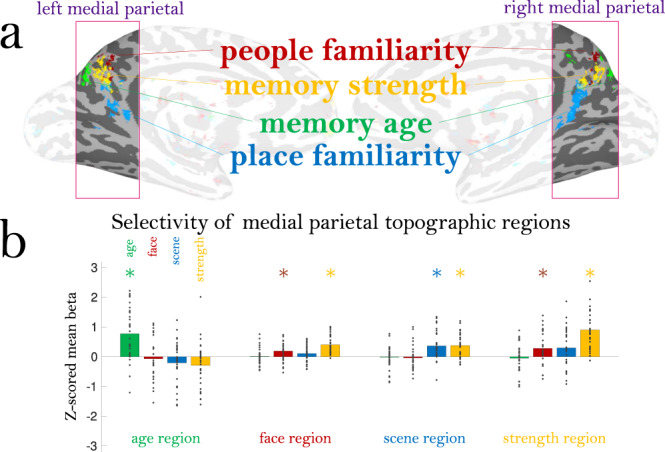
Our memories form a tapestry of events, people, and places, woven across the decades of our lives. However, research has often been limited in assessing the nature of episodic memory by using artificial stimuli and short time scales. The explosion of social media enables new ways to examine the neural representations of naturalistic episodic memories, for features like the memory's age, location, memory strength, and emotions. We recruited 23 users of a video diary app ("1 s Everyday"), who had recorded 9266 daily memory videos spanning up to 7 years. During a 3 T fMRI scan, participants viewed 300 of their memory videos intermixed with 300 from another individual. We find that memory features are tightly interrelated, highlighting the need to test them in conjunction, and discover a multidimensional topography in medial parietal cortex, with subregions sensitive to a memory's age, strength, and the familiarity of the people and places involved.

Trial registration: ClinicalTrials.gov NCT00001360.


Conflict of interest statement

The authors declare no competing interests.

Figures

Fig. 1
Fig. 1. Experimental methods.
For the in-scanner task, participants viewed a randomly intermixed sequence of 1-second videos, consisting of approximately 300 of their own memory videos and 300 memory videos from a paired participant. This participant pair saw the exact same videos in the same order, so their visual experiences were identical, but their memory experiences were non-overlapping, only recognizing their own videos and not recognizing the videos of the paired participant. After viewing a 1 s video, participants had a 5 s interstimulus interval (ISI) during which they were asked to imagine or recall the context surrounding the 1 s video clip. Participants completed a behavioral labeling task after the scan, where they rated their own 300 videos on a series of questions, including the content of the video (people and places in the video), the video location (using GPS coordinates on a map), their memory strength, and emotions for the event. Map data ©2021 Google Inc.
Fig. 2
Fig. 2. The diversity of memories in the study.
These plots show the distributions of the ~300 memories per participant used in the current study along a range of metrics. The temporal distribution shows a scatterplot of the age of each of the participants’ memories. Each horizontal row represents each of the 32 experimental samples, and samples from the same participant (N = 9) are indicated with brackets at the left. While many memories occurred within one year of the experimental scan, several participants had memories extending more than a year prior, and some up to seven years prior to the experiment. Dots are color-coded based on memory content (whether there are familiar/unfamiliar people in the video, and whether it occurs in a familiar place). The content types are diverse across participants, with some recording a majority of videos with familiar people in familiar places, others recording a majority of videos with novel people, places, or both, and even others recording a mix of all content types. The spatial distribution shows the locations of all videos, with each dot representing a video and each color representing a participant. Videos were in diverse locations, with many across the world, even more across the United States, and a large number concentrated in the Washington DC area (where the study was conducted). Looking at a distribution of the emotional ratings for the memories, the documented videos, in general, tended to be neutral or positive (rather than negative). Memory strength ratings were evenly distributed from very weak to very strong. Error bars indicate the standard error of the mean across participants. Source data are provided in the Source Data file.
Fig. 3
Fig. 3. Relationships across memory qualities.
Each plot shows regression fit lines (intercept and slope) for all 32 samples for four comparisons: (top left) memory age and strength, (top right) memory distance and strength, (bottom left) memory age and emotion rating, and (bottom right) memory distance and emotion rating. These trends are shown for illustrative purposes and are statistically confirmed by Spearman rank correlations in the main text that make no assumption about linearity. Memory strength ratings ranged from 1 (very weak) to 5 (very strong), while emotion ratings ranged from 1 (very negative) to 5 (very positive). In 28 out of 32 participant samples, age had a negative relationship with memory strength (i.e., older memories were less strongly remembered). In 30 out of 32 samples, distance had a positive relationship with memory strength (i.e., farther memories were more strongly remembered). In 25 out of 32 samples, age had a negative relationship with emotion (i.e., older memories had weaker emotions). In 31 out of 32 samples, distance had a positive relationship with emotion (i.e., farther memories had stronger positive emotions). Note that the emotion regression lines tend to fall in the upper half of the charts due to the overwhelmingly neutral and positive memories reported by participants (ratings of 3–5). Source data are provided in the Source Data file.
Fig. 4
Fig. 4. Activation differences based on video mnemonic content.
A whole-brain group activation map (N = 32) for viewing one’s own videos (red/yellow) versus viewing another person’s videos (blue), two-sided t-test, FDR-corrected, q < 0.01. The colormap represents the range of beta values. Because participant pairs had identical visual content, these patterns should solely represent activation related to memory for the event. Activation for viewing one’s own videos coincides with regions frequently observed in autobiographical memory studies, including hippocampus (Hipp.), medial parietal cortex (mPC), medial temporal lobe (MTL), ventromedial prefrontal cortex (vmPFC), lateral prefrontal cortex (lPFC), lateral parietal cortex (lPC), and inferotemporal cortex (IT).
Fig. 5
Fig. 5. Significant effects of memory and emotion in the hippocampus and deep neural network (DNN) predictions.
a Betas for all participants in the combined model predicting hippocampal activation from the four factors of memory strength, emotion rating, age (time from scan), and distance from scan site. Each point indicates one of the 32 samples, and the bar indicates the average beta value across participants. Note the much more constrained y-axis needed to display the age and distance factors (beta range of −0.15 to 0.15) versus the memory and emotion factors (beta range of −30 to 30). While memory strength (p = 1.57 × 10−4) and emotion (p = 0.009) show a significant positive relationship to hippocampal activation, age and distance do not (p > 0.10). Significance was assessed with a two-sided t-test versus 0, with FDR correction across ROIs, q < 0.05. b Prediction accuracy of the VGG-16 Deep Learning Neural Network (DNN) layer activations on the middle video frame, for predicting memory strength and emotion ratings. Each histogram shows the distribution of prediction accuracy (Pearson correlation r of predictions with true values of memory strength/emotion) of the 32 participant samples. The dashed gray line indicates the mean prediction accuracy across all participants. For memory strength, both early (layer 2, p = 0.004) and late (layer 20, p = 2.11 × 10−6) layers were significantly able to predict memory strength from the middle frame of the videos alone (top). Early (p = 0.004) and late layers (p = 1.30 × 10−6) were also significantly able to predict emotion ratings from the middle video frame (bottom). Significance was assessed with two-sided Wilcoxon sign rank tests. Source data are provided in the Source Data file.
Fig. 6
Fig. 6. Representations of different memory content.
Maps show whole-brain results from a multiple regression predicting voxel beta values from separate predictors for a memory’s distance, age, strength, and emotion. Activation represents the mean regressor slope (β) for each predictor, where significance was assessed by comparing the slope across all participants with a two-sided t-test versus a null hypothesis slope of 0 (p < 0.01, uncorrected; more stringent threshold shown in Supplemental Fig. 5). The colormaps represent the range of beta values for each predictor, after centering. Surface maps, as well as a volume slice of the hippocampus (indicated in purple) are shown. These maps reveal voxels where the signal is significantly predicted by memory age, strength, and emotion. No regions emerged with sensitivity to memory distance. Alternate views can be seen in Supplemental Fig. 5.
Fig. 7
Fig. 7. Representational similarity analysis of different memory content.
Maps showing bilateral views of results from a multiple regression predicting the representational dissimilarity matrices (RDMs) of voxel beta values, from separate RDMs for a memory’s distance, age, strength, and emotion. Memory distance and age were logarithmically transformed before creating RDMs. Map color values represent the similarity between the brain-based RDM and each predictor RDM, as the regressor slope (β). Significance was assessed by comparing the slope across all participants with a two-sided t-test versus a null hypothesis slope of 0 (p < 0.01, uncorrected).
Fig. 8
Fig. 8. Distribution of memory content in the medial parietal cortex.
a The medial parietal cortex (mPC) contains a topographic map representing different types of memory information. Shown here are the top 1000 voxels with signal for four different types of information: memory age, people familiarity, place familiarity, and memory strength. Each map is shown at 50% transparency; if a voxel is shared across multiple content types, it will be colored by both maps (i.e., a “winner” is not determined in any given voxel). Note the low amount of overlap across content types and hemispheric symmetry of these maps. b Results of a leave-one-out analysis of the mean beta for each content type in each of the topographic regions. Topographic regions were localized with all but one participant, and then the mean z-scored beta of the left-out participant is plotted (each dot). Bars show the mean beta across participants, and * indicate a significant difference in a two-tailed t-test versus 0 (FDR corrected across all comparisons, q < 0.05); exact statistics are reported in the main text. Source data are provided in the Source Data file.

References

    1. Cabeza R, St. Jacques P. Functional neuroimaging of autobiographical memory. Trends Cogn. Sci. 2007;11:219–227. doi: 10.1016/j.tics.2007.02.005. - DOI - PubMed
    1. Sreekumar V, Nielson DM, Smith TA, Dennis SJ, Sederberg PB. The experience of vivid autobiographical reminiscence is supported by subjective content representations in the precuneus. Sci. Rep. 2018;8:14899. doi: 10.1038/s41598-018-32879-0. - DOI - PMC - PubMed
    1. Nielson DM, Smith TA, Sreekumar V, Dennis S, Sederberg PB. Human hippocampus represents space and time during retrieval of real-world memories. Proc. Natl Acad. Sci. USA. 2015;112:11078–11083. doi: 10.1073/pnas.1507104112. - DOI - PMC - PubMed
    1. Rissman J, Chow TE, Reggente N, Wagner AD. Decoding fMRI signatures of real-world autobiographical memory retrieval. J. Cogn. Neurosci. 2016;28:604–620. doi: 10.1162/jocn_a_00920. - DOI - PubMed
    1. Shrager Y, Kirwan CB, Squire LR. Activity in both hippocampus and perirhinal cortex predicts the memory strength of subsequently remembered information. Neuron. 2008;59:547–553. doi: 10.1016/j.neuron.2008.07.022. - DOI - PMC - PubMed

Publication types

Associated data