. 2022 Nov 1;8(1):42.
doi: 10.1038/s41540-022-00253-6.

Network inference from perturbation time course data

Affiliations

Network inference from perturbation time course data

Deepraj Sarmah et al. NPJ Syst Biol Appl. .

Abstract

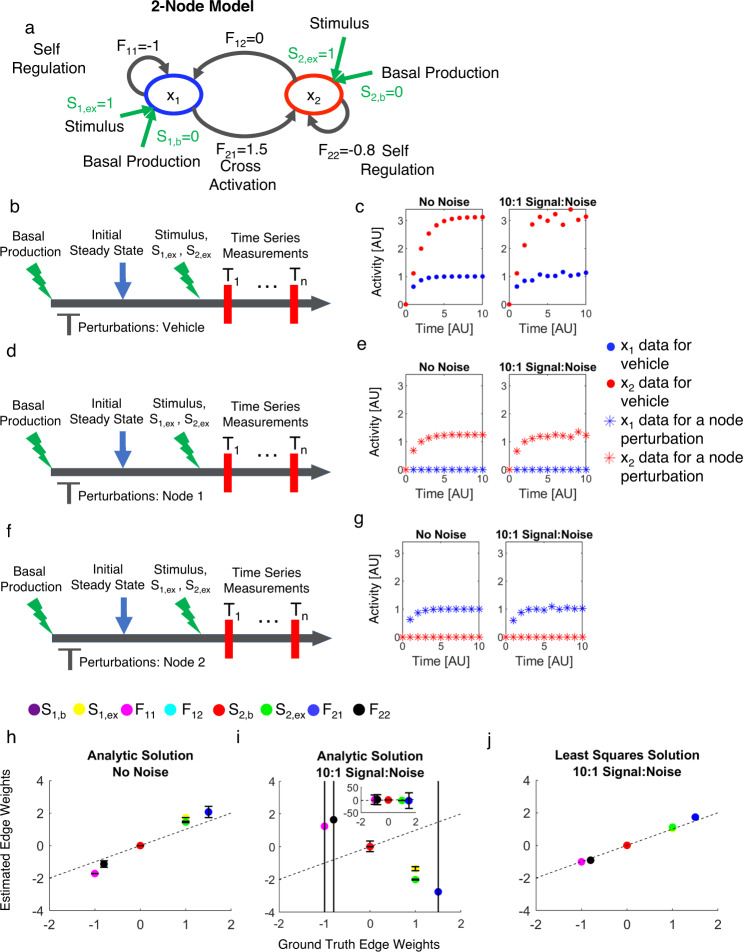
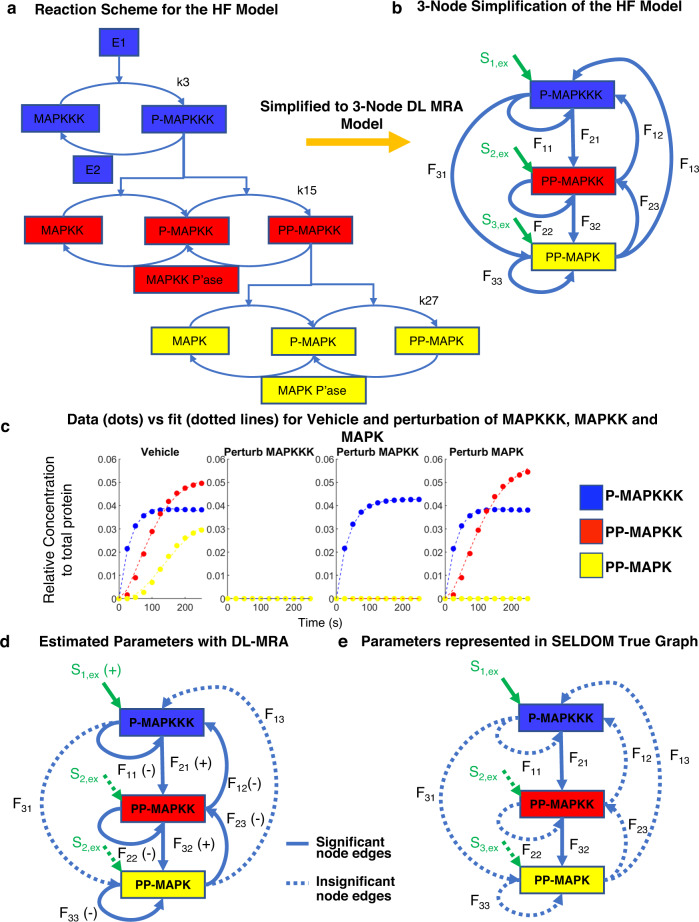
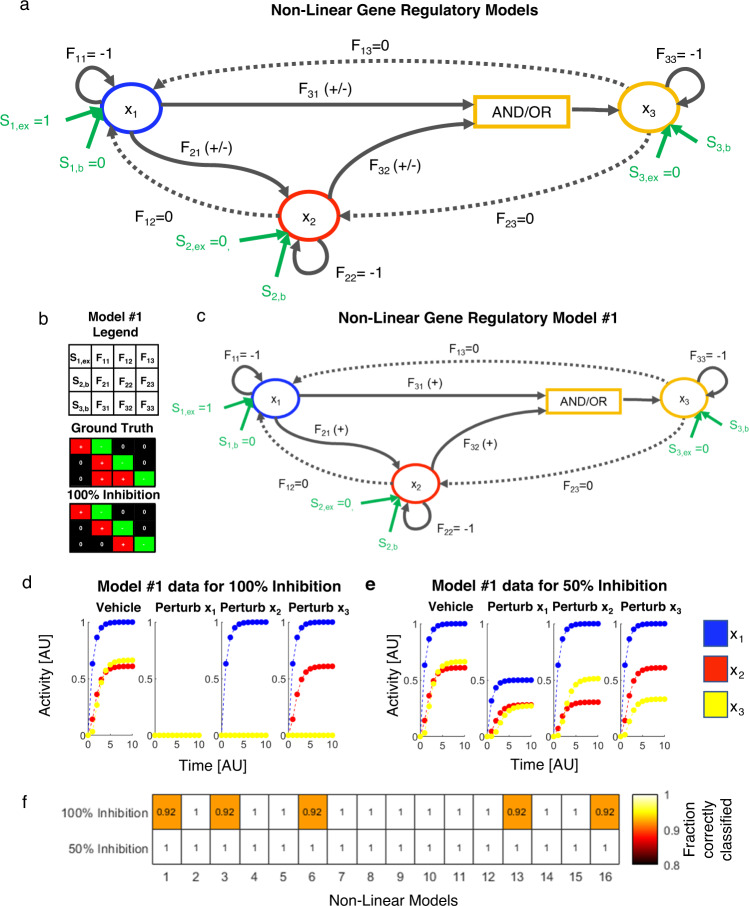
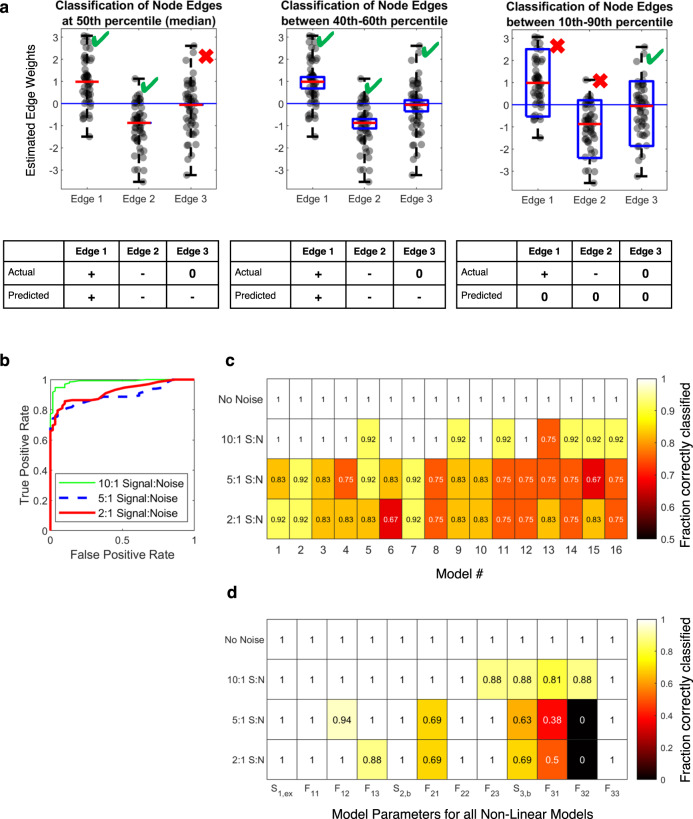
Networks underlie much of biology from subcellular to ecological scales. Yet, understanding what experimental data are needed and how to use them for unambiguously identifying the structure of even small networks remains a broad challenge. Here, we integrate a dynamic least squares framework into established modular response analysis (DL-MRA), that specifies sufficient experimental perturbation time course data to robustly infer arbitrary two and three node networks. DL-MRA considers important network properties that current methods often struggle to capture: (i) edge sign and directionality; (ii) cycles with feedback or feedforward loops including self-regulation; (iii) dynamic network behavior; (iv) edges external to the network; and (v) robust performance with experimental noise. We evaluate the performance of and the extent to which the approach applies to cell state transition networks, intracellular signaling networks, and gene regulatory networks. Although signaling networks are often an application of network reconstruction methods, the results suggest that only under quite restricted conditions can they be robustly inferred. For gene regulatory networks, the results suggest that incomplete knockdown is often more informative than full knockout perturbation, which may change experimental strategies for gene regulatory network reconstruction. Overall, the results give a rational basis to experimental data requirements for network reconstruction and can be applied to any such problem where perturbation time course experiments are possible.


Conflict of interest statement

The authors declare no competing interests.

Figures

Fig. 1
Fig. 1. Overall DL-MRA approach.
a Two-node network with Jacobian elements labeled. Green arrows are stimuli and basal production terms. Time course experimental design with perturbations: vehicle (b), Node 1 (d), Node 2 (f). The vehicle may be the solvent like DMSO for inhibition with a drug, or a nontargeting si/shRNA for inhibition with si/shRNA. Simulated time course data for Vehicle perturbation (c), Node 1 perturbation (e), Node 2 perturbation (g) from the network in a. Left Column: no added noise; Right Column 10:1 signal-to-noise added. Actual versus inferred model parameters (S1,b, S1,ex, F11, F12, S2,b, S2,ex, F21, F22) for direct solution of Eqs. 3–4 in the absence (h) or presence (i) of noise, or with noise and the least-squares approach (j). In h and i, error bars are standard deviation across time points.
Fig. 2
Fig. 2. Application to linear two and three node models.
a Connections around a Node i in an n-Node Model. Si,b and Si,ex are the basal production and external stimulus terms acting on Node i, respectively. Fii is the self-regulation term; Fij the effect of Node j on Node i and Fji the effect of Node i on Node j. b Example of different signal-to-noise ratio effects on time course data. Ground truth versus estimated edge weights across all 50 random networks and noise levels for data from four different total timepoints (3,7,11,21) for 2 node (c) and 3 node (d) networks. Quadrant shading indicates edge classification. Fraction of network parameters correctly classified in 50 randomly generated 2 node networks (e) and 3 node networks (f) with different noise levels and total timepoints. g Fraction of network parameters correctly classified in 50 randomly generated 3 node networks with dynamic MRA using two sets of perturbation data.
Fig. 3
Fig. 3. Application to cell state transition networks.
a Markov transition model of SUM159 cell states. b Cell proportions over time for SUM159 cells using Markov transition parameters (dots), starting at different initial proportions and respective DL-MRA model fits (lines). c Parameters from DL-MRA estimates of SUM159 data are similarly classified as transformed Markov parameters (See Methods, Eqs. (29) and (30)). d Ground truth versus estimated edge weights across 50 random cell transition networks and noise levels for data from four different total timepoints (3,7,11,21).
Fig. 4
Fig. 4. Application to a signaling network.
a Full Reaction scheme for the Huang–Ferrell (HF) Model, depicting the parameters k3, k15 and k27 which were perturbed sequentially to generate the perturbation data. b Model coarse-graining to a 3-node network. c Data generated for each node with a small E1 stimulus (2.5 × 10−6 uM). d Model parameters estimated as significant (bold) and negligible (dotted lines). e SELDOM true graph values represented in the 3-node model with parameters considered (bold) and not considered (dotted lines).
Fig. 5
Fig. 5. Application to 16 non-linear gene regulatory networks: no noise.
a Feedforward loop (FFL) network models. Across all 16 models (Table 1), F11, F22, and F33 values are fixed at -1 and F12, F13, and F23 values are fixed at 0. F21, F31, and F32 values can be positive or negative depending on the model. The combined effect of x1 and x2 on x3 is described by either an AND gate or an OR gate. There are 16 possible model structures (Table 1). b 100% inhibitory perturbations may not provide accurate classification even without noise. In Model #1, F31 is positive (ground truth) but is estimated as null. c Specific structure of Model #1. d Node activity simulation data for 100% inhibition in Model #1, implying that it is impossible to infer F31 from such data. e Node activity simulation data for 50% inhibition in Model #1, showing potential to infer F31. f Fraction of model parameters correctly classified in all the 16 non-linear models without noise, for 100% inhibition vs 50% inhibition.
Fig. 6
Fig. 6. Application to 16 non-linear gene regulatory networks: including noise.
a Classification scheme for a distribution of parameter estimates. Going from left to right panels, the same parameter distribution with an actual (ground truth) value of positive (+), negative (−), or null (0), respectively, is estimated using different percentile windows centered on the median. The percentile “window” is the median value for the leftmost panel (rigorous classification), between 40th and 60th percentile in the second panel, and between 10th and 90th percentile in the third panel (conservative classification). Going from rigorous to conservative (left to right), an intermediate between the two gives a good classification performance. b ROC curves across all parameters for all 16 FFL models. Different color lines are different noise levels. c Fraction of correctly classified model parameters for different noise levels broken down by FFL model type. d Fraction of each model parameter correctly classified for different noise levels broken down by parameter type.

References

    1. Angulo MT, Moreno JA, Lippner G, Barabási A-L, Liu Y-Y. Fundamental limitations of network reconstruction from temporal data. J. R. Soc. Interface. 2017;14:20160966. doi: 10.1098/rsif.2016.0966. - DOI - PMC - PubMed
    1. Barabási AL, Albert R. Emergence of scaling in random networks. Science. 1999;286:509–512. doi: 10.1126/science.286.5439.509. - DOI - PubMed
    1. Califano A, Butte AJ, Friend S, Ideker T, Schadt E. Leveraging models of cell regulation and GWAS data in integrative network-based association studies. Nat. Genet. 2012;44:841–847. doi: 10.1038/ng.2355. - DOI - PMC - PubMed
    1. Calvano SE, et al. A network-based analysis of systemic inflammation in humans. Nature. 2005;437:1032–1037. doi: 10.1038/nature03985. - DOI - PubMed
    1. Dorel M, et al. Modelling signalling networks from perturbation data. Bioinformatics. 2018;34:4079–4086. doi: 10.1093/bioinformatics/bty473. - DOI - PubMed

Publication types

MeSH terms