Review
. 2022 Dec;6(12):1353-1369.
doi: 10.1038/s41551-022-00942-x. Epub 2022 Oct 31.

Graph representation learning in biomedicine and healthcare

Affiliations
Review

Graph representation learning in biomedicine and healthcare

Michelle M Li et al. Nat Biomed Eng. 2022 Dec.

Abstract

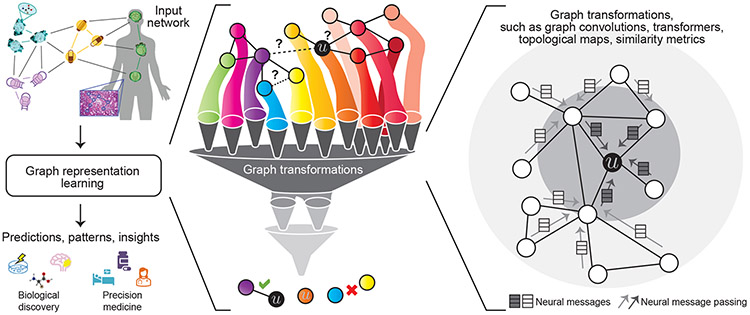
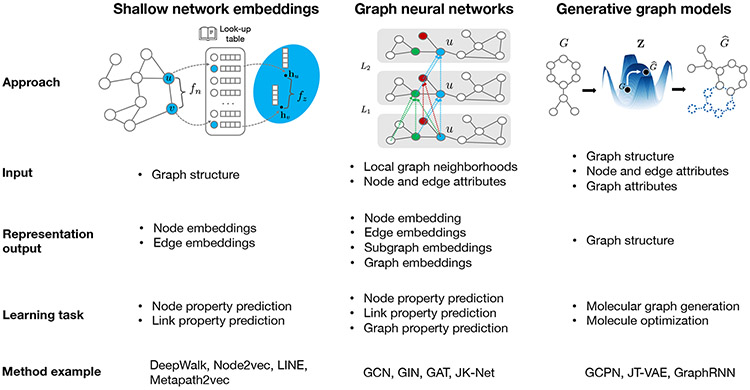
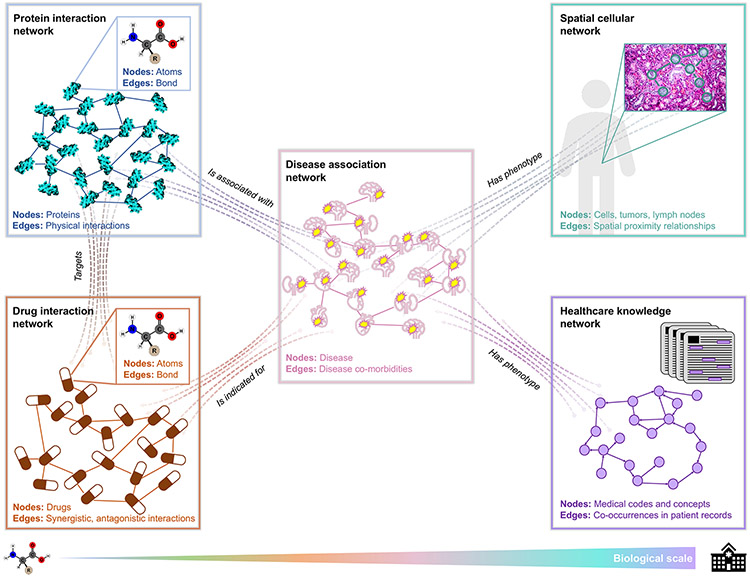
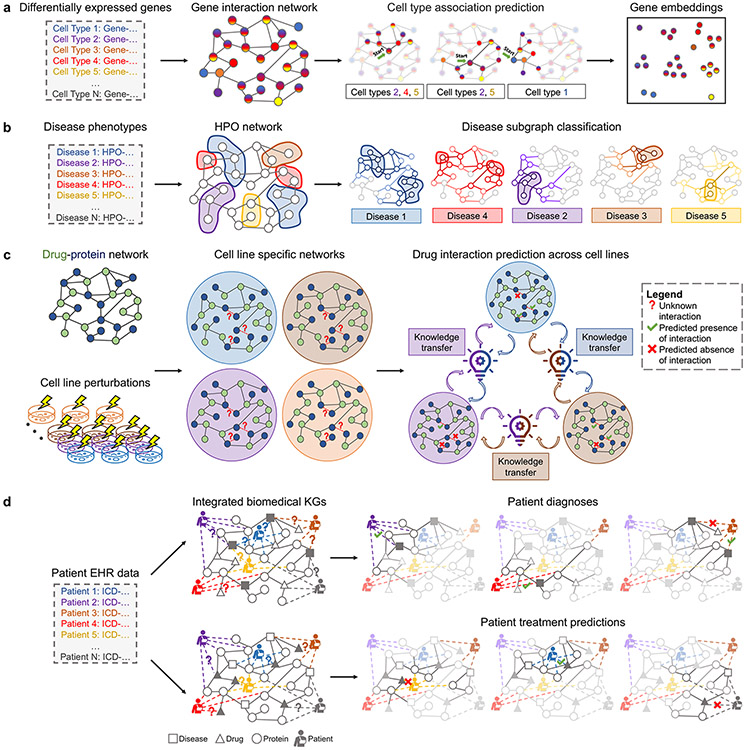
Networks-or graphs-are universal descriptors of systems of interacting elements. In biomedicine and healthcare, they can represent, for example, molecular interactions, signalling pathways, disease co-morbidities or healthcare systems. In this Perspective, we posit that representation learning can realize principles of network medicine, discuss successes and current limitations of the use of representation learning on graphs in biomedicine and healthcare, and outline algorithmic strategies that leverage the topology of graphs to embed them into compact vectorial spaces. We argue that graph representation learning will keep pushing forward machine learning for biomedicine and healthcare applications, including the identification of genetic variants underlying complex traits, the disentanglement of single-cell behaviours and their effects on health, the assistance of patients in diagnosis and treatment, and the development of safe and effective medicines.


Figures

Figure 1:
Figure 1:. Representation learning for networks in biology and medicine.
Given a biomedical network, a representation learning method transforms the graph to extract patterns and leverage them to produce compact vector representations that can be optimized for the downstream task. The far right panel shows a local 2-hop neighborhood around node u, illustrating how information (e.g., neural messages) can be propagated along edges in the neighborhood, transformed, and finally aggregated at node u to arrive at the u’s embedding.
Figure 2:
Figure 2:. Predominant paradigms in graph representation learning.
(a) Shallow network embedding methods generate a dictionary of representations hu for every node u that preserves the input graph structure information. This is achieved by learning a mapping function fz that maps nodes into an embedding space such that nodes with similar graph neighborhoods measured by function fn get embedded closer together (Section 2.1). Given the learned embeddings, an independent decoder method can optimize embeddings for downstream tasks, such as node or link property prediction. Method examples include Deep Walk [55], Node2vec [56], LINE [57], and Metapath2vec [58]. (b) In contrast with shallow network embedding methods, graph neural networks can generate representations for any graph element by capturing both network structure and node attributes and metadata. The embeddings are generated through a series of non-linear transformations, i.e., message-passing layers (Lk denotes transformations at layer k), that iteratively aggregate information from neighboring nodes at the target node u. GNN models can be optimized for performance on a variety of downstream tasks (Section 2.2). Method examples include GCN [59], GIN [60], GAT [61], and JK-Net [62]. (c) Generative graph models estimate a distribution landscape Z to characterize a collection of distinct input graphs. They use the optimized distribution to generate novel graphs G^ that are predicted to have desirable properties, e.g., a generated graph can be represent a molecular graph of a drug candidate. Generative graph models use graph neural networks as encoders and produce graph representations that capture both network structure and attributes (Section 2.3). Method examples include GCPN [63], JT-VAE [64], and GraphRNN [65]. SI Figure 1 and SI Note 3 outline other representation learning techniques.
Figure 3:
Figure 3:. Overview of biomedical applications areas.
Networks are prevalent across biomedical areas, from the molecular level to the healthcare systems level. Protein structures and therapeutic compounds can be modeled as a network where nodes represent atoms and edges indicate a bond between pairs of atoms. Protein interaction networks contain nodes that represent proteins and edges that indicate physical interactions (top left). Drug interaction networks are comprised of drug nodes connected by synergistic or antagonistic relationships (bottom left). Protein- and drug-interaction networks can be combined using an edge type that signifies a protein being a “target” of a drug (left). Disease association networks often contain disease nodes with edges representing co-morbidity (middle). Edges exist between proteins and diseases to indicate proteins (or genes) associated with a disease (top middle). Edges exist between drugs and diseases to signify drugs that are indicated for a disease (bottom middle). Patient-specific data, such as medical images (e.g., spatial networks of cells, tumors, and lymph nodes) and EHRs (e.g., networks of medical codes and concepts generated by co-occurrences in patients’ records), are often integrated into a cross-domain knowledge graph of proteins, drugs, and diseases (right). With such vast and diverse biomedical networks, we can derive fundamental insights about biology and medicine while enabling personalized representations of patients for precision medicine. Note that there are many other types of edge relations; “targets,” “is associated with,” “is indicated for,” and “has phenotype” are a few examples.
Figure 4:
Figure 4:. Representation learning in four areas of biology and medicine.
We present a case study on (a) cell-type aware protein representation learning via multilabel node classification (details in Box 2), (b) disease classification using subgraphs (details in Box 3), (c) cell-line specific prediction of interacting drug pairs via edge regression with transfer learning across cell lines (details in Box 4), and (d) integration of health data into knowledge graphs to predict patient diagnoses or treatments via edge regression (details in Box 5).

References

    1. Qiu X, Rahimzamani A, Wang L, Ren B, Mao Q, Durham T, McFaline-Figueroa JL, Saunders L, Trapnell C, and Kannan S. Inferring causal gene regulatory networks from coupled single-cell expression dynamics using scribe. Cell Systems, 2020. - PMC - PubMed
    1. Nicholson DN and Greene CS. Constructing knowledge graphs and their biomedical applications. Computational and Structural Biotechnology Journal, 2020. - PMC - PubMed
    1. Robinson PN, Köhler S, Bauer S, Seelow D, Horn D, and Mundlos S. The human phenotype ontology: a tool for annotating and analyzing human hereditary disease. The American Journal of Human Genetics, 2008. - PMC - PubMed
    1. Schriml LM, Arze C, Nadendla S, Chang Y-WW, Mazaitis M, Felix V, Feng G, and Kibbe WA. Disease ontology: a backbone for disease semantic integration. Nucleic Acids Research, 2012. - PMC - PubMed
    1. Hong C, Rush E, Liu M, Zhou D, Sun J, Sonabend A, Castro VM, Schubert P, Panickan VA, Cai T, et al. Clinical knowledge extraction via sparse embedding regression (KESER) with multi-center large scale electronic health record data. medRxiv, 2021. - PMC - PubMed

Publication types