. 2022 Dec;6(12):2003-2015.
doi: 10.1038/s41559-022-01914-9. Epub 2022 Oct 31.

Admixture has obscured signals of historical hard sweeps in humans

Affiliations

Admixture has obscured signals of historical hard sweeps in humans

Yassine Souilmi et al. Nat Ecol Evol. 2022 Dec.

Abstract

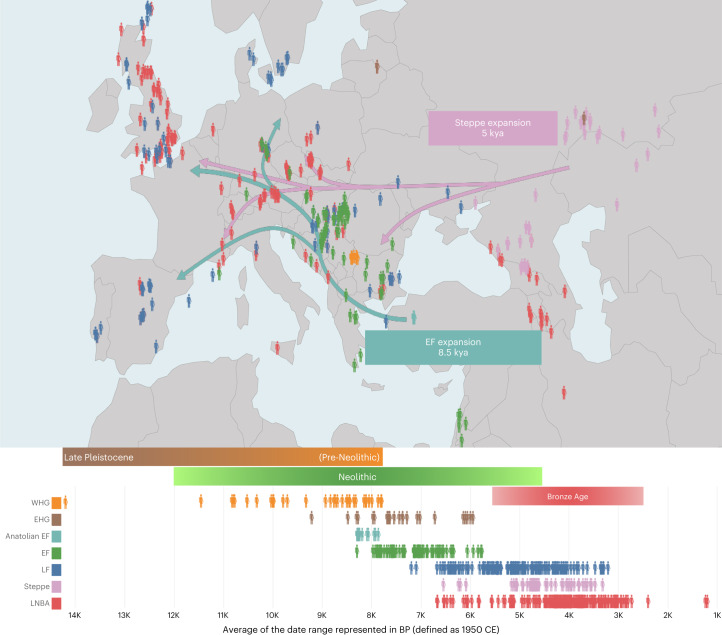
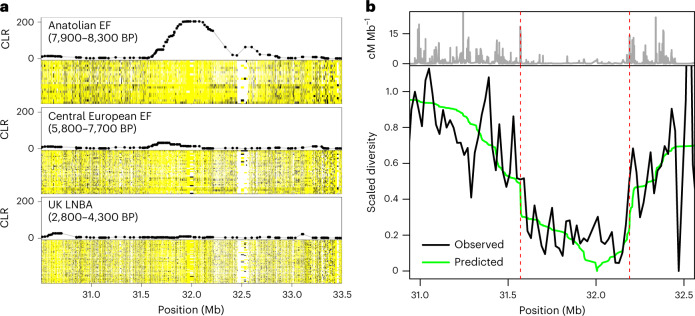
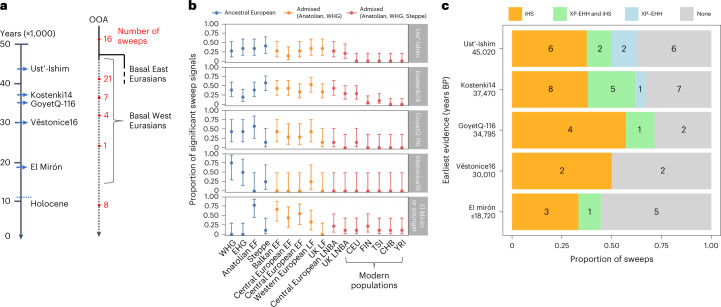
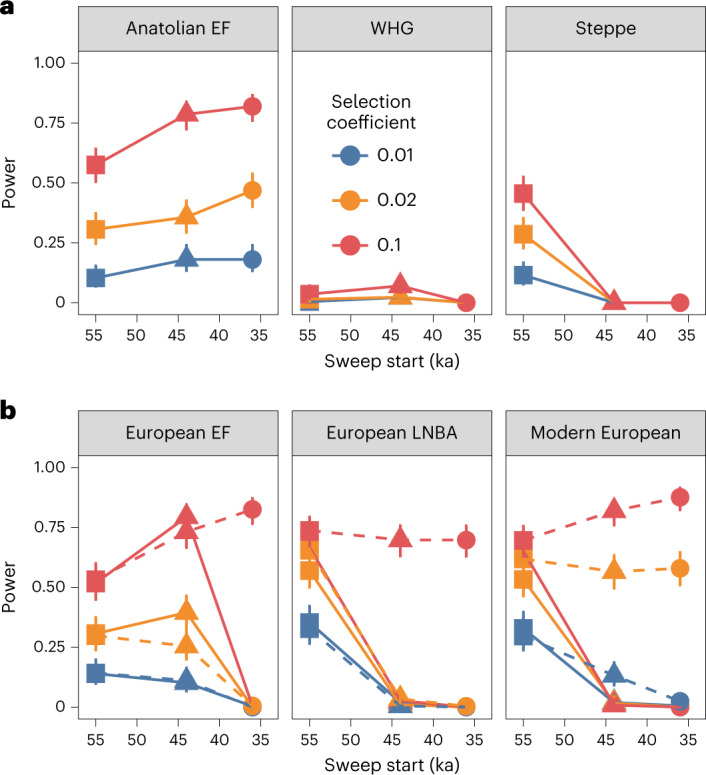
The role of natural selection in shaping biological diversity is an area of intense interest in modern biology. To date, studies of positive selection have primarily relied on genomic datasets from contemporary populations, which are susceptible to confounding factors associated with complex and often unknown aspects of population history. In particular, admixture between diverged populations can distort or hide prior selection events in modern genomes, though this process is not explicitly accounted for in most selection studies despite its apparent ubiquity in humans and other species. Through analyses of ancient and modern human genomes, we show that previously reported Holocene-era admixture has masked more than 50 historic hard sweeps in modern European genomes. Our results imply that this canonical mode of selection has probably been underappreciated in the evolutionary history of humans and suggest that our current understanding of the tempo and mode of selection in natural populations may be inaccurate.


Conflict of interest statement

The authors declare no competing interests.

Figures

Fig. 1
Fig. 1. Geographic and temporal distribution of 1,162 ancient Eurasian samples used in this study.
Each human symbol represents a sample, and the colours indicate different populations classified into broad groupings according to archaeological records of material culture and lifestyle (colours indicated at the bottom left-hand side; Supplementary Text 1). Sample ages are represented in the bottom panel in thousand years before present (BP). The green lines depict the generalized migration route of Anatolian EF into Europe ~8.5 ka, where they mixed with WHG (EHG refers to the contemporaneous Eastern Hunter-Gatherers) to create the European Early Farmers (EF). Similarly, the pink arrows represent the generalized movement of Steppe Pastoralists (Steppe; samples east of the Ural Mountains not shown), which resulted in admixture with LF ~5 ka, giving rise to LNBA societies.
Fig. 2
Fig. 2. Assessing the robustness of the hard sweep detection pipeline.
a, Schematic of the West Eurasian population history model used to explore the statistical properties of our analytical pipeline and the impact of historical bottlenecks and admixture on the FDR. Each vertical segment denotes a major population branch (effective population sizes shown in gold text), with grey horizontal arrows denoting separation and admixture events (times shown on the right-hand side of the figure, assuming that admixture occurred 500 years after the onset of the migrations shown in Fig. 1; with percentages indicating the proportion of ancestry contributed by the incoming admixture branch). Model parameters are taken from one of three studies, as denoted by the associated superscript (1, ref. ; 2, ref. ; 3, ref. ), with CHG indicating Caucasus Hunter-Gatherers and ANE denoting Ancient North Eurasians. b, Estimated FDR measured at six different simulated populations sampled before (Anatolian EF, Steppe and WHG) and after major admixture events (EF, LNBA and Modern Europeans (EUR)). Results are shown for 30 simulated genomes, dots indicate mean values, horizontal lines represent quartile values (see Supplementary Fig. 19 for further information on sample size and sampling time), and the colour scale indicates the number of false positives (No. FPs). The maximum mean FDR observed amongst the simulated populations at this threshold, ~11%, was used as a conservative estimate for the study-wide FDR.
Fig. 3
Fig. 3. Hard selective sweep in MHC-III region in Anatolian EF.
a, Haploimage of the MHC-III region and associated SweepFinder2 CLR score for the Anatolian EF, Central European EF and British Bronze Age (UK LNBA) populations. Pseudohaploid calls are shown for all samples in each population, with major alleles in yellow, minor alleles in black and missing data in white. Elevated SweepFinder2 CLR scores coincide with a region of depleted variation in the Anatolian EF population, which returns to background levels in the subsequent admixed populations. b, The estimated nucleotide diversity across the MHC-III region of the Anatolian EF (black line) and expected diversity under a hard sweep model (green line; Supplementary Text 3) relative to the underlying recombination rate in cM Mb−1 (grey line on top). The two dashed red lines indicate local recombination hotspots that flank the sweep region. The close correspondence between the expected and observed genetic diversity across this region is unlikely to be a bioinformatic artefact and points to the authenticity of the signal.
Fig. 4
Fig. 4. Older sweeps are more robust to population admixture.
a, Schematic representation of the inferred temporal origins of the 57 sweeps. Each sweep was classified according to the first presence of the sweep haplotype amongst the five moderate-to-high-coverage Upper Palaeolithic specimens (italic labels, blue arrows indicate the approximate sample age), resulting in five distinct categories that are putative lower bounds of selection onset times: that is, Ust’-Ishim, n = 16; Kostenki14, n = 21; GoyetQ-116, n = 7; Věstonice16, n = 4; El Mirón, n = 9 (the final category also includes eight sweep haplotypes that were not observed in any Palaeolithic specimen). b,c, For each onset category, we quantified the proportion of sweeps observed for each tested population (b; dots indicate proportion of sweeps present at q < 0.05; error bars show 95% binomial confidence intervals) and classified sweeps according to results from two studies reporting partial sweeps in modern Europeans, (c; integrated haplotype score, iHS; test statistics from ref. being limited to outliers reported in at least two European populations to provide a stringent classification). Sweeps starting within the last 35,000 years (that is, not observed in GoyetQ-116 or older samples) tend to have patterns consistent with local selection, being highly frequent in some ancient populations but absent in others (Supplementary Text 4) and are less likely to be reported as partial sweeps nearing fixation (that is, lack an XP-EHH signal in ref. ,; see key in c). Although the latter difference was not significant (one-sided Fisher’s exact test P ~0.17), our results are consistent with sweeps arising after the diversification of the Eurasian founders being more susceptible to admixture distortion. CEU, Western European; Han Chinese in Beijing, CHB; FIN, Finnish in Finland; TSI, Toscani in Italy.
Fig. 5
Fig. 5. Investigating the influence of admixture on sweep detection in modern populations.
a,b, Sweep detection power was estimated for selected loci simulated using a realistic Eurasian demographic model (Fig. 2a and Supplementary Fig. 19) with sample sizes based on empirical observations (that is, Anatolian EF, n = 28; WHG, n = 45, Steppe, n = 68; European EF, n = 78; European LNBA, n = 192; and Modern Europeans n = 200). Sweeps were timed to start before the diversification of the Eurasian founding population (55 ka) or following the separation of population branches that eventually gave rise to Steppe (44 ka) or WHG populations (36 ka). Mean power and 95% confidence intervals (measured at a FPR of 0.1%) are shown relative to the onset of selection in (a) the three European source populations (Anatolian EF, WHG and Steppe) as well as in (b) three admixed populations following the mixing of WHG and Anatolian EF at 8.5 ka (European EF, sampled at 7 ka) and the European EF and Steppe herder admixture at 4.5 ka (LNBA and Modern Europeans, sampled at 4 ka and 0 ka, respectively). Only beneficial mutations preceding the initial diversification of Eurasian lineages at 55 ka are evident in all populations when the selection pressure does not persist following the admixture events, with sweeps starting before 44 ka also detectable in European EF as they are shared by both source populations (b, solid lines). Notably, power increased appreciably for strongly selected loci (s ≥ 0.02) when selection was allowed to continue in the postadmixture phase (b, dashed lines) owing to these loci refixing following the admixture event.
Fig. 6
Fig. 6. Mutational origins of the Eurasian hard sweeps.
The probability that a sweep was caused by an SGV relative to a de novo mutation conditional on a sweep of either type occurring within a fixed time interval (left panel), following equations in ref. (and assuming standard human generation times and mutation rates). SGVs are assumed to have been under some degree of purifying selection (denoted by different coloured symbols) before the environmental shift that leads to a strong bottleneck (that is, a tenfold reduction in population size; see Supplementary Fig. 21 for results from models with less severe bottlenecks) and initiates the beneficial selection phase (symbol shapes). Fixation from SGVs was highly likely (>75%) for constrained time intervals (≤20 kyrs) when the beneficial selection strength (Sel. ben.) was moderate (s ~0.01), both being plausible values for Eurasian sweeps, provided that purifying selection (Sel. del.) before the environmental shift was weak (s ≤ 0.001). Factoring in the probability that fixed SGVs all descend from a single copy at the time of environmental shift results in consistently high probabilities (≥50%) that selection resulted in a hard sweep pattern regardless of the mutational source, provided that SGVs had previously been deleterious (right panel). Notably, the fixation of variants that had previously been strongly deleterious required large mutational target (Mut. target) sizes (>1000 possible mutations) to ensure fixation within a 40,000-year interval when the beneficial selection strength was ~0.01, which may be implausibly large for many traits.

References

    1. Jensen JD, et al. The importance of the neutral theory in 1968 and 50 years on: a response to Kern & Hahn 2018. Evolution. 2018;112:2109. - PMC - PubMed
    1. Nielsen R, Hellmann I, Hubisz M, Bustamante C, Clark AG. Recent and ongoing selection in the human genome. Nat. Rev. Genet. 2007;8:857–868. doi: 10.1038/nrg2187. - DOI - PMC - PubMed
    1. Huber CD, Nordborg M, Hermisson J, Hellmann I. Keeping it local: evidence for positive selection in Swedish Arabidopsis thaliana. Mol. Biol. Evol. 2014;31:3026–3039. doi: 10.1093/molbev/msu247. - DOI - PMC - PubMed
    1. Zheng Y, Wiehe T. Adaptation in structured populations and fuzzy boundaries between hard and soft sweeps. PLoS Comput. Biol. 2019;15:e1007426. doi: 10.1371/journal.pcbi.1007426. - DOI - PMC - PubMed
    1. Harris RB, Sackman A, Jensen JD. On the unfounded enthusiasm for soft selective sweeps II: examining recent evidence from humans, flies, and viruses. PLoS Genet. 2018;14:e1007859. doi: 10.1371/journal.pgen.1007859. - DOI - PMC - PubMed

Publication types