. 2022 Oct 31;12(1):18324.
doi: 10.1038/s41598-022-21808-x.

Persistent muscle hyperalgesia after adolescent stress is exacerbated by a mild-nociceptive input in adulthood and is associated with microglia activation

Affiliations

Persistent muscle hyperalgesia after adolescent stress is exacerbated by a mild-nociceptive input in adulthood and is associated with microglia activation

Sathish Kumar Singaravelu et al. Sci Rep. .

Abstract

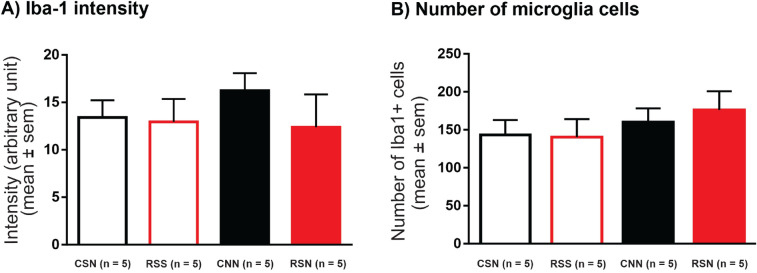
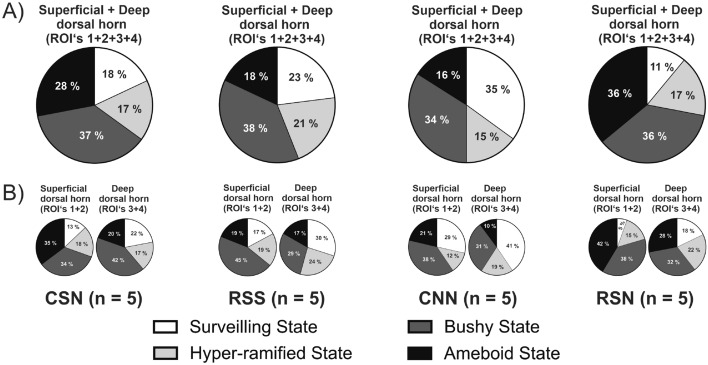
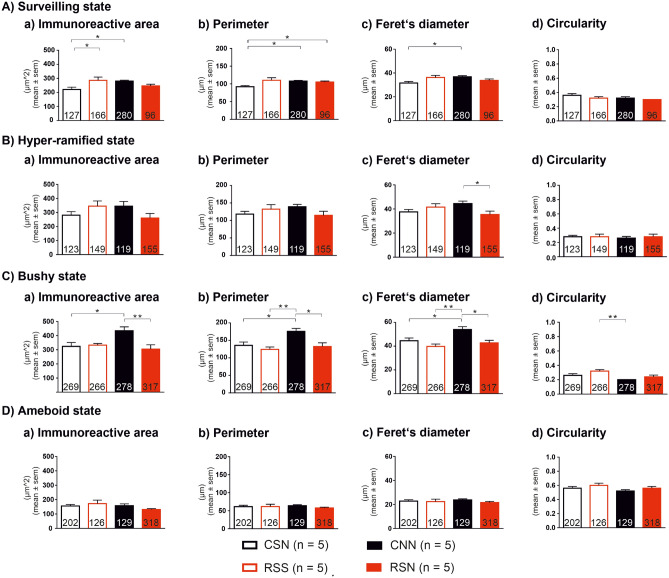
Non-specific low back pain (LBP) is a major global disease burden and childhood adversity predisposes to its development. The mechanisms are largely unknown. Here, we investigated if adversity in young rats augments mechanical hyperalgesia and how spinal cord microglia contribute to this. Adolescent rats underwent restraint stress, control animals were handled. In adulthood, all rats received two intramuscular injections of NGF/saline or both into the lumbar multifidus muscle. Stress induced in rats at adolescence lowered low back pressure pain threshold (PPT; p = 0.0001) and paw withdrawal threshold (PWT; p = 0.0007). The lowered muscle PPT persisted throughout adulthood (p = 0.012). A subsequent NGF in adulthood lowered only PPT (d = 0.87). Immunohistochemistry revealed changes in microglia morphology: stress followed by NGF induced a significant increase in ameboid state (p < 0.05). Repeated NGF injections without stress showed significantly increased cell size in surveilling and bushy states (p < 0.05). Thus, stress in adolescence induced persistent muscle hyperalgesia that can be enhanced by a mild-nociceptive input. The accompanying morphological changes in microglia differ between priming by adolescent stress and by nociceptive inputs. This novel rodent model shows that adolescent stress is a risk factor for the development of LBP in adulthood and that morphological changes in microglia are signs of spinal mechanisms involved.


Conflict of interest statement

The authors declare no competing interests.

Figures

Figure 1
Figure 1
Experimental procedure. (A) Animals of the stress group were repeatedly stressed (black line) in a narrow plastic restrainer for 12 consecutive days for 1 h every day on postnatal days (PD21-32; early adolescent phase; black line). The pressure pain threshold (PPT) of the left multifidus muscle at vertebral level L5 and paw withdrawal threshold (PWT) of the left hind paw was measured at different time points (red line) (PPT—downward arrow: PD21, PD34, PD85, PD86, PD87, PD90, PD91; PWT—upward arrow: PD36, PD85, PD86, PD87, PD90, PD91). All animals received injections of NGF/saline on PD85 and PD90 (adulthood phase) according to the group they belonged to (refer to section Treatment groups). On PD91 (black bar) all animals were perfused and fixed. The spinal cord tissues were extracted and stored. (Ba) A schematic illustration of the regions of interest on a spinal lumbar 2 (L2) section (refer to section Image processing). The red circle on the ventral horn of the contralateral side denotes the manually made pinhole to identify the contralateral side. (B.b) An example overview image (10x) of an Iba-1 stained L2 section (scale bar: 200 µm, background subtracted) and magnified (40x) of ROI 1 (scale bar: 10 µm, Raw image and Probability map). The hole on the ventral horn of the contralateral side denotes the manually made hole with a pin for the identification of contralateral side. PD, postnatal day; Ip., ipsilateral; Con., contralateral; Iba-1, ionized calcium binding adapter molecule 1; ROI, region of interest.
Figure 2
Figure 2
Pressure pain threshold and paw withdrawal threshold before and after stress. Repeated restraint stress in early adolescence induces long-lasting local muscle hyperalgesia and remote cutaneous hyperalgesia compared with non-stressed controls. (A.a) Individual data points expressed in log scale, force (in ‘g’ on the left y-axis) required to elicit a pain-related reaction (withdrawal behavior, escape movements, vocalization) using a blunt probe with an area of 3.46 mm2 when applied to the left multifidus muscle of the low back. Horizontal lines indicate the median for each group. (A.b) Ratio (in ‘%’) of mean pressure pain threshold R.stress/control. (B.a) Individual data points expressed in log scale, force (in ‘g’ on the left y-axis) required to elicit a pain-related reaction (paw licking, paw withdrawal) using a rigid cylindrical tip with an area of 0.8 mm2 when applied on the plantar surface of the left hind paw. Horizontal lines indicate the median for each group. (B.b) Ratio (in ‘%’) of mean paw withdrawal threshold R.stress/control. PD, postnatal days (see Fig. 1A). P-values: U-test of Mann and Whitney; P < 0.05 is represented with (*), P < 0.006 (**), P < 0.0001 (***), and P < 0.0001 (****), asterisks (*) represent the difference between the groups (stress vs. control).
Figure 3
Figure 3
Pressure pain threshold before and after saline/NGF injections. Intramuscular NGF injection leads to an increased pain-related behavior when preceded by repeated restraint stress. (A) First injection, pair-wise comparison of individual data points pre and post injection expressed in log scale, force (in ‘g’ on the left y-axis) required to elicit a pain-related reaction (withdrawal behavior, escape movements, vocalization) using a blunt probe with an area of 3.46 mm2 when applied to the left multifidus muscle of the low back. (B) Individual data points in ratio (in ‘%’), change of pressure of pain threshold shown as effect post/pre. Bars indicate the median for each group. (C) Second injection, pair-wise comparison of individual data points pre and post injection expressed in log scale, force (in ‘g’ on the left y-axis). (D) Individual data points in ratio (in ‘%’), change of pressure pain threshold shown as effect post/pre and bars indicate the median for each group. Effect size is shown as Cohen d. NGF, nerve growth factor. CSN: control + saline + NGF; RSS: repeated restraint stress + saline + saline; CNN: control + NGF + NGF; and RSN: repeated restraint stress + saline + NGF. PD: postnatal day. Black circles: control animals, red squares: stressed animals.
Figure 4
Figure 4
Quantitative analysis of Iba-1 stained microglia cells (ipsilateral side). Repetitive intramuscular NGF injections were associated with a small increase in Iba-1 staining intensity while NGF preceded by adolescent stress was associated with a small increase in number of microglia cells. (A) Intensity of Iba-1 stained microglia cells shown in arbitrary unit. Data expressed as mean ± SEM (based on n = 5 animals/group). Intensity and background was measured for each ROI. The background was subtracted and the mean staining intensity was calculated. (B) Number of Iba-1 stained microglia cells and data expressed as mean ± SEM. Iba-1 stained microglia cells were counted in each ROI (256 × 256 µm2, 20 µm slice thickness, 1.31 nl volume) and the mean was calculated. Iba-1, ionized calcium binding adapter molecule 1; ROI, region of interest; NGF, nerve growth factor. CSN: control + saline + NGF; RSS: repeated restraint stress + saline + saline; CNN: control + NGF + NGF; and RSN: repeated restraint stress + saline + NGF.
Figure 5
Figure 5
Microglia and its states. Intramuscular NGF injection leads to decreased number of microglia cells in surveilling state and increased number of cells in ameboid state when preceded by repeated restraint stress in early adolescence. Insets show representative raw and probability map images of microglia in all four states (scale bars: 5 µm). (A) Number of Iba-1 stained microglia cells in surveilling state. (B) Number of Iba-1 stained microglia cells in hyper-ramified state. (C) Number of Iba-1 stained microglia cells in bushy state. (D) Number of Iba-1 stained microglia cells in ameboid state. Number of microglia cells per state were first averaged across the four ipsilateral ROIs within each animal. Data expressed as mean ± SEM across animals (n = 5 per group); P < 0.05: two-way ANOVA followed by Tukey post hoc analysis and significance is indicated by *. Iba-1, ionized calcium binding adapter molecule 1; NGF, nerve growth factor. CSN: control + saline + NGF; RSS: repeated restraint stress + saline + saline; CNN: control + NGF + NGF; and RSN: repeated restraint stress + saline + NGF.
Figure 6
Figure 6
Shifts in proportion of Iba-1 stained microglia cell states. Repeated restraint stress in adolescence and intramuscular NGF in adulthood leads to increased ameboid state microglia cells in the ipsilateral superficial dorsal horn. (A) Pie charts illustrate the proportion of Iba-1 stained microglia cells in different states in each treatment group on the ipsilateral (ROI’s 1 + 2 + 3 + 4) dorsal horn. (B) Pie charts illustrate the proportion of Iba-1 stained microglia cells in different states in each treatment group on the superficial (ROI’s 1 + 2) and deep (ROI’s 3 + 4) dorsal horn. ROI, region of interest; NGF, nerve growth factor. CSN: control + saline + NGF (721 cells); RSS: repeated restraint stress + saline + saline (707 cells); CNN: control + NGF + NGF (806 cells); and RSN: repeated restraint stress + saline + NGF (886 cells). White: surveilling state; Light grey: hyper-ramified state; Dark grey: bushy state; and Black: ameboid state.
Figure 7
Figure 7
Morphological evaluation of Iba-1 stained microglial cells. For each of the four morphological states (AD), four quantitative measures (ad) were evaluated for each of the four experimental groups (CSN, RSS, CNN, RSN). Total numbers of microglia cells evaluated are given inside respective bars; the ranges of numbers of cells per animal are: (A) Surveilling state: CSN: 16–51, RSS: 13–53, CNN: 34–84, RSN: 1–42; (B) Hyper-ramified state: CSN: 17–39, RSS: 15–45, CNN: 13–42, RSN: 17–47; (C) Bushy state: CSN: 31–98, RSS: 14–144, CNN: 28–87, RSN: 34–128; (D) Ameboid state: CSN: 18–80, RSS: 8–41, CNN: 20–35, RSN: 49–72. Morphological parameters per microglia state were first averaged across all cells within each animal. Data expressed as mean ± SEM across animals (n = 5 per group). P < 0.05: two-way ANOVA followed by Tukey post hoc analysis or U-test of Mann and Whitney and significance is indicated by *. NGF, nerve growth factor. CSN: control + saline + NGF; RSS: repeated restraint stress + saline + saline; CNN: control + NGF + NGF; and RSN: repeated restraint stress + saline + NGF.

References

    1. Knezevic NN, Candido KD, Vlaeyen JWS, Van Zundert J, Cohen SP. Low back pain. Lancet. 2021;398(10294):78–92. doi: 10.1016/S0140-6736(21)00733-9. - DOI - PubMed
    1. Rice ASC, Smith BH, Blyth FM. Pain and the global burden of disease. Pain. 2016;157(4):791–796. doi: 10.1097/j.pain.0000000000000454. - DOI - PubMed
    1. Hoy D, Bain C, Williams G, March L, Brooks P, Blyth F, Woolf A, Vos T, Buchbinder R. A systematic review of the global prevalence of low back pain. Arthritis Rheum. 2012;64(6):2028–2037. doi: 10.1002/art.34347. - DOI - PubMed
    1. Hurwitz EL, Randhawa K, Yu H, Côté P, Haldeman S. The Global Spine Care Initiative: A summary of the global burden of low back and neck pain studies. Eur. Spine J. 2018;27(Suppl 6):796–801. doi: 10.1007/s00586-017-5432-9. - DOI - PubMed
    1. Treede RD, Rief W, Barke A, Aziz Q, Bennett MI, Benoliel R, Cohen M, Evers S, Finnerup NB, First MB, Giamberardino MA, Kaasa S, Korwisi B, Kosek E, Lavand'homme P, Nicholas M, Perrot S, Scholz J, Schug S, Smith BH, Svensson P, Vlaeyen JWS, Wang SJ. Chronic pain as a symptom or a disease: The IASP classification of chronic pain for the international classification of diseases (ICD-11) Pain. 2019;160(1):19–27. doi: 10.1097/j.pain.0000000000001384. - DOI - PubMed

Publication types

Substances