Comprehensive lipidomic profiling by plasma separation cards
- PMID: 36316462
- PMCID: PMC10448968
- DOI: 10.1007/s00216-022-04399-4
Comprehensive lipidomic profiling by plasma separation cards
Abstract
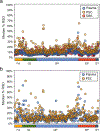
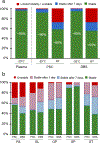
Large-scale lipidomic analyses have been limited by the cost and accessibility of traditional venipuncture sampling. Microsampling techniques offer a less-invasive and more accessible alternative. From a single drop of blood, plasma separation cards (PSC) deliver two volumetric dried plasma samples which are studied here for profiling endogenous blood lipids. Six lots of EDTA-treated human whole blood were used to compare PSC, dried blood spot analyses (DBS), and classic wet plasma extractions. Six replicate extractions were performed for each lot. Nontargeted lipidomics was performed by liquid chromatography-high resolution tandem mass spectrometry. Lipids were annotated by accurate mass/retention time matching and MS/MS spectral library matching using peak intensities for quantitation. Four hundred ninety-eight compounds covering 24 lipid subclasses were annotated. Inter-lot repeatability was evaluated by the percent relative standard deviation (%RSD) for each lot, giving median %RSD values across the lots at 14.6% for PSC, 9.3% for DBS, and 8.6% for wet plasma. Strong correlations of lipid peak intensities between wet plasma and PSCs were observed, but less for DBS. Lipid recovery and stability were comparable between the PSC and DBS samples, with roughly 60% of annotated lipids stable at room temperature after 28 days. Overall, PSCs provide a better alternative for quantitative blood lipidomic analyses compared to dried blood spots. However, problems with lipid stability for samples handled and shipped at room temperature are currently unavoidable outside of a clinical setting. Data transferability and comparability to standard plasma is lipid and lipid class dependent.
Keywords: Lipidomics; Mass spectrometry; Method validation; Microsampling.
© 2022. Springer-Verlag GmbH Germany, part of Springer Nature.
Conflict of interest statement
Figures


Similar articles
-
Dried blood spot microsampling: A semi-quantitative 4D-lipidomics approach using ultrahigh-performance liquid chromatography - high-resolution mass spectrometry (UHPLC - HRMS).Talanta. 2025 May 15;287:127677. doi: 10.1016/j.talanta.2025.127677. Epub 2025 Feb 1. Talanta. 2025. PMID: 39914048
-
Volumetric Absorptive Microsampling of Blood for Untargeted Lipidomics.Molecules. 2021 Jan 7;26(2):262. doi: 10.3390/molecules26020262. Molecules. 2021. PMID: 33430231 Free PMC article.
-
Dried blood spots in clinical lipidomics: optimization and recent findings.Anal Bioanal Chem. 2022 Oct;414(24):7085-7101. doi: 10.1007/s00216-022-04221-1. Epub 2022 Jul 15. Anal Bioanal Chem. 2022. PMID: 35840669 Review.
-
Dried blood spots as a sampling technique for the quantitative determination of guanfacine in clinical studies.Bioanalysis. 2011 Nov;3(22):2501-14. doi: 10.4155/bio.11.262. Bioanalysis. 2011. PMID: 22122599
-
The use of mass spectrometry to analyze dried blood spots.Mass Spectrom Rev. 2016 May-Jun;35(3):361-438. doi: 10.1002/mas.21441. Epub 2014 Sep 22. Mass Spectrom Rev. 2016. PMID: 25252132 Review.
Cited by
-
A global metabolomics minefield: Confounding effects of preanalytical factors when studying rare disorders.Anal Sci Adv. 2023 Jul 21;4(7-8):255-266. doi: 10.1002/ansa.202300010. eCollection 2023 Aug. Anal Sci Adv. 2023. PMID: 38716308 Free PMC article.
-
Blood microsampling technologies: Innovations and applications in 2022.Anal Sci Adv. 2023 May 18;4(5-6):154-180. doi: 10.1002/ansa.202300011. eCollection 2023 Jul. Anal Sci Adv. 2023. PMID: 38716066 Free PMC article. Review.
-
Pre-analytic assessment of dried blood and dried plasma spots: integration in mass spectrometry-based metabolomics and lipidomics workflow.Anal Bioanal Chem. 2025 Apr;417(9):1791-1805. doi: 10.1007/s00216-025-05760-z. Epub 2025 Feb 5. Anal Bioanal Chem. 2025. PMID: 39907755 Free PMC article.
-
LC-MS-Based Global Metabolic Profiles of Alternative Blood Specimens Collected by Microsampling.Metabolites. 2025 Jan 16;15(1):62. doi: 10.3390/metabo15010062. Metabolites. 2025. PMID: 39852404 Free PMC article.
-
Revolutionizing Blood Collection: Innovations, Applications, and the Potential of Microsampling Technologies for Monitoring Metabolites and Lipids.Metabolites. 2024 Jan 11;14(1):46. doi: 10.3390/metabo14010046. Metabolites. 2024. PMID: 38248849 Free PMC article. Review.

