. 2022 Dec;23(12):1788-1798.
doi: 10.1038/s41590-022-01328-6. Epub 2022 Oct 31.

Transcriptional atlas of the human immune response to 13 vaccines reveals a common predictor of vaccine-induced antibody responses

Collaborators, Affiliations

Transcriptional atlas of the human immune response to 13 vaccines reveals a common predictor of vaccine-induced antibody responses

Thomas Hagan et al. Nat Immunol. 2022 Dec.

Abstract

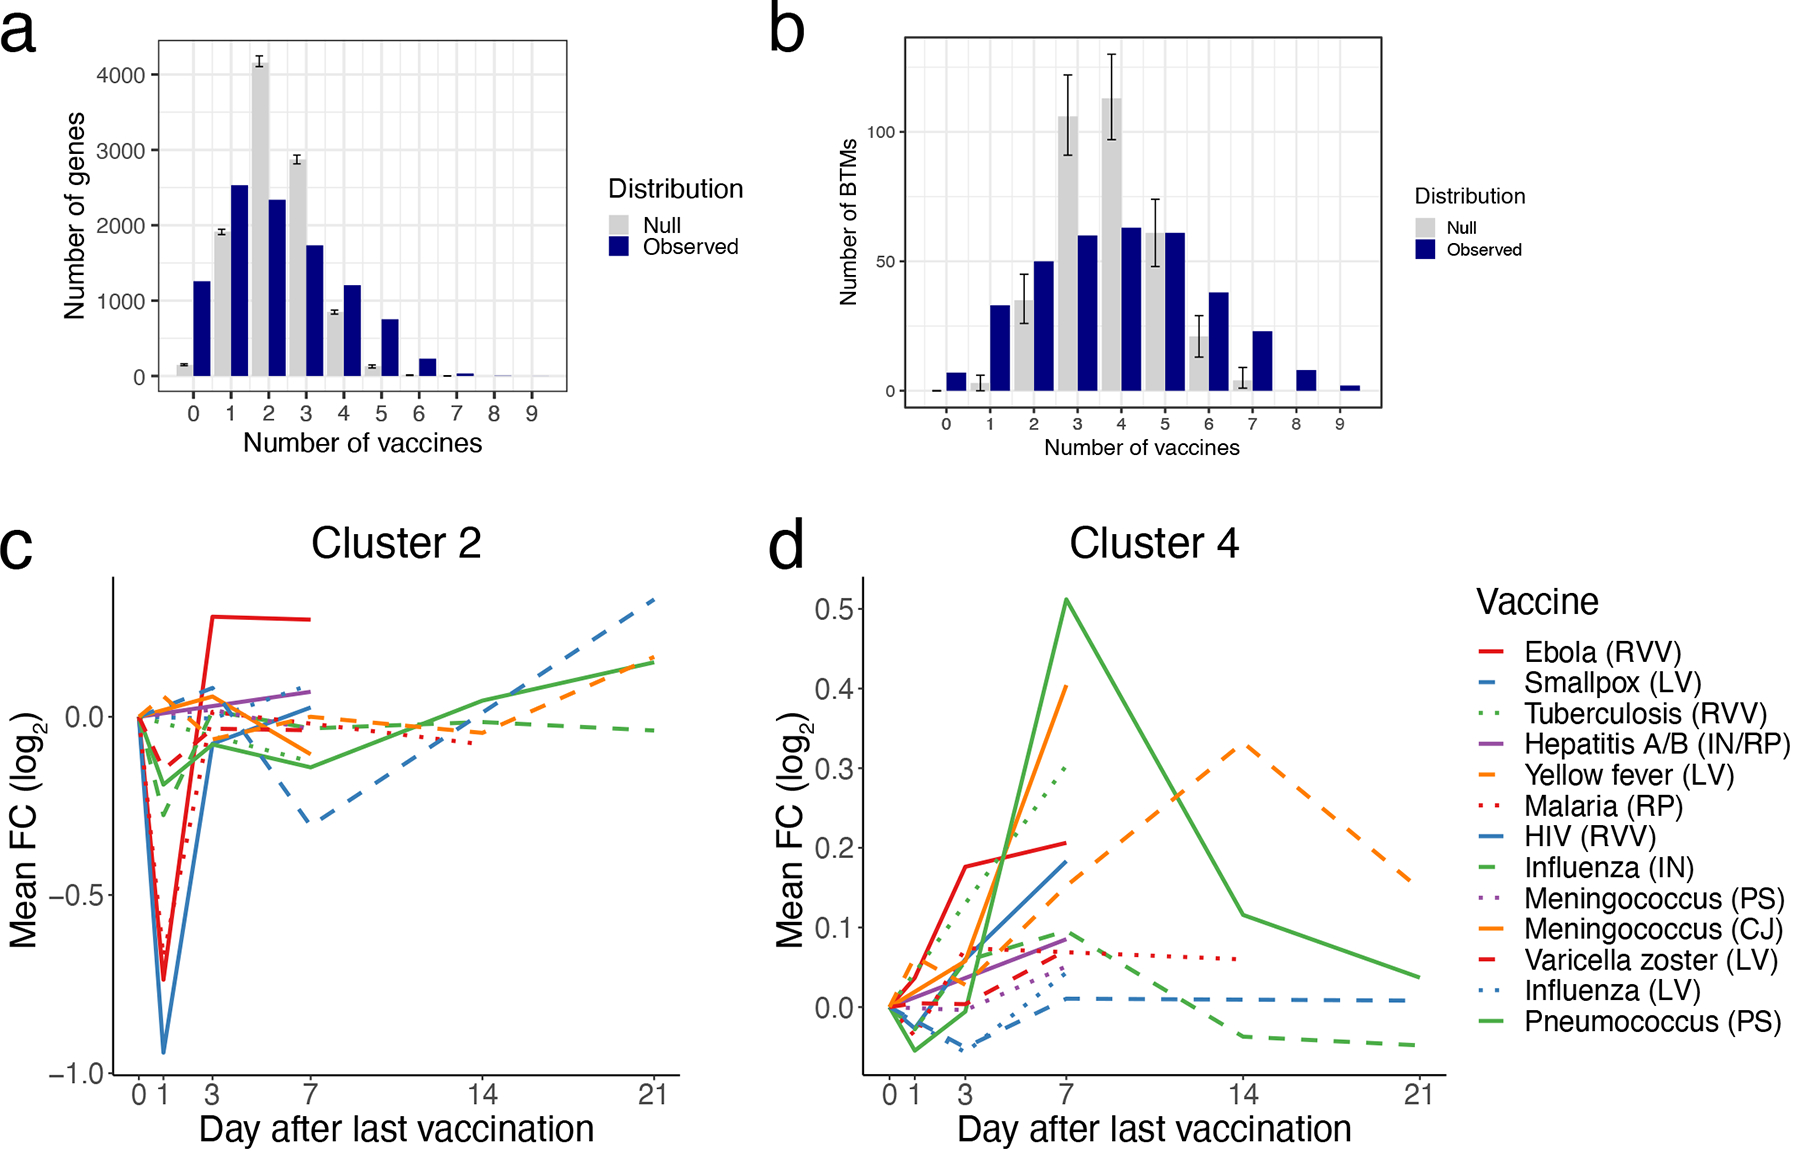
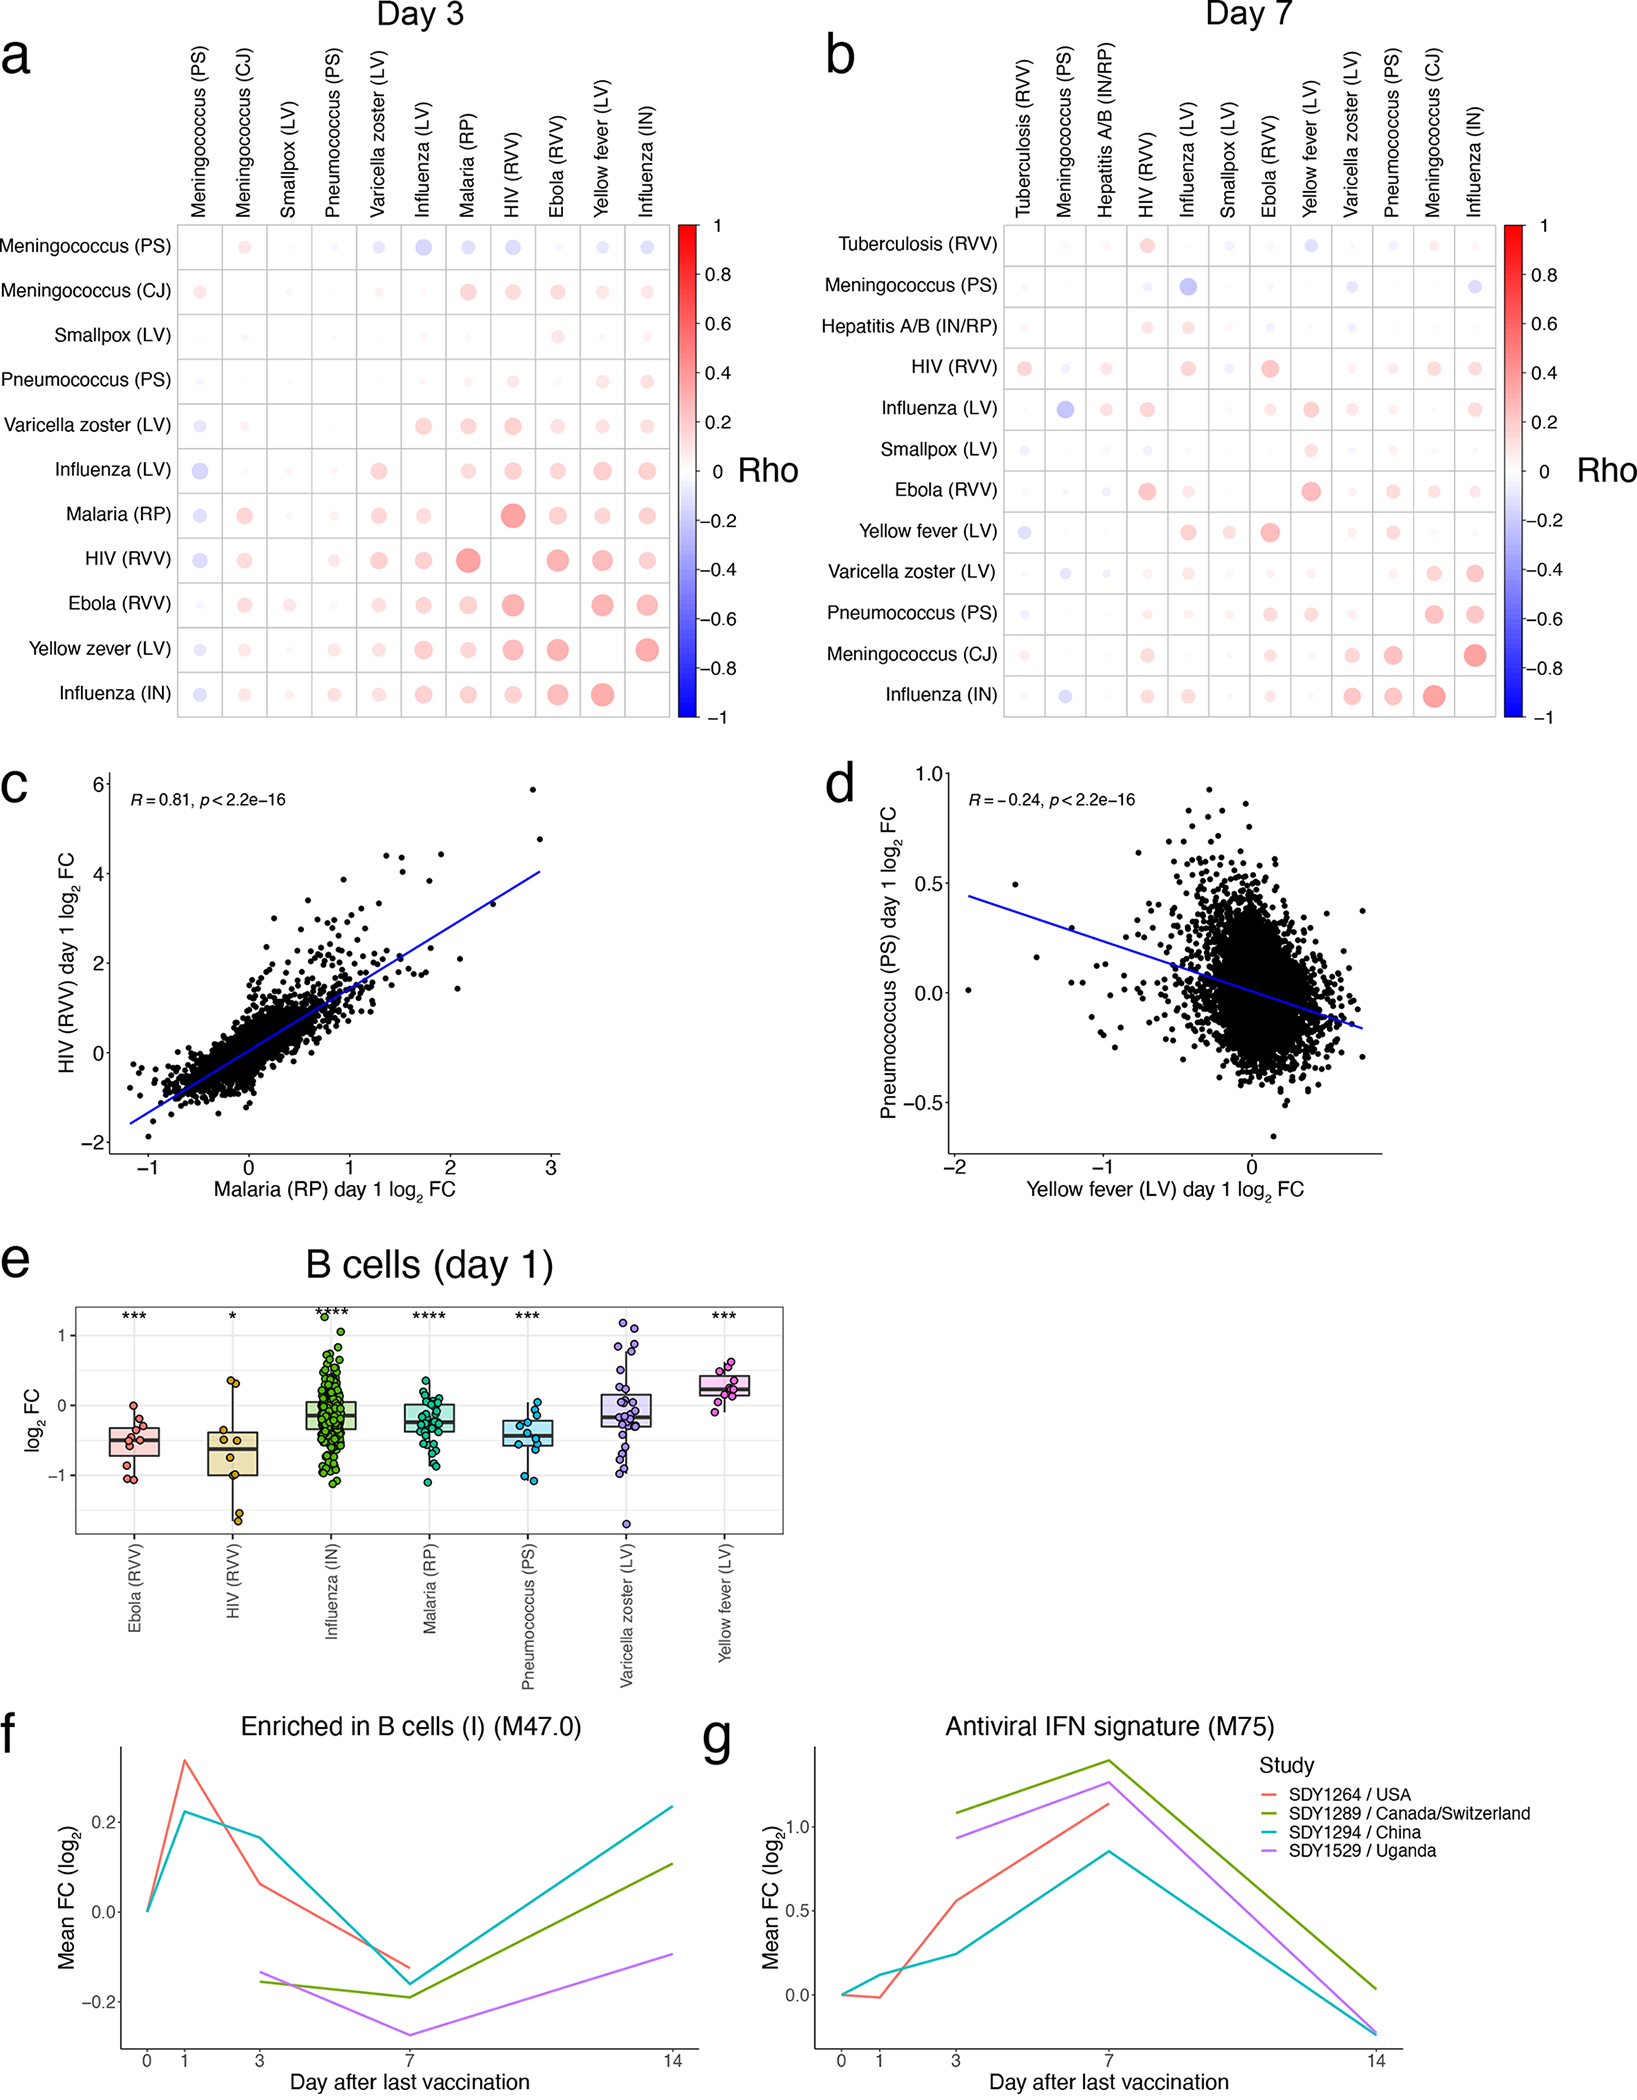
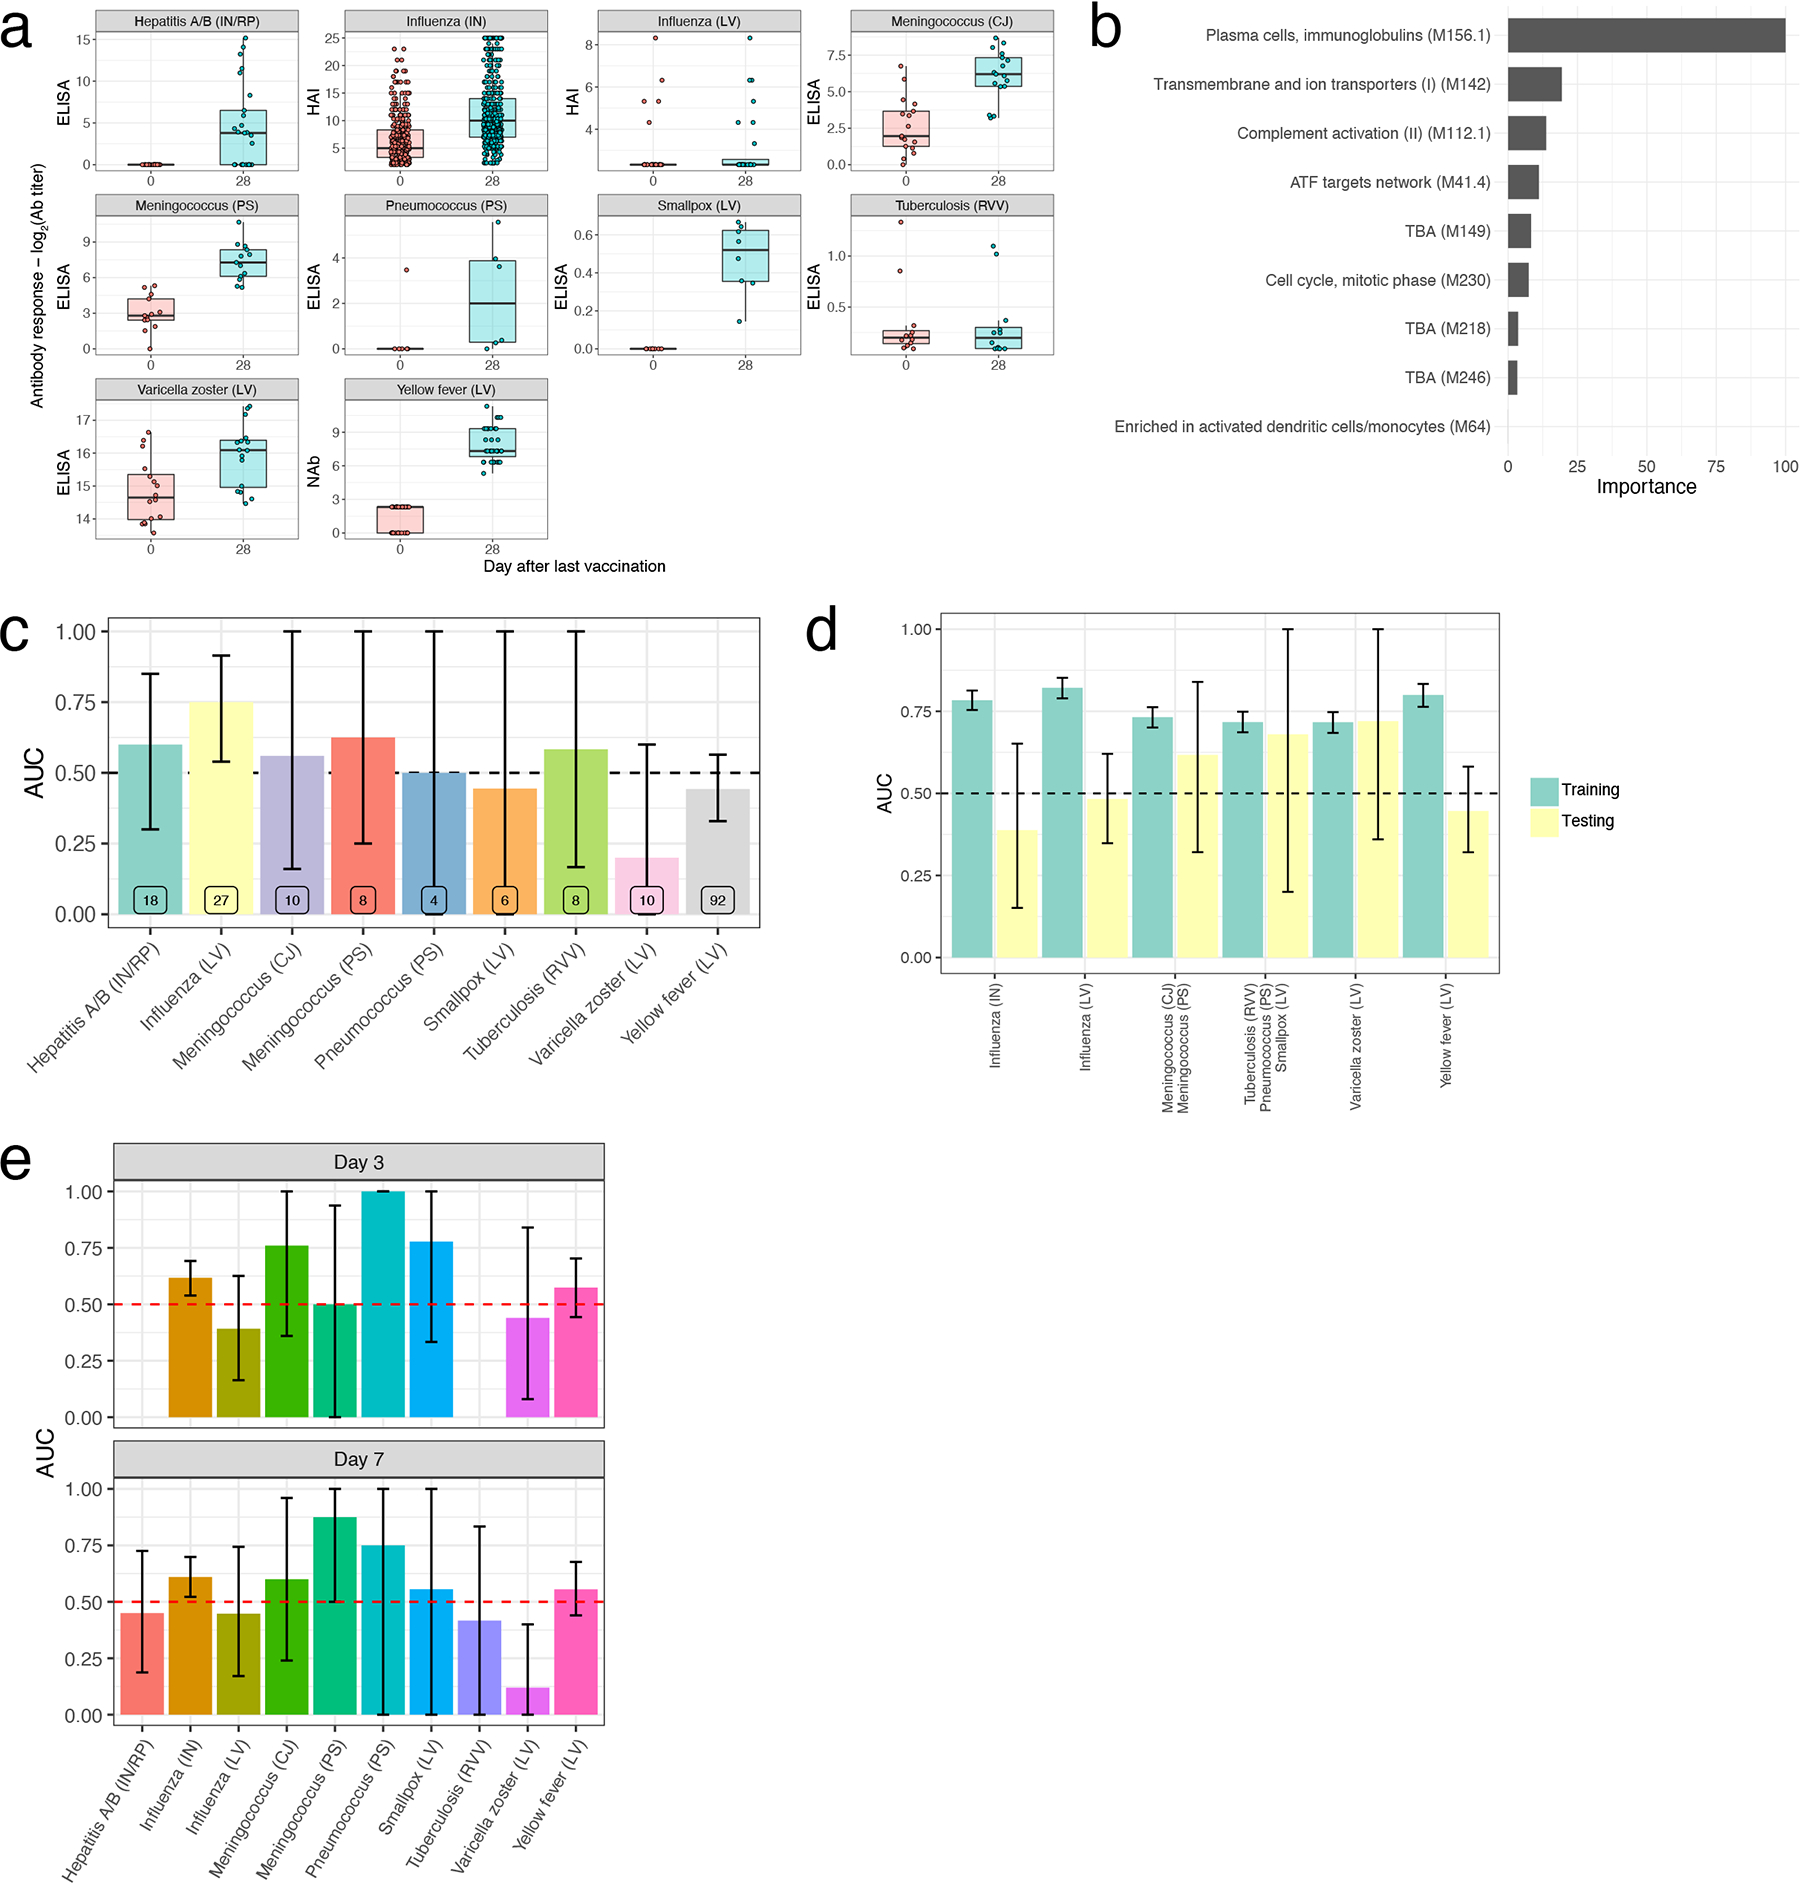
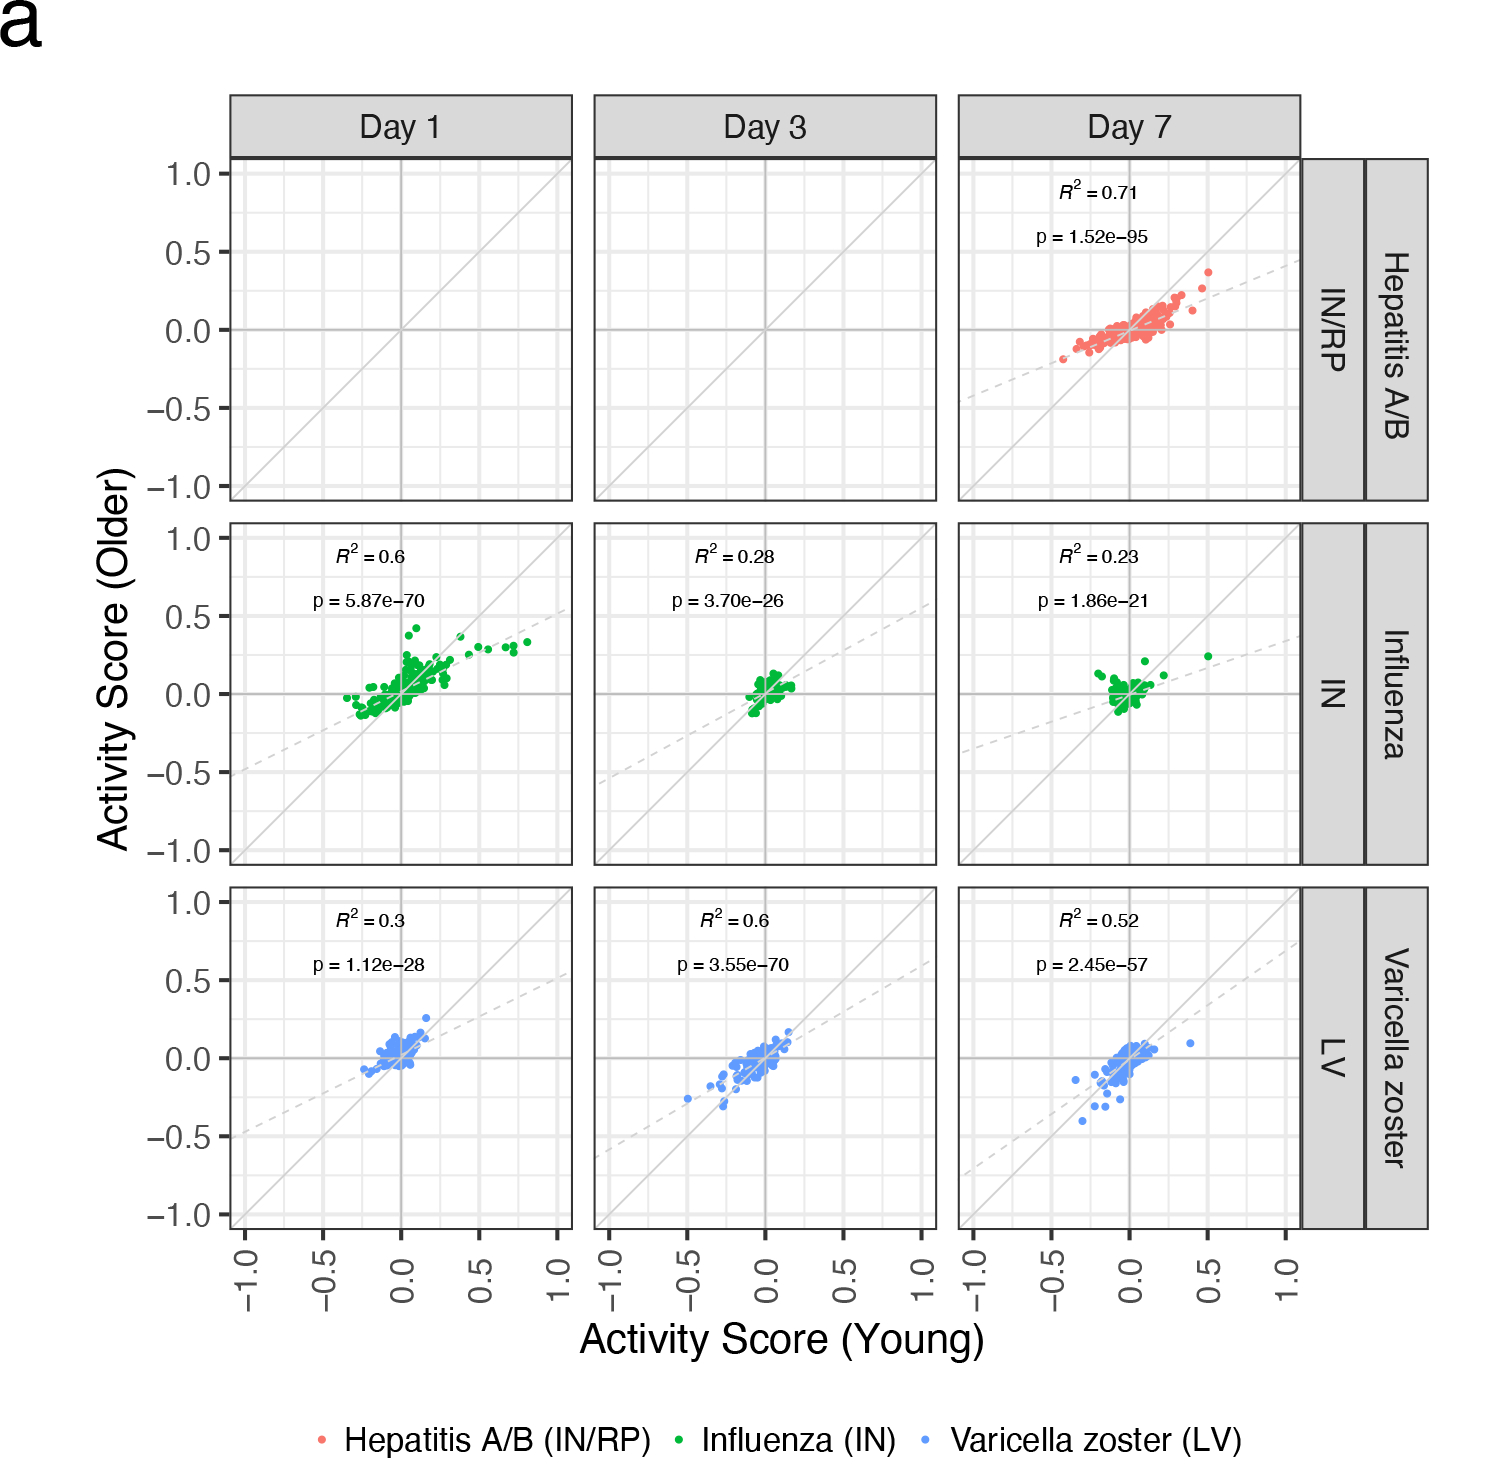
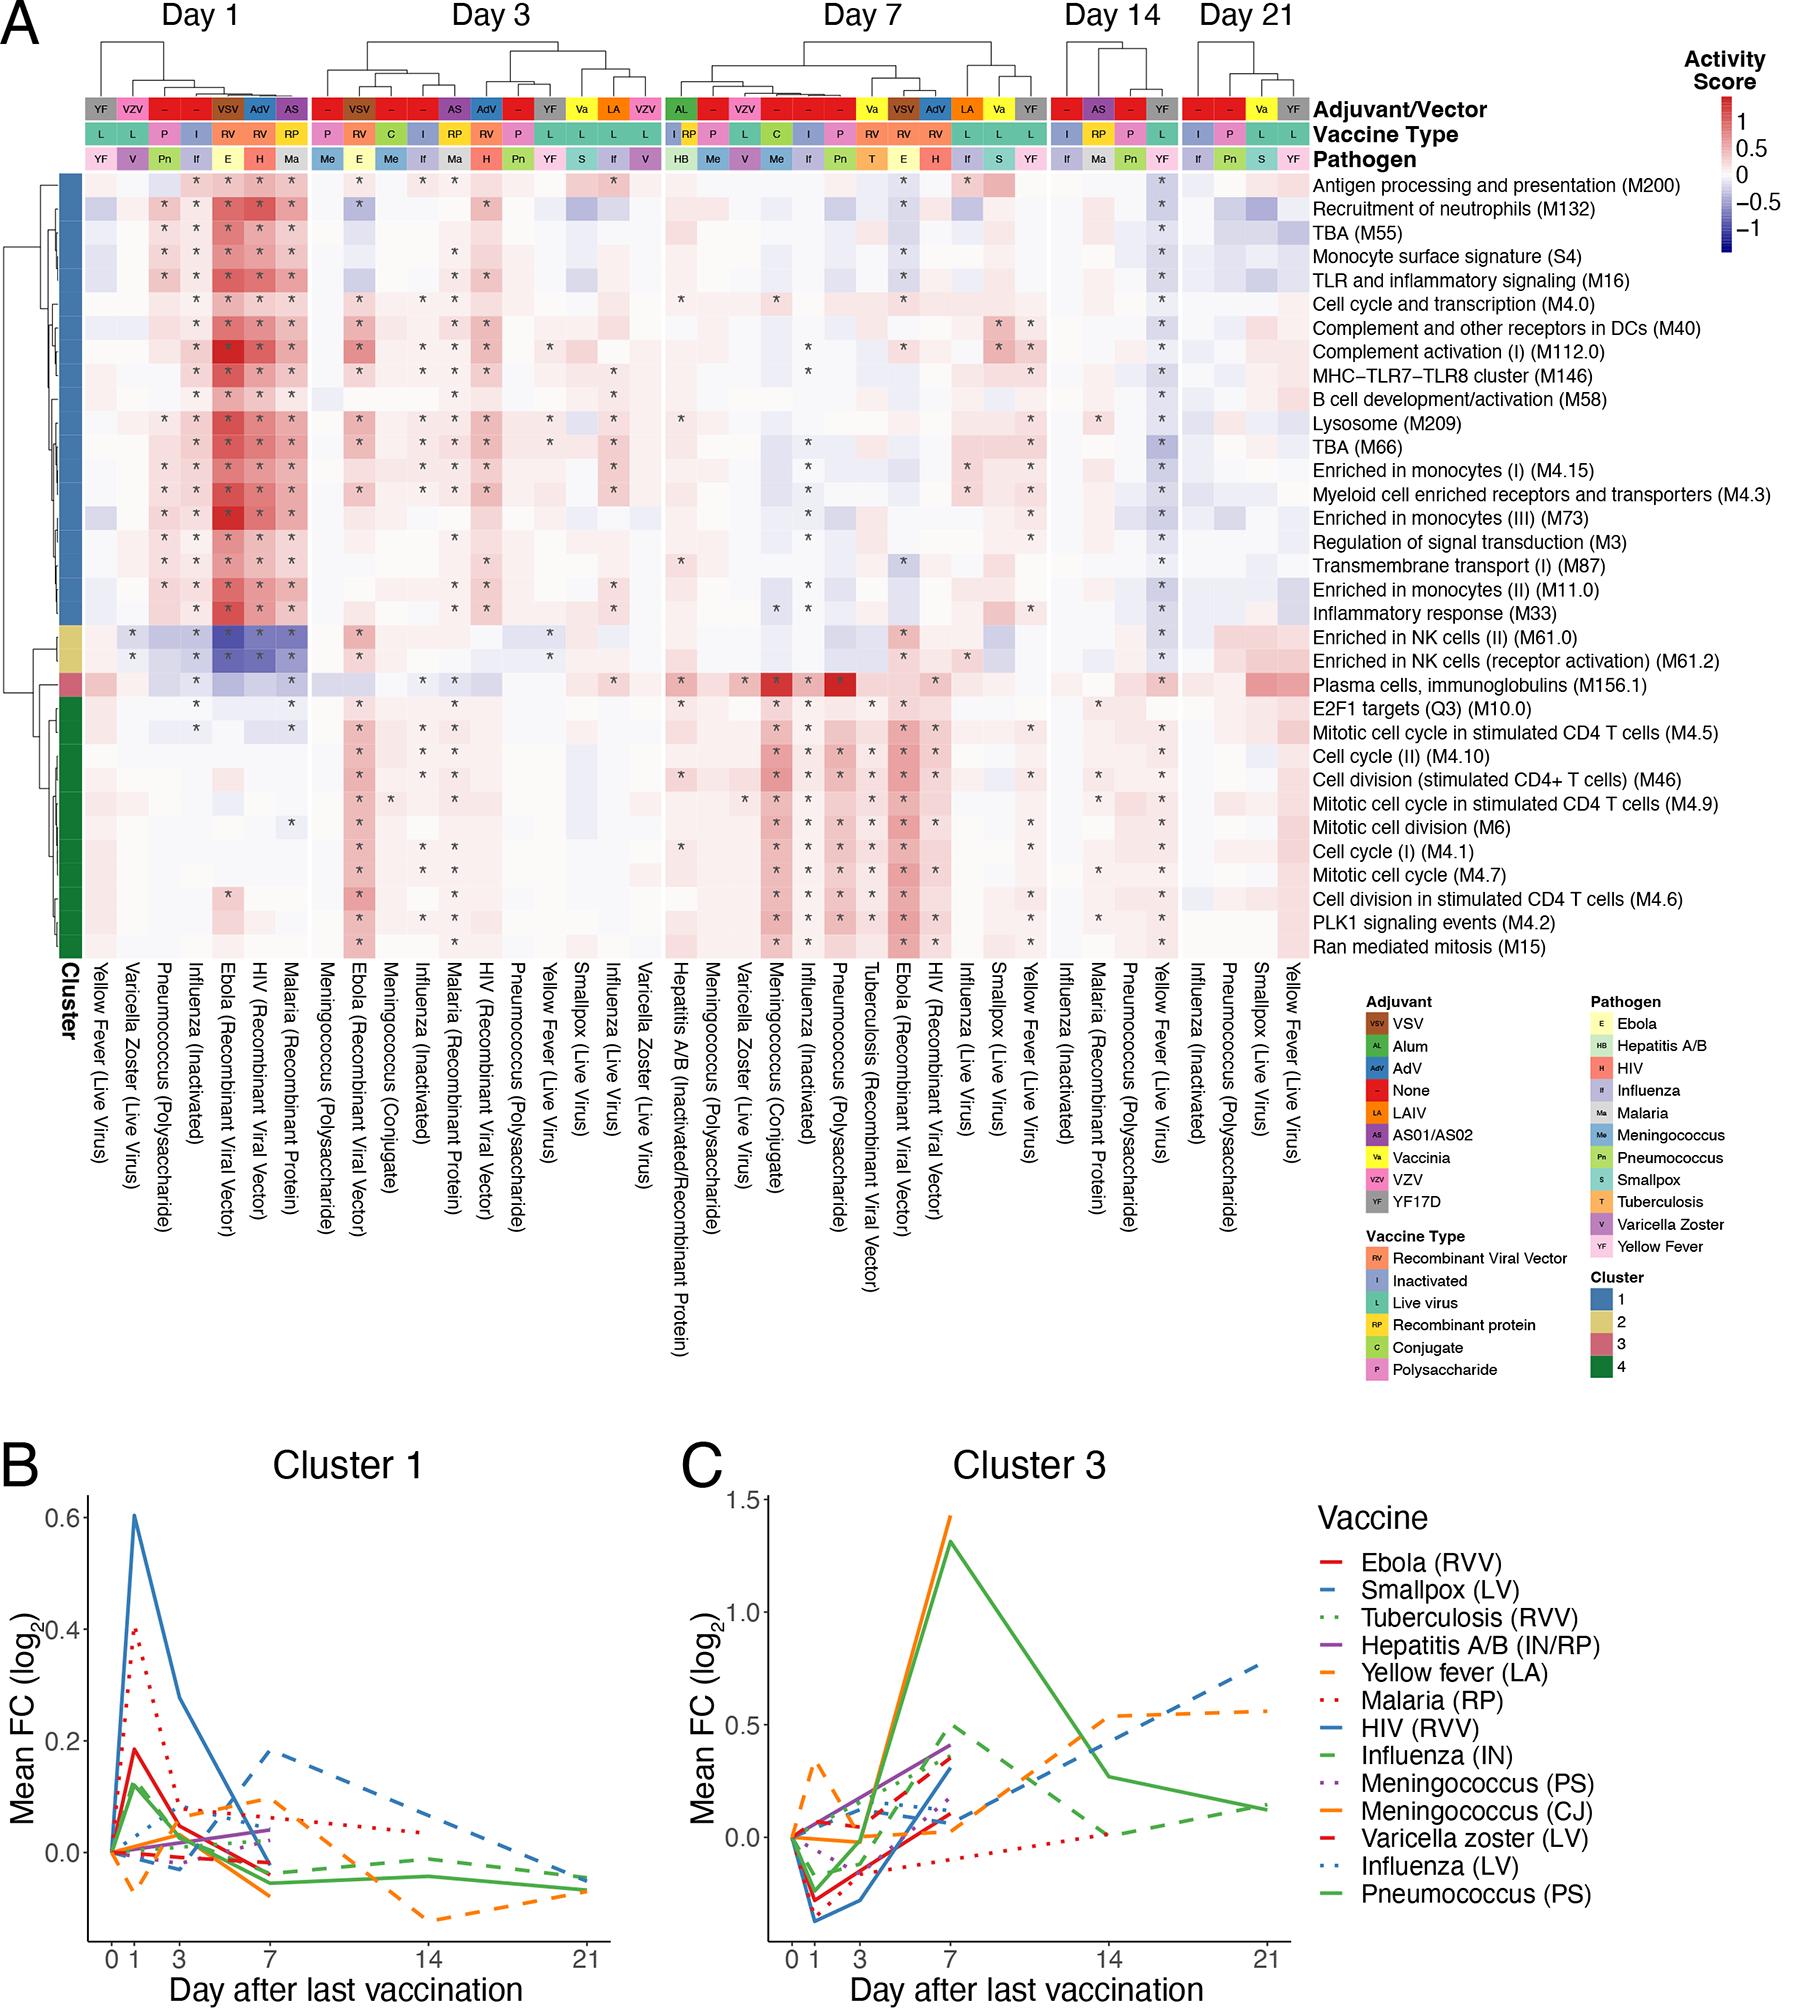
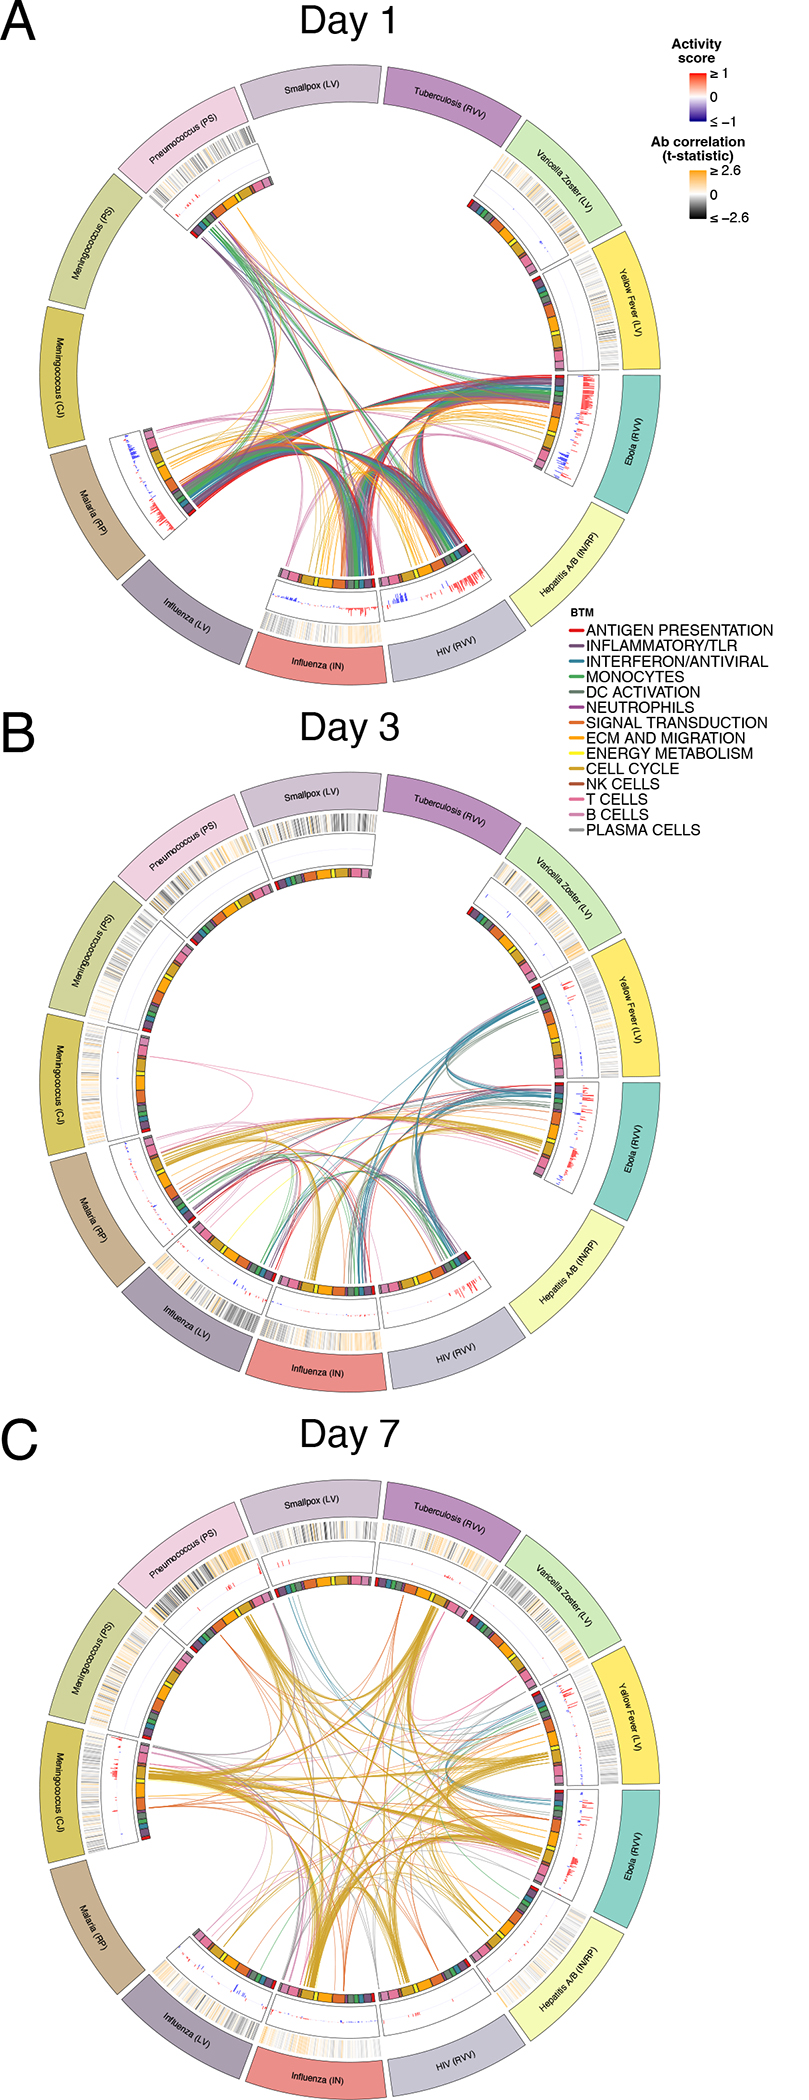
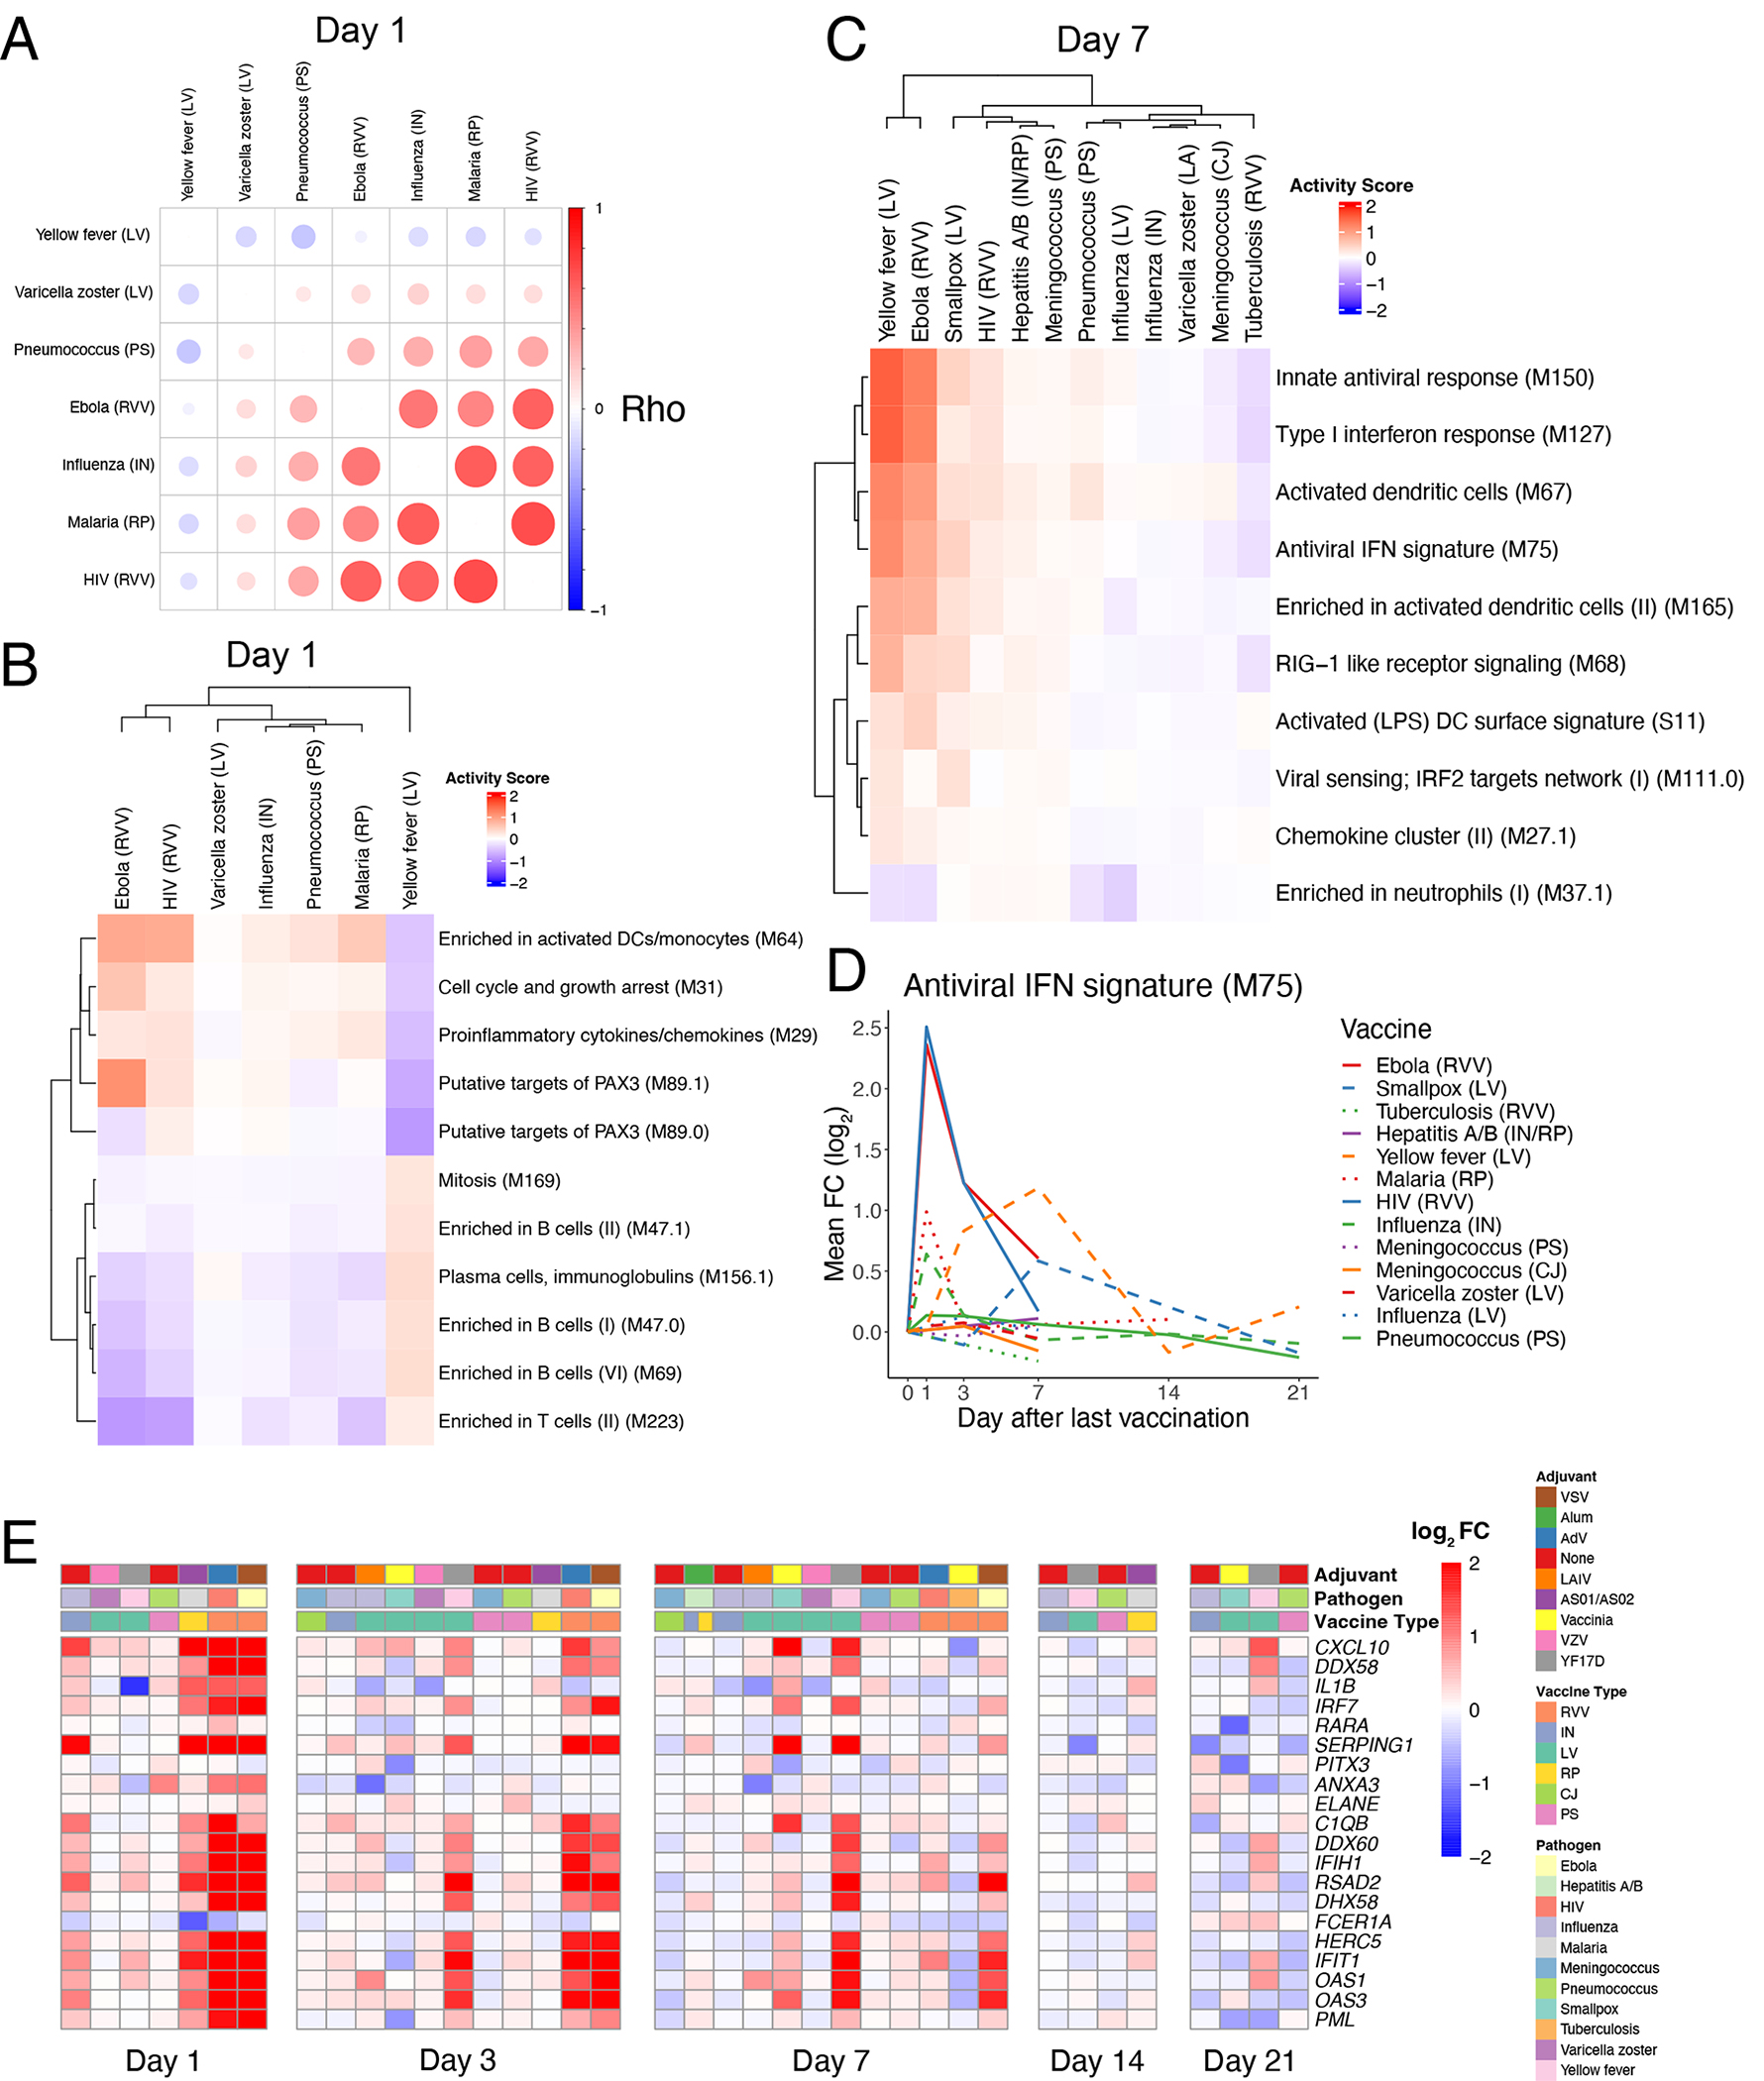
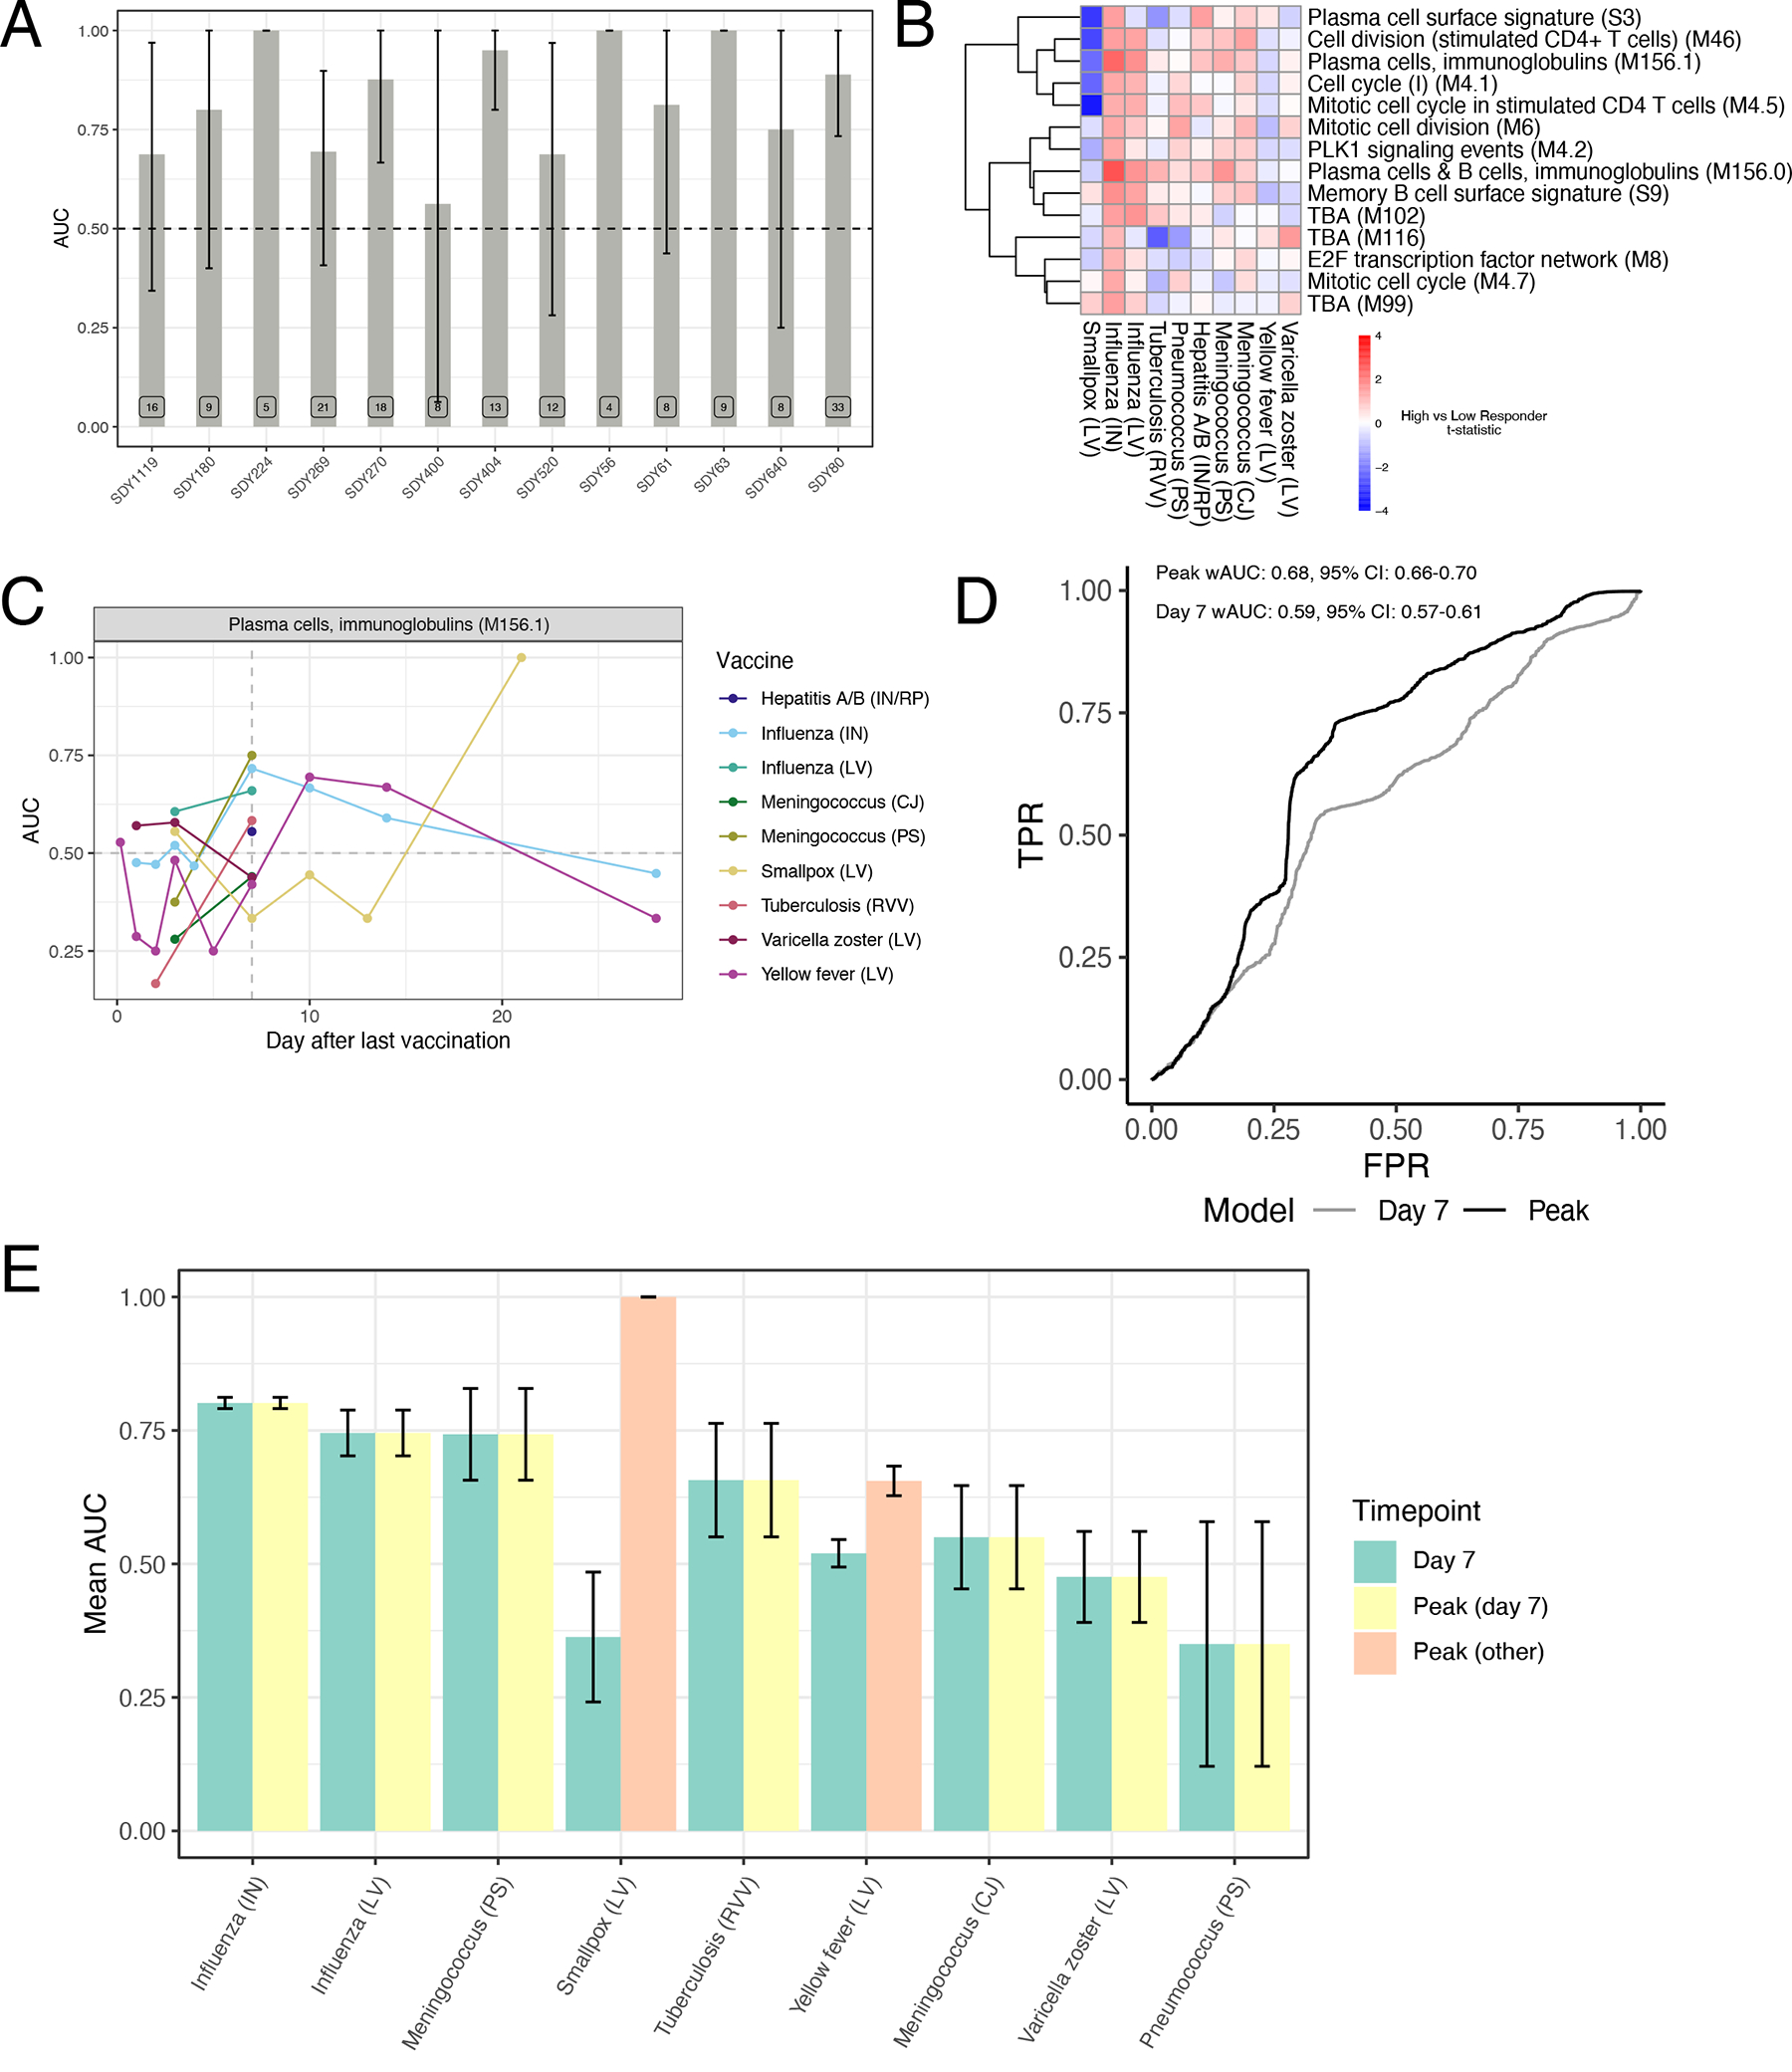
Systems vaccinology has defined molecular signatures and mechanisms of immunity to vaccination. However, comparative analysis of immunity to different vaccines is lacking. We integrated transcriptional data of over 3,000 samples, from 820 adults across 28 studies of 13 vaccines and analyzed vaccination-induced signatures of antibody responses. Most vaccines induced signatures of innate immunity and plasmablasts at days 1 and 7, respectively, after vaccination. However, the yellow fever vaccine induced an early transient signature of T and B cell activation at day 1, followed by delayed antiviral/interferon and plasmablast signatures that peaked at days 7 and 14-21, respectively. Thus, there was no evidence for a 'universal signature' that predicted antibody response to all vaccines. However, accounting for the asynchronous nature of responses, we defined a time-adjusted signature that predicted antibody responses across vaccines. These results provide a transcriptional atlas of immunity to vaccination and define a common, time-adjusted signature of antibody responses.


Conflict of interest statement

Competing Interests

OL is a named inventor on patents held by Boston Children’s Hospital regarding human in vitro systems modeling vaccine action and vaccine adjuvants. BP serves on the External Immunology Network of GSK, and on the scientific advisory board of Medicago, CircBio, Sanofi, EdJen and Boehringer-Ingelheim. SHK receives consulting fees from Northrop Grumman and Peraton. TH owns stock in GSK and Pfizer, Inc. The remaining authors declare no competing interests.

Figures

Extended Data Figure 1.
Extended Data Figure 1.. Overlap in differentially expressed genes/modules and kinetics of common module clusters.
A-B) Histograms of overlap in DEGs (A) or differentially expressed modules (B) between vaccines. A gene/module is shared with another vaccine if it is significantly (FDR < 0.05) regulated in the same direction, irrespective of time point. Blue bars, number of genesets shared (y-axis) between the same number of vaccines (x-axis). Grey bars represent the null distribution generated by n=10,000 permutations of gene/module labels within vaccine + timepoint groups. Data are presented as mean values +/− 95% confidence interval. C) Kinetics of the mean FC of cluster 2 BTMs across vaccines. D) Kinetics of the mean FC of cluster 4 modules across vaccines.
Extended Data Figure 2.
Extended Data Figure 2.. Gene-level correlations between vaccines and estimated cell frequencies.
A) Correlation matrix of pairwise Spearman correlations of Day 3 gene-level fold changes between vaccines. B) Correlation matrix of pairwise Spearman correlations of Day 7 gene-level fold changes between vaccines. C) Scatterplot of Day 1 gene FCs between HIV and Malaria vaccines. D) Scatterplot of Day 1 gene FCs between Yellow Fever and Pneumococcus vaccines. E) Boxplot of Day 1 FC in xCell31 estimated B cell frequencies across vaccines. Center line, median; box limits, upper and lower quartiles; whiskers, 1.5x interquartile range. Ebola (RVV): n=11, HIV (RVV): n=10, Influenza (IN): n=298, Malaria (RP): n=42, Pneumococcus (PS): n=12, Varicella Zoster (LA): n=31, Yellow Fever (LA): n=11. F-G) Kinetics of the mean FC of modules (F) M47.0 and (G) M75 across YF vaccine studies. In C-D, correlation coefficient and p value determined via Pearson correlation. In E, statistical differences were determined via two-sided paired Student’s t-tests within each study and integrating p values across studies within each vaccine using Stouffer’s method (see Methods for further details). *p < 0.05, **p < 0.01, ***p < 0.001, **** p < 0.0001.
Extended Data Figure 3.
Extended Data Figure 3.. Impact of pre-existing antibody levels on transcriptional responses to influenza vaccination.
A) Differentially expressed modules at Day 1 (FDR <0.05, t-test between mean fold changes) between participants with high and low baseline antibody titers (negative score indicates increased expression in the low baseline antibody group). Differentially expressed modules at Day 7 between high and low baseline antibody groups. C-D) Boxplots of (C) IFN signature module M75 expression at Day 1 and (D) plasma cell module M156.1 expression at Day 7 between high and low baseline antibody groups at Day 1. Center line, median; box limits, upper and lower quartiles; whiskers, 1.5x interquartile range. Day 1: SDY1276_D: High – n=35, Low – n=31; SDY1276_V: High – n=31, Low – n=31; SDY180: High – n=4, Low – n=4; SDY56: High – n=4, Low – n=7; SDY80: High – n=14, Low – n=14. Day 7: SDY1119: High – n=6, Low – n=6; SDY180: High – n=4, Low – n=4; SDY270: High – n=10, Low – n=9; SDY56: High – n=4, Low – n=7; SDY61: High – n=3, Low – n=3; SDY63: High – n=3, Low – n=4; SDY640: High – n=6, Low – n=4; SDY80: High – n=13, Low – n=13. E-F) Line graphs of (E) M75 and (F) M156.1 expression across time in high and low baseline antibody groups. Error bars represent standard error of the mean. Day 1: High – n=88, Low – n=87; Day 3: High – n=83, Low – n=88; Day 7: High – n=49, Low – n=50; Day 14: High – n=64, Low – n=66; In C-F, statistical differences were determined via two-sided unpaired Student’s t-tests. *p < 0.05, **p < 0.01, ***p < 0.001.
Extended Data Figure 4.
Extended Data Figure 4.. Antibody response prediction across vaccines.
A) Boxplots of Day 30 antibody responses to vaccination across vaccines. Center line, median; box limits, upper and lower quartiles; whiskers, 1.5x interquartile range. Hepatitis A/B (IN/RP): n=25, Influenza (IN): n=412, Influenza (LA): n=28, Meningococcus (CJ): n=17, Meningococcus (PS): n=13, Pneumococcus (PS): n=6, Smallpox (LA): n=8, Tuberculosis (RVV): n=12, Varicella Zoster (LA): n=16, Yellow Fever (LA): n=35. B) Barplot of feature importance for the GLM classifier trained on inactivated influenza datasets only. C) AUC barplot of antibody response prediction performance across vaccines for the GLM classifier trained on inactivated influenza datasets only. Data are presented as mean values +/− 95% confidence interval. n=2000 bootstrap replicates. D) AUC barplot of antibody response prediction performance of the leave-one-vaccine-out GLM classifier. Data are presented as mean values +/− 95% confidence interval. n=2000 bootstrap replicates. E) AUC barplot of antibody response prediction performance of the 10-fold cross-validation GLM classifier. Data are presented as mean values +/− 95% confidence interval. n=2000 bootstrap replicates.
Extended Data Figure 5.
Extended Data Figure 5.. Comparison of common transcriptional responses between age groups.
A) Scatterplots of module activity scores in each vaccine among young (x-axis) and older participants (y-axis) of the most commonly expressed modules (Figure 2A) on days 1–7. Correlation coefficient and p value determined via Pearson correlation.
Figure 1.
Figure 1.. An integrated database of transcriptional responses to vaccination.
A) Workflow for collection, curation, and standardization of datasets in the Immune Signatures Data Resource. B) Histogram of the number of samples included per vaccine at each timepoint. Day 0 represents Day of vaccination. C) Age distribution of participants in the Immune Signatures Data Resource by vaccine. Shape of points denotes the subject’s inferred sex based on Y chromosome-specific gene expression. For participants with missing age data, ages were estimated using RAPToR. Center line, median; box limits, upper and lower quartiles; whiskers, 1.5x interquartile range. Ebola (RVV): n=13, Hepatitis A/B (IN/RP): n=26, HIV (RVV): n=10, Influenza (IN): n=496, Influenza (LA): n=28, Malaria (RP): n=44, Meningococcus (CJ): n=19, Meningococcus (PS): n=14, Pneumococcus (PS): n=12, Smallpox (LA): n=8, Tuberculosis (RVV): n=12, Varicella Zoster (LA): n=31, Yellow Fever (LA): n=107. D) Bar plot representing the proportion of variance in post-vaccination transcriptional responses that can be attributed to clinical (age, sex, ethnicity) and experimental variables (time after vaccination, vaccine) via Principal Component Variance Analysis. The residual represents the proportion of the variance that could not be explained by any of the included variables.
Figure 2.
Figure 2.. Common and unique transcriptional responses across different vaccines.
A) Heatmap of common differentially expressed modules (regulated in 7 or more vaccines) over time (*FDR<0.05). Color represents the QuSAGE activity score. Clustering on columns was performed separately for Days 1, 3, 7, 14, and 21 post-vaccination. TBA – To be annotated. B) Kinetics of the mean FC of cluster 1 modules across vaccines C) Kinetics of the mean FC of cluster 3 modules across vaccines.
Figure 3.
Figure 3.. Overlap in transcriptional responses across vaccines.
A-C) Circos plots of the overlap in differentially expressed modules (FDR<0.05) across vaccines on Days (A) 1, (B) 3, and (C) 7. Each segment of the circle represents one vaccine, and each point in a segment represents a single module. Heatmaps in the outermost ring represent correlation with Day 28 antibody responses, and bars in middle ring represent the activity score of differentially expressed modules. Lines connect modules with a significant positive score shared between vaccines. Inner ring boxes and line colors represent the functional groups of the modules.
Figure 4.
Figure 4.. Early adaptive and delayed innate transcriptional signatures of yellow fever vaccine.
A) Correlation matrix of pairwise Spearman correlations of Day 1 gene-level fold changes between vaccines. B) Heatmap of Day 1 activity scores of modules differentially expressed in response to YF vaccination (QuSAGE FDR<0.2). C) Heatmap of Day 7 activity scores of modules differentially expressed in response to YF vaccination (QuSAGE FDR<0.05, activity score >0.2). D) Kinetics of the mean FC of module M75 across vaccines. E) Heatmap of the post-vaccination FC of genes in module M75.
Figure 5.
Figure 5.. Time-adjusted transcriptional predictors of antibody responses.
A) Area under the ROC curve (AUC) barplot of antibody response prediction performance per dataset for the elastic net classifier trained on inactivated influenza datasets only. Data are presented as mean values +/− 95% confidence interval. n=2000 bootstrap replicates. B) Heatmap of high versus low antibody responder difference across vaccines of modules differentially expressed (FDR<0.05) between high and low antibody responders to inactivated influenza vaccination. C) Kinetics of the predictive power of M156.1 across vaccines. For each vaccine/timepoint combination, the AUC is computed based on difference in the geometric mean of the fold changes of the genes in the M156.1 between high and low responders (see Methods for details). D) Weighted ROC curves for a logistic regression classifier using M156.1 expression either at Day 7 in all vaccines (Day 7) or at the vaccine-specific peak expression timepoint (Peak). E) Per vaccine AUC barplot for a logistic regression classifier using M156.1 expression either at Day 7 in all vaccines (yellow) or at the vaccine-specific peak expression timepoint (green – peak at Day 7, pink – peak at other timepoints). Data are presented as mean values +/− 95% confidence interval. n=2000 bootstrap replicates.
Figure 6.
Figure 6.. Impact of aging on transcriptional responses to vaccination.
A) Boxplots of Day 30 antibody responses to vaccination in young (≤50) and older (≥60) participants across vaccines. Center line, median; box limits, upper and lower quartiles; whiskers, 1.5x interquartile range. Hepatitis A/B (IN/RP) − Young: n=25, Hepatitis A/B (IN/RP) − Older: n=135, Influenza (IN) − Young: n=123, Influenza (IN) − Older: n=175, Varicella Zoster (LA) − Young: n=16, Varicella Zoster (LA) − Older: n=19. B) Modules differentially expressed between young and older participants in response to inactivated influenza vaccination (QuSAGE FDR<0.05). C) Network plot of module M75 on Day 1 following inactivated influenza vaccination in young and older participants. Each edge represents a co-expression relationship, as described in Li et al.; colors represent the Day 1 log2 FC. D) Barplot of the Day 7 AUC of module M156.1 across vaccines in young and older participants. Data are presented as mean values +/− 95% confidence interval. n=2000 bootstrap replicates.

Comment in

References

    1. Hagan T, Nakaya HI, Subramaniam S, Pulendran B. Systems vaccinology: Enabling rational vaccine design with systems biological approaches. Vaccine. 2015;33(40):5294–301. - PMC - PubMed
    1. Pulendran B Systems vaccinology: probing humanity’s diverse immune systems with vaccines. Proc Natl Acad Sci U S A. 2014;111(34):12300–6. - PMC - PubMed
    1. Querec TD, Akondy RS, Lee EK, Cao W, Nakaya HI, Teuwen D, Pirani A, Gernert K, Deng J, Marzolf B, Kennedy K, Wu H, Bennouna S, Oluoch H, Miller J, Vencio RZ, Mulligan M, Aderem A, Ahmed R, Pulendran B. Systems biology approach predicts immunogenicity of the yellow fever vaccine in humans. Nat Immunol. 2009;10(1):116–25. - PMC - PubMed
    1. Gaucher D, Therrien R, Kettaf N, Angermann BR, Boucher G, Filali-Mouhim A, Moser JM, Mehta RS, Drake DR 3rd, Castro E, Akondy R, Rinfret A, Yassine-Diab B, Said EA, Chouikh Y, Cameron MJ, Clum R, Kelvin D, Somogyi R, Greller LD, Balderas RS, Wilkinson P, Pantaleo G, Tartaglia J, Haddad EK, Sekaly RP. Yellow fever vaccine induces integrated multilineage and polyfunctional immune responses. J Exp Med. 2008;205(13):3119–31. - PMC - PubMed
    1. Nakaya HI, Wrammert J, Lee EK, Racioppi L, Marie-Kunze S, Haining WN, Means AR, Kasturi SP, Khan N, Li GM, McCausland M, Kanchan V, Kokko KE, Li S, Elbein R, Mehta AK, Aderem A, Subbarao K, Ahmed R, Pulendran B. Systems biology of vaccination for seasonal influenza in humans. Nat Immunol. 2011;12(8):786–95. - PMC - PubMed

Methods References:

    1. Irizarry RA et al. Exploration, normalization, and summaries of high density oligonucleotide array probe level data. Biostatistics 4, 249–264 (2003). - PubMed
    1. Law CW, Chen Y, Shi W & Smyth GK voom: Precision weights unlock linear model analysis tools for RNA-seq read counts. Genome Biol 15, R29 (2014). - PMC - PubMed
    1. Dewey M metap: meta-analysis of significance values. R package version 1.8; 2022.
    1. Yaari G, Bolen CR, Thakar J & Kleinstein SH Quantitative set analysis for gene expression: a method to quantify gene set differential expression including gene-gene correlations. Nucleic Acids Res 41, e170 (2013). - PMC - PubMed

Publication types