. 2022 Dec;23(12):1777-1787.
doi: 10.1038/s41590-022-01329-5. Epub 2022 Oct 31.

Pan-vaccine analysis reveals innate immune endotypes predictive of antibody responses to vaccination

Collaborators, Affiliations

Pan-vaccine analysis reveals innate immune endotypes predictive of antibody responses to vaccination

Slim Fourati et al. Nat Immunol. 2022 Dec.

Abstract

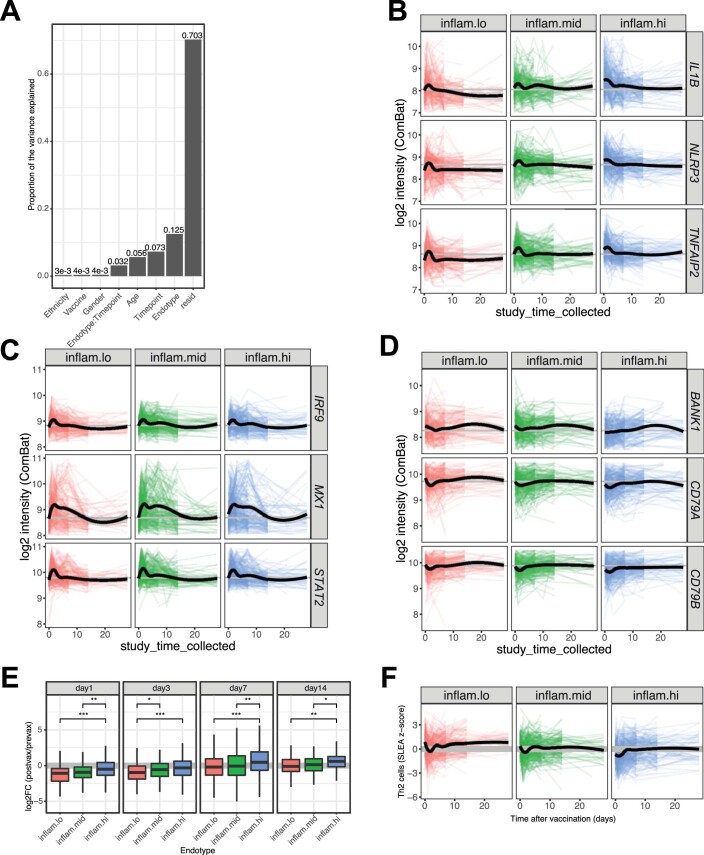
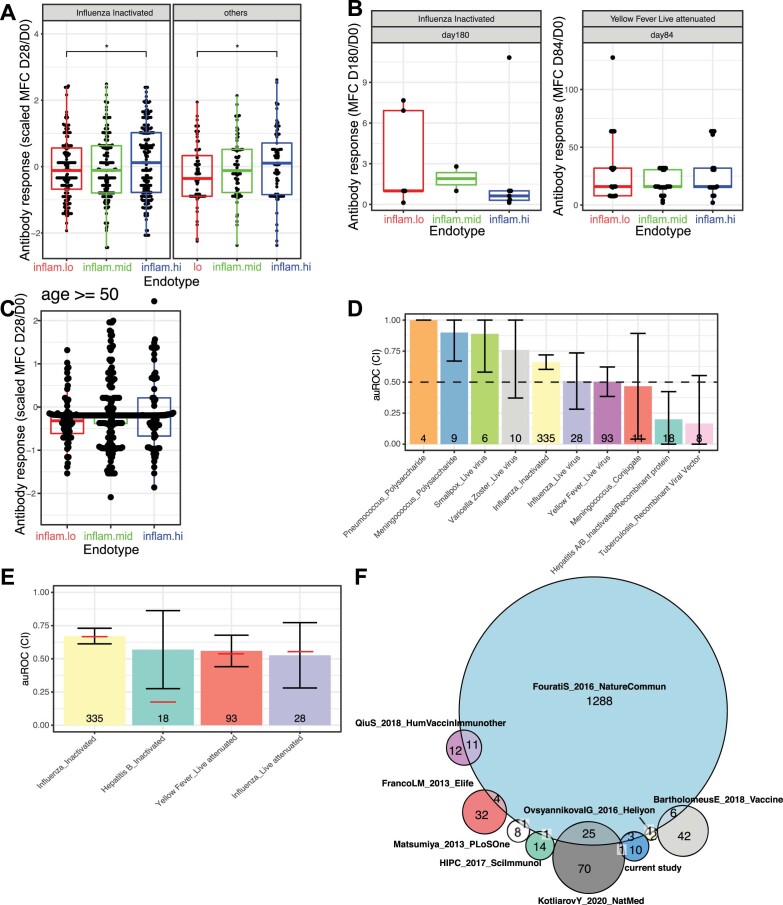
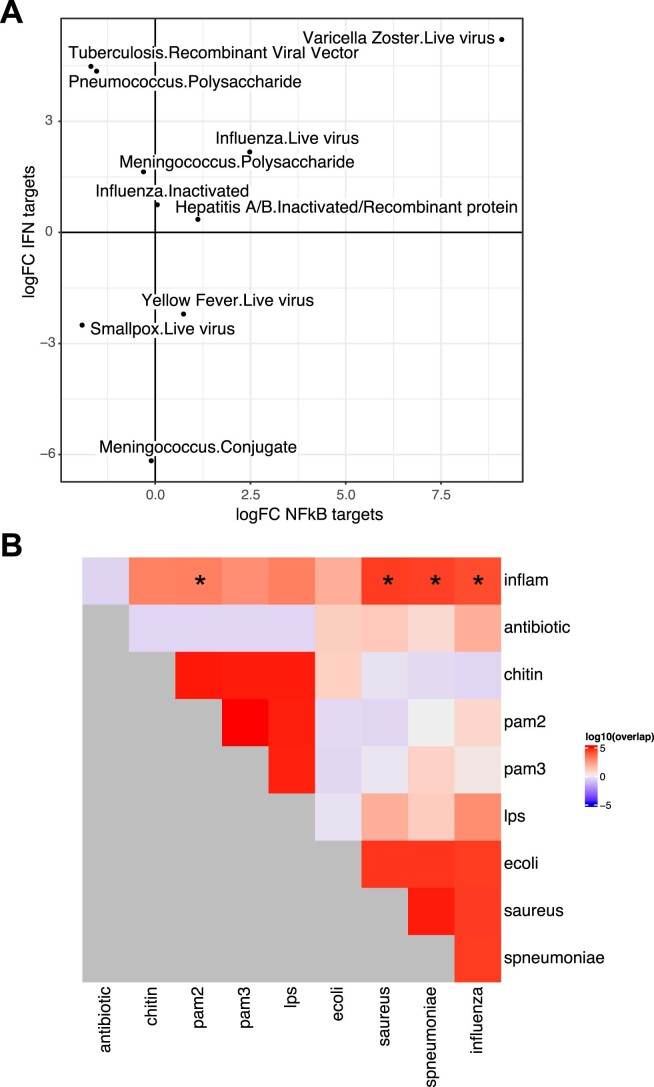
Several studies have shown that the pre-vaccination immune state is associated with the antibody response to vaccination. However, the generalizability and mechanisms that underlie this association remain poorly defined. Here, we sought to identify a common pre-vaccination signature and mechanisms that could predict the immune response across 13 different vaccines. Analysis of blood transcriptional profiles across studies revealed three distinct pre-vaccination endotypes, characterized by the differential expression of genes associated with a pro-inflammatory response, cell proliferation, and metabolism alterations. Importantly, individuals whose pre-vaccination endotype was enriched in pro-inflammatory response genes known to be downstream of nuclear factor-kappa B showed significantly higher serum antibody responses 1 month after vaccination. This pro-inflammatory pre-vaccination endotype showed gene expression characteristic of the innate activation state triggered by Toll-like receptor ligands or adjuvants. These results demonstrate that wide variations in the transcriptional state of the immune system in humans can be a key determinant of responsiveness to vaccination.


Conflict of interest statement

O.L. is a named inventor on patents held by Boston Children’s Hospital regarding human in vitro systems modeling vaccine action and vaccine adjuvants. B.P. serves on the External Immunology Network of GSK, and on the scientific advisory board of Medicago, CircBio, Sanofi, EdJen and Boehringer-Ingelheim. S.H.K. receives consulting fees from Northrop Grumman and Peraton. T.H. owns stock in GSK and Pfizer. The remaining authors declare no competing interests.

Figures

Fig. 1
Fig. 1. Creation of a combined dataset of transcriptional responses to vaccination across diverse vaccine platforms and target pathogens.
a, Flowchart describing the collection, curation, standardization and preprocessing steps leading to the creation of the vaccine transcriptomics compendium. b, Histogram of the time points before (days −7 and 0) and after (days > 0) vaccination available in the Immune Signatures Data Resource. In the plot, each vaccine is represented by a different color, while the size of the bar is proportional to the number of samples with available transcriptomic data. Only adults aged 18–50 years, with available pre-vaccination data were included in the resource. c, Principal variance component analysis was used to estimate the proportion of the variance observed in the transcriptomic data that can be attributed to clinical (age, sex, ethnicity) and experimental variables (time after vaccination, vaccine). The proportion of the variance that could not be explained by those variables is depicted by the residuals (resid). Confidence intervals (95%, percentile method) and bar height (mean) were computed from 4,000 bootstrap replicates.
Fig. 2
Fig. 2. Participants have distinct pre-vaccination transcriptomic profiles.
Hierarchical clustering (Euclidean distance metric and complete linkage agglomeration method) of pre-vaccination samples (day −7 and day 0) based on the expression of the BTMs and hallmark gene sets. The overall transcriptomic activity of gene sets/modules was estimated using sample-level enrichment analysis (SLEA). Three groups of participants/endotypes can be identified by cutting the dendrogram. Average SLEA score of the four hallmark inflammatory gene sets (bold row labels; inflam.gs), discretized in tertiles, is shown as sample annotation. Endotypes were designated as high (inflam.hi), low (inflam.lo) and middle (inflam.mid) inflammatory pathways. For each of the seven supersets of hallmark and BTM gene sets, ten canonical genes annotated to NK cells, T cells, B cells, E2F/MYC, inflammation, monocytes/DCs and ISGs, respectively (heat map). TH2, type 2 helper T cell.
Fig. 3
Fig. 3. Kinetics of the vaccine response are dictated by the pre-vaccination endotypes.
ac, Line plots showing the expression of inflammatory pathways (a), ISGs (b) and B cells (c) as a function of time, separated by participants with low, middle or high pre-vaccination inflammation (inflam.lo, n = 235; inflam.mid, n = 237; inflam.hi, n = 304). Each colored line corresponds to one participant. LOESS regression was used to determine the average expression per pre-vaccination endotype (black lines). d, TH2 cell markers fold change values over pre-vaccination data for several time points after vaccination (day 1, inflam.lo n = 117, inflam.mid n = 117, inflam.hi n = 139; day 3, inflam.lo n = 166, inflam.mid n = 165, inflam.hi n = 202; day 7, inflam.lo n = 159, inflam.mid n = 147, inflam.hi n = 198; day 14 inflam.lo n = 81, inflam.mid n = 103, inflam.hi n = 100). For each box plot, the vertical line indicates the median, the box indicates the interquartile range, and the whiskers indicate 1.5 times the interquartile range. Wilcoxon rank-sum test; *P < 0.05, **P < 0.01 and ***P < 0.001.
Fig. 4
Fig. 4. Prediction of the antibody response by the pre-vaccination endotypes.
a, Box plot of the maximum fold change (MFC) antibody responses as a function of the pre-vaccination inflammation endotypes (inflam.lo, n = 212; inflam.mid, n = 233; inflam.hi, n = 281). The MFC was scaled to a mean of 0 and a standard-deviation of 1 across vaccines. For each boxplot, the vertical line indicates the median, the box indicates the interquartile range, and the whiskers indicate 1.5 times the interquartile range. A Wilcoxon rank-sum test without correction for multiple testing was used to assess differences in antibody response between the two endotypes; *P < 0.05, **P< 0.01 and ***P < 0.001. b, A supervised machine-learning approach was adopted to train a random forest classifier using pre-vaccination gene expression to distinguish high vaccine responders (top 70%) from low vaccine responders (bottom 30%). The predictive performance of the classifier was assessed by tenfold cross-validation (10-CV). The ROC curve is presented along with the auROC and 95% confidence intervals estimated from the tenfold CV. c, The top 500 predictive genes/features included in the classifier (importance > 0%) overlapped with inflammatory genes identified in the unsupervised approach (two-sided Fisher’s exact test, P = 1.13 × 10−11). Heat map showing the pre-vaccination expression of the overlapping genes. Samples (columns) are ordered by increasing expression level of the inflammatory genes. A Wilcoxon rank-sum test was used to assess the association between the inflammatory signatures and high/low antibody response and resulted in a P value of 0.00265. d, Comparison of eight genes contributing the majority of the classifier prediction (importance > 50%) against previously identified pre-vaccination signatures of vaccine response. MetaIntegrator was used to calculate an auROC for each previously published pre-vaccination signature of vaccine response, as well as the eight genes identified in this work, using each of the transcriptomic studies within the Immune Signatures Data Resource. Circles correspond to studies that were used to train the pre-vaccination signatures, while asterisks indicate significantly better than random identification of high responders in each transcriptomic study as determined by a permutation test.
Fig. 5
Fig. 5
a, Pre-vaccination endotypes in single-cell RNA-sequencing uniform manifold approximation and projection (UMAP) of PBMCs from 20 healthy participants profiled by CITE-seq; subsets were identified based on surface protein expression (average dsb normalized protein expression within each cluster). b, Single-cell CITE-seq deconvolution of inflammatory genes, identified as being associated with vaccine-induced antibody response by the unsupervised and supervised approaches, in the blood immune cell subsets. The color represents average log normalized expression within each cluster with scales clipped at a maximum of 0.25, and the dot size represents the percentage of cells within that cluster with nonzero expression of the gene. HSC, hematopoietic stem cells; mDC, myeloid dendritic cell; pDC, plasmacytoid DC.
Fig. 6
Fig. 6. Etiology of the pre-vaccination endotypes.
a, Box plot showing the bacterial/viral metascore as a function of the pre-vaccination inflammatory endotypes (inflam.lo, n = 241; inflam.mid, n = 249; inflam.hi, n = 317). For each boxplot, the vertical line indicates the median, the box indicates the interquartile range, and the whiskers indicate 1.5 times the interquartile range. A Wilcoxon rank-sum test without correction for multiple testing was used to assess the difference in bacterial/viral metascore between two endotypes: *P < 0.05, **P < 0.01 and ***P < 0.001. b, Gene expression of the inflammatory genes, identified as being associated with antibody response by the unsupervised and supervised approaches, in DCs from three independent donors stimulated for 6 h with five PRR ligands.
Extended Data Fig. 1
Extended Data Fig. 1. Principal variance component analysis using pre-vaccination transcriptomic expression.
All phenotypic variables were coded as categorical variables. The variance explained by each variable (x-axis) is indicated as the label at the top of each bar. 95% intervals of confidence were calculated by bootstrapping the samples (4000 bootstrap iterations). resid: residuals.
Extended Data Fig. 2
Extended Data Fig. 2. Identification of the pre-vaccination endotypes.
(a) Gap statistic for different number of clusters (k). The 95% confidence interval were estimated by 100 Monte Carlo iterations. (b) Boxplot and barplot of age, sex and pre-vaccination antibody titers as a function of the inflammatory endotypes. For each boxplot, the vertical line indicates the median, the box indicates the interquartile range, and the whiskers indicate 1.5 times the interquartile range. (c) Lineplot showing the differences in expression of inflammatory pathways between 7 days before vaccination compared to just before vaccination. (d) Monocytes/dendritic cell markers expression in blood of pre-vaccinated individuals. PBMCs from 20 healthy participants profiled by CITE-seq. The heatmap shows the average expression of monocyte and dendritic cell markers identified in bulk meta-analysis associated with the high inflammatory state, scale shown is the z-score of the gene across protein-based cell subsets. (e) Scatter plot showing inferred frequencies of immune cells estimate by CIBERSORT as a function of cell counts measured by flow cytometry (FCM) for three separate study. Linear fit (lines) is drawn for each study. (f) Frequencies of immune cells, estimated by deconvolution, in the three pre-vaccination states. For each boxplot, the vertical line indicates the median, the box indicates the interquartile range, and the whiskers indicate 1.5 times the interquartile range. Wilcoxon rank-sum test between two endotypes: p-values less than 0.05 are flagged with one star (*), p-values less than 0.01 are flagged with 2 stars (**), and p-values less than 0.001 are flagged with three stars (***).
Extended Data Fig. 3
Extended Data Fig. 3. Pre-vaccination endotypes affect post-vaccination transcriptomic response.
(a) Principal variance analysis with the inflammatory states. Canonical inflammatory genes (b), interferon-stimulated genes (c), and B cell markers (d) expression over time in the three inflammatory states. (e) Log2 fold-change over pre-vaccination levels of B cell markers. For each boxplot, the vertical line indicates the median, the box indicates the interquartile range, and the whiskers indicate 1.5 times the interquartile range. Wilcoxon rank-sum test between two endotypes: p-values less than 0.05 are flagged with one star (*), p-values less than 0.01 are flagged with 2 stars (**), and p-values less than 0.001 are flagged with three stars (***). (f) Th2 cell markers over time.
Extended Data Fig. 4
Extended Data Fig. 4. Pre-vaccination endotypes predict antibody response to vaccines.
(a) Association between the unsupervised pre-vaccination cluster and antibody response at day 28 for (right) Influenza inactivated vaccines and (left) other vaccines. For each boxplot, the vertical line indicates the median, the box indicates the interquartile range, and the whiskers indicate 1.5 times the interquartile range. Wilcoxon rank-sum test between two endotypes: p-values less than 0.05 are flagged with one star (*), p-values less than 0.01 are flagged with 2 stars (**), and p-values less than 0.001 are flagged with three stars (***). (B) Association between the unsupervised pre-vaccination cluster and antibody response at day 180 for the inactivated influenza vaccine (left) and day 84 yellow fever vaccine (right). For each boxplot, the vertical line indicates the median, the box indicates the interquartile range, and the whiskers indicate 1.5 times the interquartile range. (c) Association between the unsupervised pre-vaccination cluster and antibody response at day 28 for healthy adults aged 50 and above. For each boxplot, the vertical line indicates the median, the box indicates the interquartile range, and the whiskers indicate 1.5 times the interquartile range. (d) Accuracy of the supervised classifier to predict the antibody response groups per vaccine. Mean and 95% CI for auROC across the 10-folds for each vaccine separately. (e) Accuracy of supervised classifiers trained on a specific vaccine and tested on the same vaccine by cross-validation. The red line indicates the accuracy of the pan-vaccine classifier while the bar represents the 95% CI calculated by 10-fold cross-validation. (f) Venn diagram of the overlap of inflammatory genes and previously identified pre-vaccination signature of vaccine response.
Extended Data Fig. 5
Extended Data Fig. 5. PBMCs from 20 healthy participants profiled by CITE-seq.
Subsets were identified based on surface protein expression (average dsb normalized protein expression within each cluster).
Extended Data Fig. 6
Extended Data Fig. 6. Upstream signaling molecules and transcription factors demarcate the pre-vaccination endotypes.
(a) Scatter plot showing the discriminative power of NFκB- and Interferon-target genes for each of the vaccine in the ‘Immune Signatures Data Resource’. LogFC of the SLEA z-score of the two genesets between high vaccine responders and low vaccine responders is shown. (b) Overlap between the genes differentially expressed between the inflam.hi and inflam.lo endotypes and inflammatory signatures described in the literature. The significance of the overlap between ranked lists of genes was assessed by permutation. * indicate statistically significant overlap (permutation test: p ≤ 0.05) between the differentially expressed genes between the inflam.hi and inflam.lo endotypes and previously described inflammatory signatures extracted from the literature.

Comment in

References

    1. Goodwin K, Viboud C, Simonsen L. Antibody response to influenza vaccination in the elderly: a quantitative review. Vaccine. 2006;24:1159–1169. doi: 10.1016/j.vaccine.2005.08.105. - DOI - PubMed
    1. Chambers C, et al. Should sex be considered an effect modifier in the evaluation of influenza vaccine effectiveness? Open Forum Infect. Dis. 2018;5:ofy211. doi: 10.1093/ofid/ofy211. - DOI - PMC - PubMed
    1. Kurupati R, et al. Race-related differences in antibody responses to the inactivated influenza vaccine are linked to distinct pre-vaccination gene expression profiles in blood. Oncotarget. 2016;7:62898–62911. doi: 10.18632/oncotarget.11704. - DOI - PMC - PubMed
    1. Poland GA, Ovsyannikova IG, Jacobson RM. Immunogenetics of seasonal influenza vaccine response. Vaccine. 2008;26:D35–D40. doi: 10.1016/j.vaccine.2008.07.065. - DOI - PMC - PubMed
    1. Avnir Y, et al. IGHV1-69 polymorphism modulates anti-influenza antibody repertoires, correlates with IGHV utilization shifts and varies by ethnicity. Sci. Rep. 2016;6:20842. doi: 10.1038/srep20842. - DOI - PMC - PubMed

Publication types