

Comparative epidemiology of five waves of COVID-19 in Mexico, March 2020-August 2022
- PMID: 36316634
- PMCID: PMC9623964
- DOI: 10.1186/s12879-022-07800-w
Comparative epidemiology of five waves of COVID-19 in Mexico, March 2020-August 2022
Abstract
Background: The Mexican Institute of Social Security (IMSS) is the largest health care provider in Mexico, covering about 48% of the Mexican population. In this report, we describe the epidemiological patterns related to confirmed cases, hospitalizations, intubations, and in-hospital mortality due to COVID-19 and associated factors, during five epidemic waves recorded in the IMSS surveillance system.
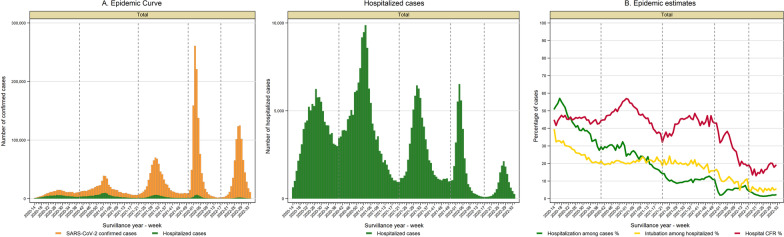
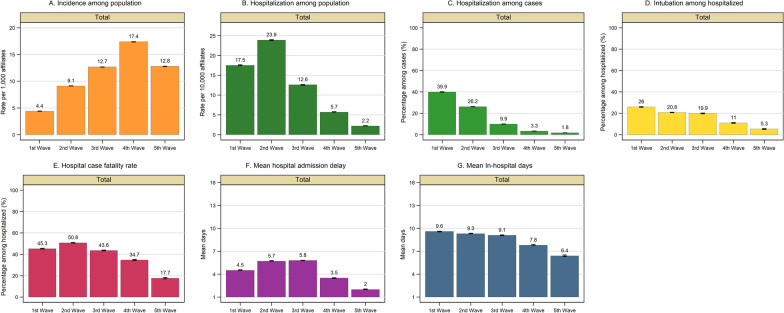
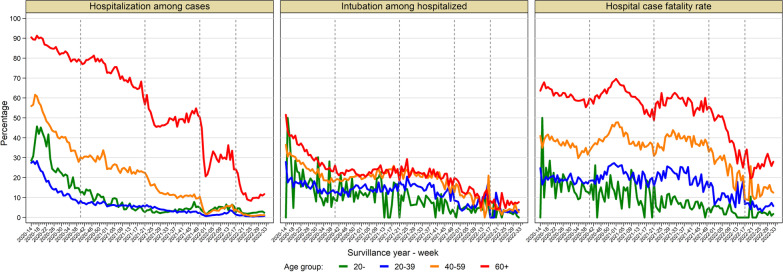
Methods: We analyzed COVID-19 laboratory-confirmed cases from the Online Epidemiological Surveillance System (SINOLAVE) from March 29th, 2020, to August 27th, 2022. We constructed weekly epidemic curves describing temporal patterns of confirmed cases and hospitalizations by age, gender, and wave. We also estimated hospitalization, intubation, and hospital case fatality rates. The mean days of in-hospital stay and hospital admission delay were calculated across five pandemic waves. Logistic regression models were employed to assess the association between demographic factors, comorbidities, wave, and vaccination and the risk of severe disease and in-hospital death.
Results: A total of 3,396,375 laboratory-confirmed COVID-19 cases were recorded across the five waves. The introduction of rapid antigen testing at the end of 2020 increased detection and modified epidemiological estimates. Overall, 11% (95% CI 10.9, 11.1) of confirmed cases were hospitalized, 20.6% (95% CI 20.5, 20.7) of the hospitalized cases were intubated, and the hospital case fatality rate was 45.1% (95% CI 44.9, 45.3). The mean in-hospital stay was 9.11 days, and patients were admitted on average 5.07 days after symptoms onset. The most recent waves dominated by the Omicron variant had the highest incidence. Hospitalization, intubation, and mean hospitalization days decreased during subsequent waves. The in-hospital case fatality rate fluctuated across waves, reaching its highest value during the second wave in winter 2020. A notable decrease in hospitalization was observed primarily among individuals ≥ 60 years. The risk of severe disease and death was positively associated with comorbidities, age, and male gender; and declined with later waves and vaccination status.
Conclusion: During the five pandemic waves, we observed an increase in the number of cases and a reduction in severity metrics. During the first three waves, the high in-hospital fatality rate was associated with hospitalization practices for critical patients with comorbidities.
Keywords: COVID-19; Death; Hospitalization; Intubation; SARS-CoV-2.
© 2022. The Author(s).
Conflict of interest statement
The authors declare that they have no competing interests.
Figures
Similar articles
-
Clinical severity of COVID-19 in patients admitted to hospital during the omicron wave in South Africa: a retrospective observational study.Lancet Glob Health. 2022 Jul;10(7):e961-e969. doi: 10.1016/S2214-109X(22)00114-0. Epub 2022 May 18. Lancet Glob Health. 2022. PMID: 35597249 Free PMC article.
-
Changes in the epidemiological profile of SARS-CoV-2-positive individuals in Mexico across pandemic waves as an explanation of fatality reduction: a retrospective observational study.BMJ Open. 2023 May 23;13(5):e063211. doi: 10.1136/bmjopen-2022-063211. BMJ Open. 2023. PMID: 37221025 Free PMC article.
-
Characteristics, outcome, duration of hospitalization, and cycle threshold of patients with COVID-19 referred to four hospitals in Babol City: a multicenter retrospective observational study on the fourth, fifth, and sixth waves.BMC Infect Dis. 2024 Jan 6;24(1):55. doi: 10.1186/s12879-023-08939-w. BMC Infect Dis. 2024. PMID: 38184533 Free PMC article.
-
[Effect of the Omicron variant on cumulative incidence of infection and lethality during the sixth wave of the COVID-19 epidemic in Spain].Semergen. 2024 Mar;50(2):102073. doi: 10.1016/j.semerg.2023.102073. Epub 2023 Oct 13. Semergen. 2024. PMID: 37839336 Review. Spanish.
-
[Epidemiology and response strategies against COVID-19: the Senegalese experience from 2020 to 2021].Pan Afr Med J. 2022 Dec 23;43:204. doi: 10.11604/pamj.2022.43.204.38290. eCollection 2022. Pan Afr Med J. 2022. PMID: 36942135 Free PMC article. Review. French.
Cited by
-
The fatal contribution of serine protease-related genetic variants to COVID-19 outcomes.Front Immunol. 2024 Mar 27;15:1335963. doi: 10.3389/fimmu.2024.1335963. eCollection 2024. Front Immunol. 2024. PMID: 38601158 Free PMC article.
-
Comparing Natural Language Processing and Structured Medical Data to Develop a Computable Phenotype for Patients Hospitalized Due to COVID-19: Retrospective Analysis.JMIR Med Inform. 2023 Aug 22;11:e46267. doi: 10.2196/46267. JMIR Med Inform. 2023. PMID: 37621195 Free PMC article.
-
Estimating the effect of realistic improvements of metformin adherence on COVID-19 mortality using targeted machine learning.Glob Epidemiol. 2024 Mar 30;7:100142. doi: 10.1016/j.gloepi.2024.100142. eCollection 2024 Jun. Glob Epidemiol. 2024. PMID: 38590914 Free PMC article.
-
Time‑dependent ROC curve analysis to determine the predictive capacity of seven clinical scales for mortality in patients with COVID‑19: Study of a hospital cohort with very high mortality.Biomed Rep. 2024 May 9;20(6):100. doi: 10.3892/br.2024.1788. eCollection 2024 Jun. Biomed Rep. 2024. PMID: 38765855 Free PMC article.
-
COVID-19 Vaccination Uptake and Effectiveness for Hospitalized Cases Among Healthcare Workers in Tertiary Hospital.Vaccines (Basel). 2025 Jan 31;13(2):147. doi: 10.3390/vaccines13020147. Vaccines (Basel). 2025. PMID: 40006694 Free PMC article.
References
-
- World Health Organization. Coronavirus disease (COVID-19) situation reports. https://www.who.int/emergencies/diseases/novel-coronavirus-2019/situatio.... Accessed 8th Sept 2022.
-
- Pan American Health Organization. Geo-Hub COVID-19-information system for the region of the Americas. https://paho-covid19-response-who.hub.arcgis.com/. Accessed 8th Sept 2022.
-
- World Bank. Atlas of sustainable development goals 2018: from world development indicators. https://openknowledge.worldbank.org/handle/10986/29788. Accessed 8th Sept 2022.
-
- Our World in Data. Total confirmed deaths due to COVID-19. https://ourworldindata.org/grapher/cumulative-deaths-and-cases-covid-19. Accessed 8th Sept 2022.
MeSH terms
Supplementary concepts
Grants and funding
LinkOut - more resources
Full Text Sources
Medical
Miscellaneous
