The value of the peroneus brevis tendon cross-sectional area in early diagnosing of peroneus brevis tendinitis: The peroneus brevis tendon cross-sectional area
- PMID: 36316917
- PMCID: PMC10662861
- DOI: 10.1097/MD.0000000000031276
The value of the peroneus brevis tendon cross-sectional area in early diagnosing of peroneus brevis tendinitis: The peroneus brevis tendon cross-sectional area
Abstract
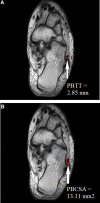
A thickened peroneus brevis tendon has been considered to be an important morphologic parameter of peroneus brevis tendinitis (PBT). Previous researchers have found that the peroneus brevis tendon thickness (PBTT) is correlated with inflammation of the peroneus brevis tendon. However, inflammatory hypertrophic change is different from simple thickness. Thus, we devised the peroneus brevis tendon cross-sectional area (PBTCSA) as a new diagnostic parameter to analyze the hypertrophy of the whole PBT. We assumed that the PBTCSA is a major morphologic parameter useful for early PBT diagnosis. Peroneus brevis tendon images were collected from 22 patients with PBT and from 22 normal subjects who underwent ankle-magnetic resonance imaging and revealed no evidence of PBT. The T1-weighted axial ankle-magnetic resonance imaging images were evaluated at the ankle level from all participants. The PBTT was measured as the thickest point at the transverse image of the peroneus brevis tendon. The PBTCSA was measured as the cross-sectional ligament whole area of the peroneus brevis tendon that was most hypertrophied in the axial A-MR images. The average PBTT was 2.22 ± 0.29 mm in the normal group and 2.85 ± 0.36 mm in the PBT group. The average PBTCSA was 6.98 ± 1.54 mm2 in the normal group and 13.11 ± 2.45 mm2 in the PBT group. PBT patients had significantly greater PBTT (P < .001) and PBTCSA (P < .001) than the normal group did. A receiver operating characteristic curve analysis revealed that the most suitable cutoff value of the PBTT was 2.51 mm, with 81.8% sensitivity and 81.8% specificity, and an AUC for the score was 0.93. The most suitable cutoff value of the PBTCSA was 10.08 mm2, with 90.9% sensitivity and 90.9% specificity, and AUC for the score was 0.98. Even though the PBTT and PBTCSA were both significantly associated with PBT, the PBTCSA was a more sensitive diagnostic parameter.
Copyright © 2022 the Author(s). Published by Wolters Kluwer Health, Inc.
Conflict of interest statement
The authors declare no conflict of interests.
Figures


Similar articles
-
Magnetic Resonance Imaging Analysis of Peroneal Tendon Pathology Associated With Low-Lying Peroneus Brevis Muscle Belly: A Case-Control Study.Foot Ankle Spec. 2015 Oct;8(5):347-53. doi: 10.1177/1938640015569764. Epub 2015 Feb 9. Foot Ankle Spec. 2015. PMID: 25666688
-
The relationship between tears of the peroneus brevis tendon and the distal extent of its muscle belly: an MRI study.Foot Ankle Int. 2006 Apr;27(4):236-9. doi: 10.1177/107110070602700402. Foot Ankle Int. 2006. PMID: 16624211
-
[Magnetic resonance imaging of normal anatomy and injury of the peroneal tendon].Zhonghua Yi Xue Za Zhi. 2020 May 5;100(17):1305-1309. doi: 10.3760/cma.j.cn112137-20191125-02559. Zhonghua Yi Xue Za Zhi. 2020. PMID: 32375437 Chinese.
-
Normal variants and diseases of the peroneal tendons and superior peroneal retinaculum: MR imaging features.Radiographics. 2005 May-Jun;25(3):587-602. doi: 10.1148/rg.253045123. Radiographics. 2005. PMID: 15888611 Review.
-
Imaging appearances of lateral ankle ligament reconstruction.Radiographics. 2004 Jul-Aug;24(4):999-1008. doi: 10.1148/rg.244035723. Radiographics. 2004. PMID: 15256624 Review.
Cited by
-
MSK Ultrasound - An IJSPT Perspective.Int J Sports Phys Ther. 2023 Feb 2;18(1):1-10. doi: 10.26603/001c.68184. eCollection 2023. Int J Sports Phys Ther. 2023. PMID: 36793557 Free PMC article.
References
-
- Kumar Y, Alian A, Ahlawat S, et al. . Peroneal tendon pathology: pre- and post-operative high resolution US and MR imaging. Eur J Radiol. 2017;92:132–44. - PubMed
-
- Dombek MF, Orsini R, Mendicino RW, et al. . Peroneus brevis tendon tears. Clin Podiatr Med Surg. 2001;18:409–27. - PubMed
-
- Taljanovic MS, Alcala JN, Gimber LH, et al. . High-resolution US and MR imaging of peroneal tendon injuries. Radiographics. 2015;35:179–99. - PubMed
MeSH terms
LinkOut - more resources
Full Text Sources
Medical

