. 2022 Sep 26;7(9):880-895.
doi: 10.1016/j.jacbts.2022.06.004. eCollection 2022 Sep.

LncRNA-ZFAS1 Promotes Myocardial Ischemia-Reperfusion Injury Through DNA Methylation-Mediated Notch1 Down-Regulation in Mice

Affiliations

LncRNA-ZFAS1 Promotes Myocardial Ischemia-Reperfusion Injury Through DNA Methylation-Mediated Notch1 Down-Regulation in Mice

Mengmeng Li et al. JACC Basic Transl Sci. .

Abstract

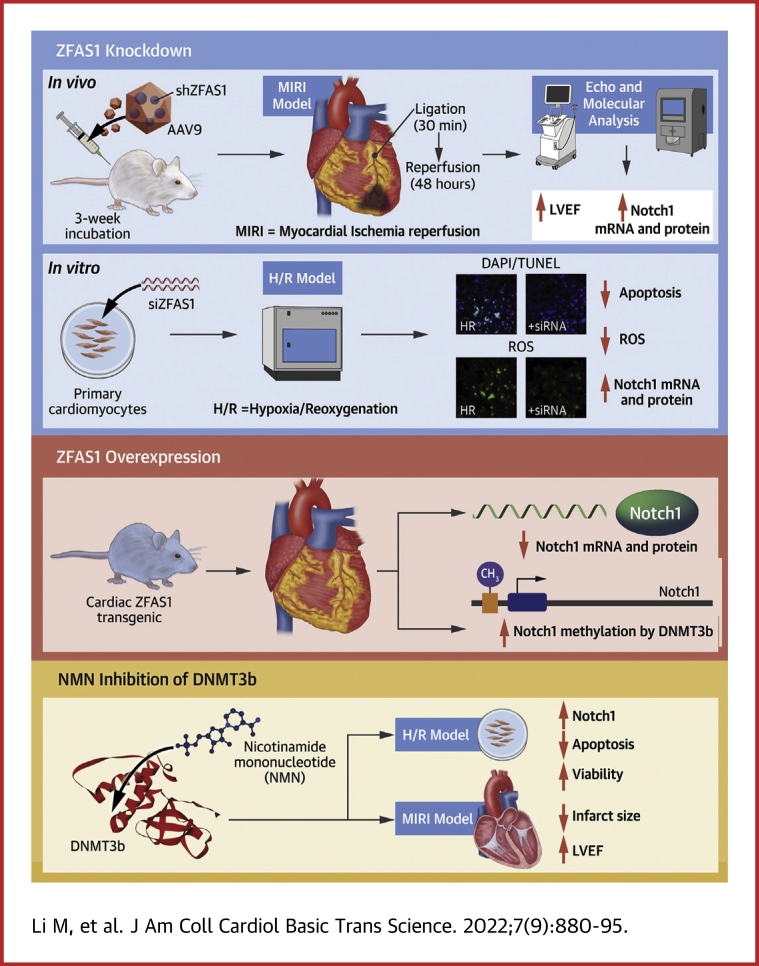
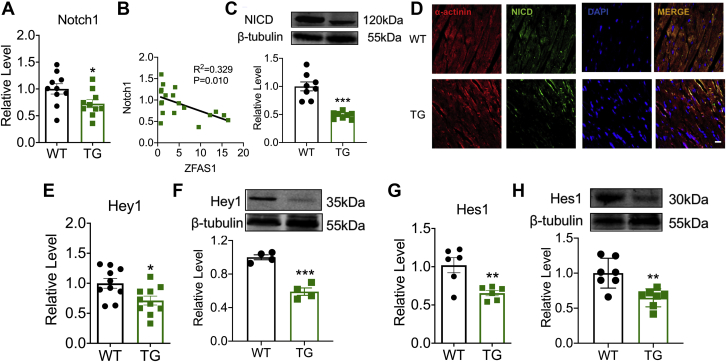
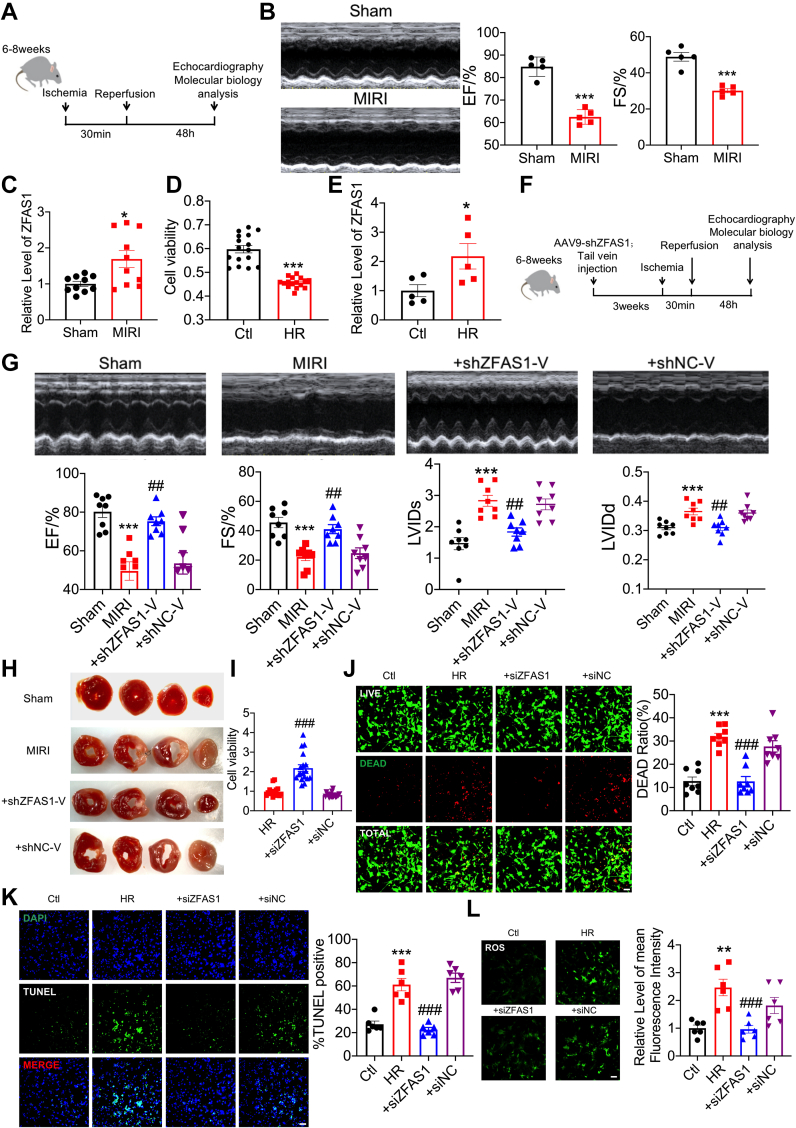
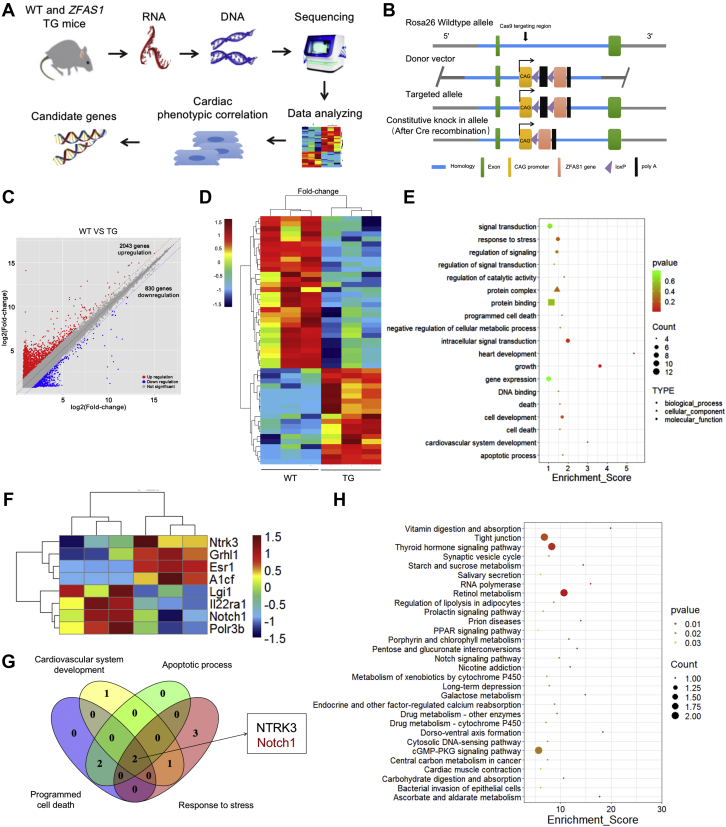
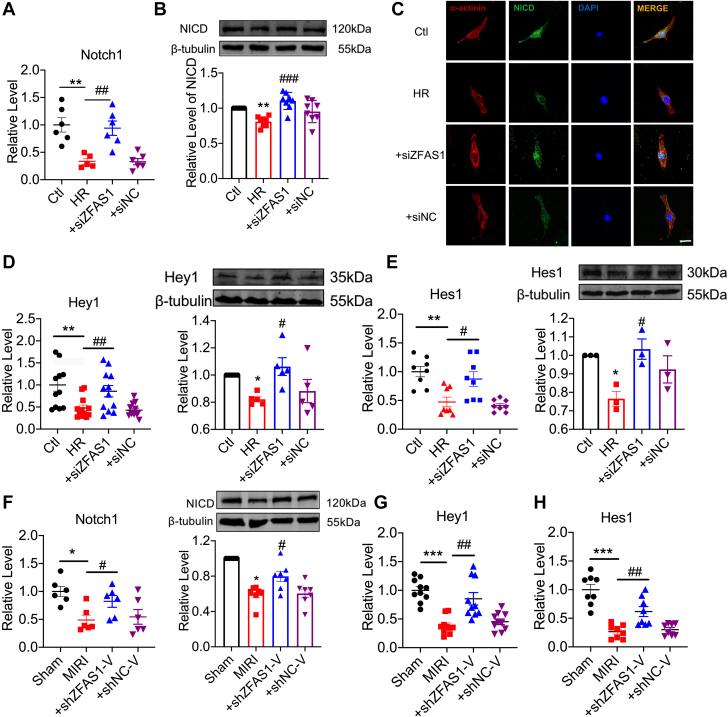
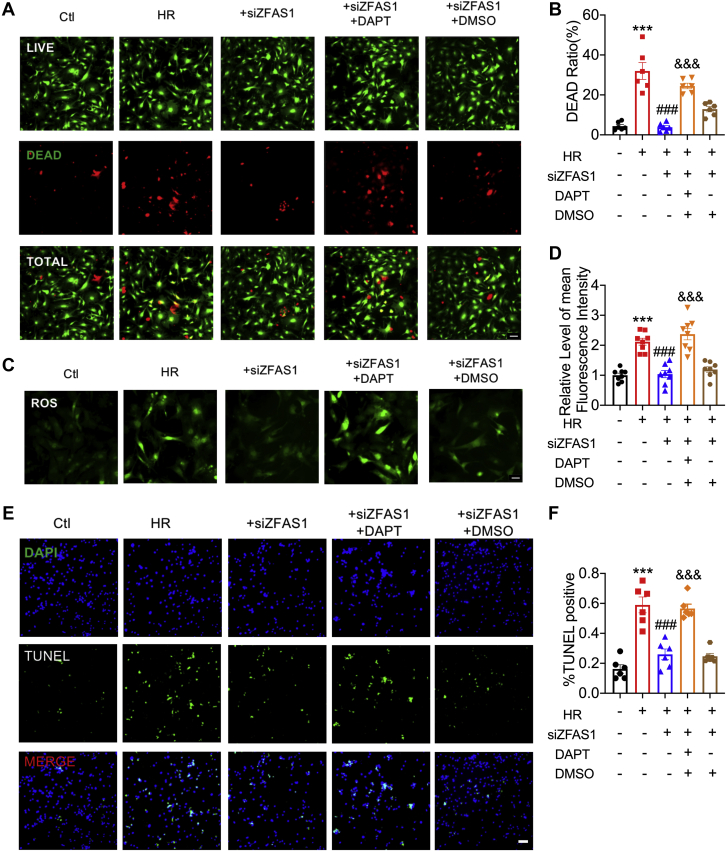
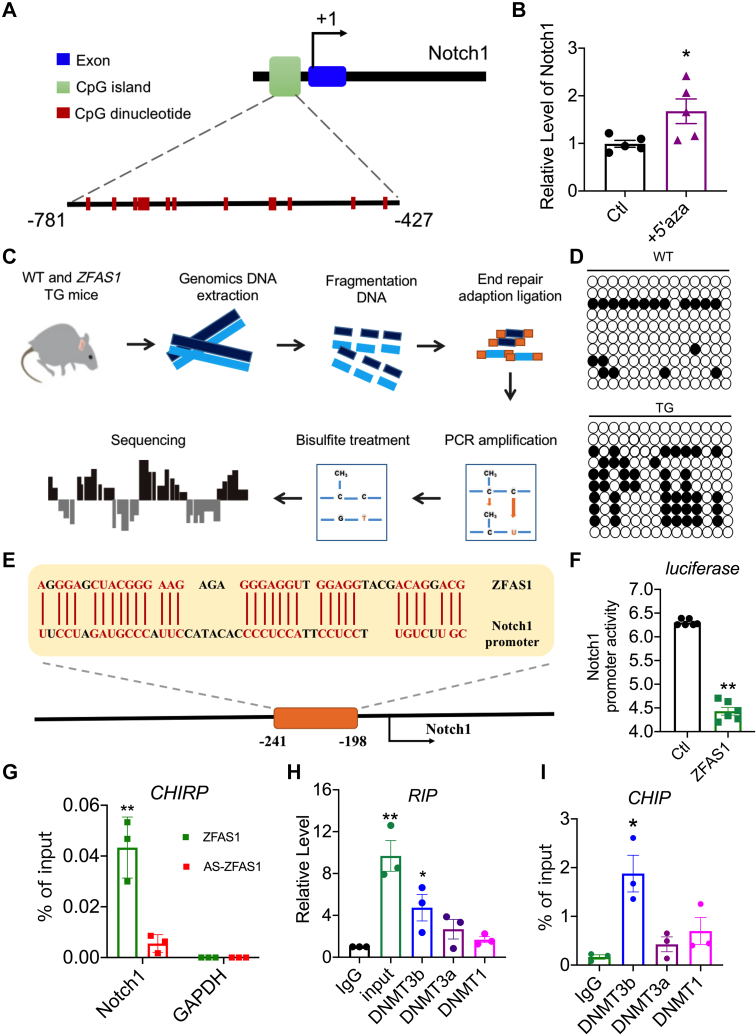
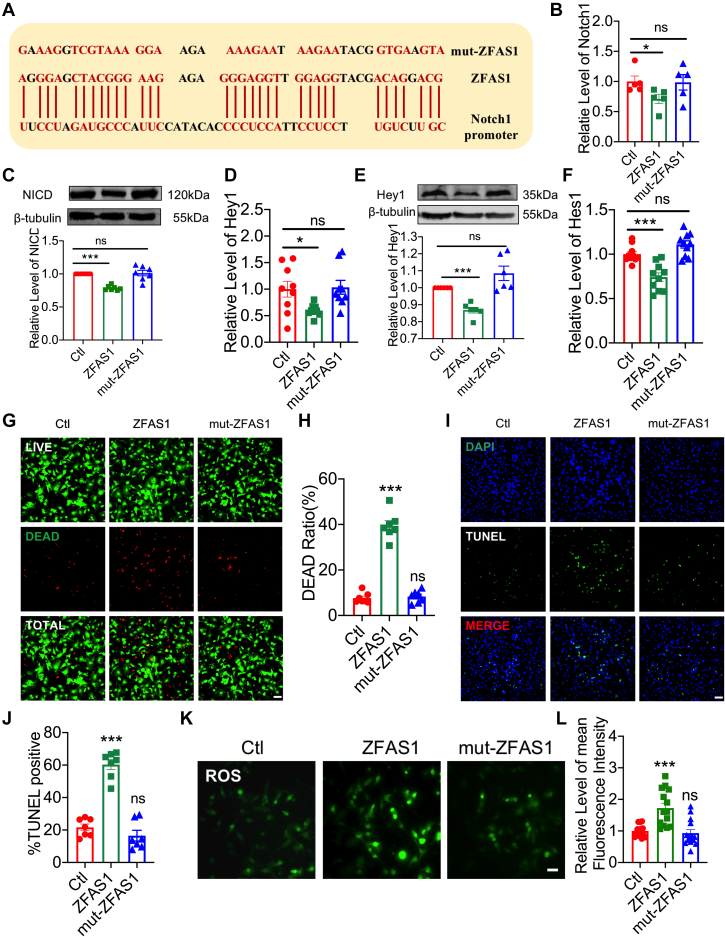
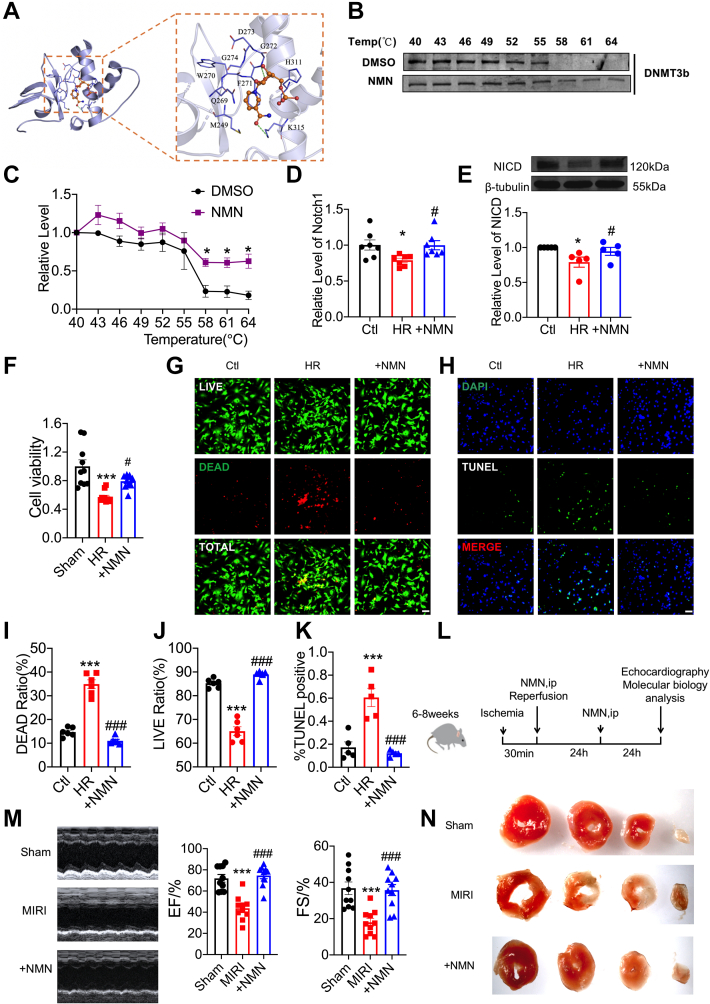
The most devastating and catastrophic deterioration of myocardial ischemia-reperfusion injury (MIRI) is cardiomyocyte death. Here we aimed to evaluate the role of lncRNA-ZFAS1 in MIRI and delineate its mechanism of action. The level of lncRNA-ZFAS1 was elevated in MIRI hearts, and artificial knockdown of lncRNA-ZFAS1 in mice improved cardiac function. Notch1 is a potential target of lncRNA-ZFAS1, and lncRNA-ZFAS1 could bind to the promoter region of Notch1 and recruit DNMT3b to induce Notch1 methylation. Nicotinamide mononucleotide could promote the expression of Notch1 by competitively inhibiting the expression of DNMT3b and improving the apoptosis of cardiomyocytes and cardiac function.

Keywords: AAV, adeno-associated virus; DNA methylation; DNMT, DNA methyltransferase; HR, hypoxia/reoxygenation; MI, myocardial infarction; MIRI, myocardial ischemia-reperfusion injury; NICD, Notch intracellular domain; NMCM, neonatal mouse cardiac myocytes; NMN, nicotinamide mononucleotide; Notch1; ROS, reactive oxygen species; TG, transgenic; WT, wild-type; ZFAS1; ZFAS1, zinc finger antisense 1; lncRNA, long noncoding RNA; long noncoding RNA; myocardial ischemia-reperfusion injury; shZFAS1, short hairpin RNA ZFAS1; siZFAS1, small interfering RNA ZFAS1.


Conflict of interest statement

The National Key R & D Program of China (2017YFC1702003) and the National Natural Science Foundation of China (81970320, 81773735, 81961138018, 91949130, and 82003749) both contributed to this research. The authors have reported that they have no relationships relevant to the contents of this paper to disclose.

Figures

None
Graphical abstract
Figure 3
Figure 3
ZFAS1 Is a Negative Regulator of Notch1 (A) The mRNA level of Notch1 in TG mice. n = 10. ∗P < 0.05 vs WT. (B) Correlation between ZFAS1 and Notch1 mRNA expression. n = 19. (C) Down-regulation of NICD expression in TG mice at protein levels. n = 8. ∗∗∗P < 0.001 vs WT. (D) Images of NICD (green) and α-actinin (red) immunofluorescence staining in NMCMs, Scale bar: 50 μm. n = 6. (E) The mRNA expression level of Hey1 in TG mice. n = 10. ∗P < 0.05 vs WT. (F) Down-regulation of Hey1 expression in TG mice at protein levels. n = 4. ∗∗∗P < 0.001 vs WT. (G) The level of Hes1 mRNA expression in TG mice. n = 6. ∗∗P < 0.01 vs WT. (H) Hes1 expression is dysregulated at the protein level in TG mice. n = 7. ∗∗P < 0.01 vs WT. NICD = Notch intracellular domain; NMCM = neonatal mouse cardiac myocytes; other abbreviations as in Figures 1 and 2.
Figure 1
Figure 1
Pro-Oxidative Stress and Proapoptotic Effects of ZFAS1 in MIRI (A) Experimental timeline. (B) Echocardiographic detection of changes in cardiac function. n = 5, ∗∗∗P < 0.001 vs Sham. (C) qRT-PCR was used to detect ZFAS1 expression in MIRI mice. n = 10. ∗P < 0.05 vs Sham. (D) CCK8 assay to detect the effects of cell viability. n = 16. ∗∗∗P < 0.001 vs Ctl. (E) qRT-PCR was used to determine the level of ZFAS1 expression in HR-treated cells. n = 5. ∗P < 0.05 vs Ctl. (F) Experimental timeline. (G) Echocardiographic detection of changes in cardiac function. n = 8. ∗∗∗P < 0.001 vs Sham; ##P < 0.01 vs MIRI. (H) TTC detects the effect of shZFAS1-V on the infarct size of MIRI mice. n = 4. (I) CCK8 assay to detect the effects of cell viability. n = 18, ###P < 0.001 vs siZFAS1. (J) To determine the effects of siZFAS1 on cardiomyocytes cell viability. n = 8. ∗∗∗P < 0.001 vs Ctl; ###P < 0.001 vs HR. Magnification ×200. (K) TUNEL assay was used to investigate the effect on apoptosis. n = 6. ∗∗∗P < 0.001 vs Ctl; ###P < 0.001 vs HR. Magnification ×200. (L) Effects of siZFAS1 on the contents of ROS. n = 6. ∗∗P < 0.01 vs Ctl; ###P < 0.001 vs HR. Magnification ×200. P values were determined by means of t-tests and 1-way analyses of variance with Bonferroni multiple group comparisons. Data are presented as mean ± SEM. AAV = adeno-associated virus; Ctl = control cells; HR = hypoxia/reoxygenation-treated cells; MIRI = myocardial ischemia-reperfusion injury; qRT-PCR = quantitative reverse-transcription polymerase chain reaction; ROS = reactive oxygen species; shNC-V = the negative control shRNA engineered into the AAV9 vector; shZFAS1 = short hairpin RNA ZFAS1; siZFAS1, small interfering RNA ZFAS1; TTC = triphenyltetrazolium chloride; TUNEL = terminal deoxynucleotide transferase–mediated dUTP nick-end labeling; ZFAS1 = zinc finger antisense 1.
Figure 2
Figure 2
The Gene Expression Profile of ZFAS1-Overexpression Mice (A) Schematic diagram of RNA sequencing and target gene identification. (B) The production of cardiac-specific ZFAS1 knock-in mice is depicted throughout this diagram. (C) Volcano plot of the identified differentially expressed mRNAs. Red area:P < 0.05; fold change ≥2; blue area:P < 0.05, fold change ≤0.5. Benjamin-Hochberg was used to report the false discovery rate for the volcano plot and fold-change analyses. (D) Heat map of the differentially expressed mRNAs identified between TG and WT mice (red, up-regulated mRNAs; blue, down-regulated mRNAs). (E) The second level of differentially expressed genes identified with the use of Gene Ontology. (F) Heat map of mRNA involved in response to stress, apoptosis, protein binding, and other pathways. (G) Venn diagram for screening target genes. (H) Pathway enrichment analysis of differentially expressed genes (criterion: differentially expressed genes >2 and P ≤ 0.05) according to the Kyoto Encyclopedia of Genes and Genomes. TG = cardiac-specific ZFAS1 knock-in (transgenic); WT = wild-type; other abbreviations as in Figure 1.
Figure 4
Figure 4
ZFAS1 Promotes Cardiomyocyte Apoptosis During MIRI by Regulating Notch1 Signaling Pathway (A) Up-regulation of Notch1 expression at the mRNA level in HR-treated cardiomyocytes pretreated with siZFAS1. n = 6. ∗∗P < 0.01 vs Ctl; ##P < 0.01 vs HR. (B) Up-regulation of NICD expression at the protein level in HR-treated cardiomyocytes pretreated with siZFAS1. n = 7. ∗∗P < 0.01 vs Ctl; ###P < 0.001 vs HR. (C) Images of NICD (green) and α-actinin (red) immunofluorescence staining in NMCMs Scale bar: 50 μm. n = 6. (D) HR-treated cardiomyocytes pretreated with siZFAS1 showed up-regulation of Hey1 expression at both mRNA (n = 12) and protein (n = 5) levels. ∗P < 0.05; ∗∗P < 0.01 vs Ctl; #P < 0.05 vs HR; ##P < 0.01 vs HR. (E) In HR-treated cardiomyocytes pretreated with siZFAS1, Hes1 expression was elevated at both mRNA (n = 8) and protein (n = 3) levels. ∗P < 0.05; ∗∗P < 0.01 vs Ctl; #P < 0.05 vs HR; ##P < 0.01 vs HR. (F) In MIRI mice pretreated with shZFAS1-V, expressions of Notch1 mRNA (n = 6) and NICD protein (n = 7) were up-regulated. ∗P < 0.05 vs sham; #P < 0.05 vs MIRI. (G, H) In MIRI mice pretreated with shZFAS1-V, expressions of Hey1 (n = 10) and Hes1 (n = 8) were up-regulated at the mRNA level. ∗∗∗P < 0.001 vs Sham; ##P < 0.01 vs MIRI. P values were determined by means of t-tests and 1-way analyses of variance with Bonferroni multiple group comparisons. Data are presented as mean ± SEM. siNC = scrambled negative control siRNA.
Figure 5
Figure 5
Inhibition of Notch Signaling Pathway Promotes Cardiomyocyte Apoptosis (A, B) The effects of the Notch signaling pathway inhibitor DAPT on cardiomyocyte cell viability. n = 6. Magnification ×200. (C, D) The effects of DAPT on the contents of ROS. n = 8. Magnification ×200. (E) (F) TUNEL assay was used to investigate the effect of DAPT on apoptosis. n = 6. Magnification ×200. Data are presented as mean ± SEM. ∗∗∗P < 0.01 vs Ctl; ###P < 0.001 vs HR; and &&&P < 0.001 vs siZFAS1; t-tests and 1-way analyses of variance with Bonferroni multiple group comparisons. DAPI = 4′,6′-diamidino-2-phenylindole; DMSO = dimethylsulfoxide; other abbreviations as in Figure 1.
Figure 6
Figure 6
ZFAS1 Promotes DNA Methylation of Notch1 (A) The Notch1 gene’s genomic architecture is depicted in a diagram. (B) The expression level of Notch1 in NMCMs treated with 5-aza-2′-deoxycytidine (5′aza). n = 5. ∗P < 0.05 vs Ctl. (C) Schematic diagram of the bisulfite sequencing. (D) Bisulfite PCR analysis of the Notch1 promoter methylation level in WT and TG mice. (E) The binding region between ZFAS1 and Notch1 is depicted in this diagram. (F) The effect of ZFAS1 on Notch1 promoter activity in HEK293T cells with the use of a dual-luciferase reporter incorporating the Notch promoter. n = 3. ∗∗P < 0.01 vs Ctl. (G) The interaction of Notch1 with ZFAS1 in cardiomyocytes was examined with the use of the ChiRP assay. n = 3. ∗∗P < 0.01 vs AS-ZFAS1. (H) RIP analysis of specific associations of DNMT3b, DNMT3a, and DNMT1 with ZFAS1. n = 3. ∗P < 0.05 vs IgG; ∗∗P < 0.01 vs IgG. (I) ChIP analysis of associations of DNMT3b, DNMT3a, and DNMT1 with Notch1. n = 3. ∗P < 0.05 vs IgG. P values were determined by means of t-tests and 1-way analyses of variance with Bonferroni multiple group comparisons. Data are presented as mean ± SEM. DNMT = DNA methyltransferase; PCR = polymerase chain reaction; other abbreviations as in Figures 1 and 2.
Figure 7
Figure 7
The Function of mut-ZFAS1 in the Myocardium (A) Nucleotide sequence of mut-ZFAS1 after mutating ZFAS1 and Notch1 binding site. (B, C) Notch1 mRNA (n = 5) and NICD protein (n = 7) levels in ZFAS1- and mut-ZFAS1–transfected cardiomyocytes. (D, E) Hey1 mRNA (n = 9) and protein (n = 6) levels in ZFAS1- and mut-ZFAS1–transfected cardiomyocytes. (F) Hes1 mRNA expression in cardiomyocytes transfected with ZFAS1 and mut-ZFAS1. n = 10. (G, H) The effects of ZFAS1 and mut-ZFAS1 on cardiomyocyte cell viability. n = 7. (I, J) The effects of ZFAS1 and mut-ZFAS1 on cardiomyocytes were detected by means of TUNEL staining. n = 7. Magnification ×200. (K, L) The contents of ROS of cardiomyocytes transfected with ZFAS1 and mut-ZFAS1. n = 13. Magnification ×200. Data are presented as mean ± SEM. ∗P < 0.05; ∗∗P < 0.01; ∗∗∗P < 0.001; t-tests and one-way analyses of variance with Bonferroni multiple group comparisons. Abbreviations as in Figures 1 and 3.
Figure 8
Figure 8
NMN Is a Potential Therapeutic Strategy to Ameliorate MIRI (A) Schematic diagram of the binding site of NMN and DNMT3b by molecular docking. (B) CETSA was used to detect the binding of NMN to DNMT3b. (C) Statistical results of CETSA: the protein level of DNMT3b at different temperatures after treatment with NMN and DMSO. n = 3. ∗P < 0.05 vs DMSO. (D) NMN promotes the mRNA expression of Notch1 in HR-treated cardiomyocytes. n = 8. ∗P < 0.05 vs Ctl; #P < 0.05 vs HR. (E) NMN promotes the protein expression of NICD in HR-treated cardiomyocytes. n = 5. ∗P < 0.05 vs Ctl; #P < 0.05 vs HR. (F) NMN increased the cell viability of HR-treated cells according to CCK8 assay. n = 10. ∗∗∗P < 0.001 vs Ctl; #P < 0.05 vs HR. (G, I, J) The effects of NMN on HR-treated cardiomyocytes cell viability. n = 6, ∗∗∗P < 0.001 vs Ctl, ###P < 0.001 vs MIRI, Magnification × 200. (H, K) The effects of NMN on HR-treated cardiomyocytes were detected with the use of TUNEL staining. n = 5. ∗∗∗P < 0.001 vs Ctl; ###P < 0.001 vs MIRI., Magnification ×200. (L) Experimental timeline. (M) Repair of cardiac function by NMN in MIRI mice. n = 10. ∗∗∗P < 0.001 vs Sham; ###P < 0.001 vs MIRI. (N) The effect of NMN on the infarct size of MIRI mice according to TTC. Data are presented as mean ± SEM. ∗P < 0.05; ∗∗P < 0.01; ∗∗∗P < 0.001; t-tests and one-way analyses of variance with Bonferroni multiple group comparisons. ip = intraperitoneal; NMN = nicotinamide mononucleotide; other abbreviations as in Figures 1, 5, and 6.

References

    1. Benjamin E.J., Blaha M.J., Chiuve S.E., et al. Heart disease and stroke statistics—2017 update: a report from the American Heart Association. Circulation. 2017;135:e146–e603. - PMC - PubMed
    1. DeWood M.A., Spores J., Notske R., et al. Prevalence of total coronary occlusion during the early hours of transmural myocardial infarction. N Engl J Med. 1980;303:897–902. - PubMed
    1. Perrelli M.G., Pagliaro P., Penna C. Ischemia/reperfusion injury and cardioprotective mechanisms: role of mitochondria and reactive oxygen species. World J Cardiol. 2011;3:186–200. - PMC - PubMed
    1. Okura T., Gong L., Kamitani T., et al. Protection against Fas/APO-1– and tumor necrosis factor–mediated cell death by a novel protein, sentrin. J Immunol. 1996;157:4277–4281. - PubMed
    1. MacGrogan D., Munch J., de la Pompa J.L. Notch and interacting signalling pathways in cardiac development, disease, and regeneration. Nat Rev Cardiol. 2018;15:685–704. - PubMed

LinkOut - more resources