. 2022 Nov 29;146(22):1694-1711.
doi: 10.1161/CIRCULATIONAHA.121.058777. Epub 2022 Nov 1.

Hippo-Yap Signaling Maintains Sinoatrial Node Homeostasis

Affiliations

Hippo-Yap Signaling Maintains Sinoatrial Node Homeostasis

Mingjie Zheng et al. Circulation. .

Abstract

Background: The sinoatrial node (SAN) functions as the pacemaker of the heart, initiating rhythmic heartbeats. Despite its importance, the SAN is one of the most poorly understood cardiac entities because of its small size and complex composition and function. The Hippo signaling pathway is a molecular signaling pathway fundamental to heart development and regeneration. Although abnormalities of the Hippo pathway are associated with cardiac arrhythmias in human patients, the role of this pathway in the SAN is unknown.

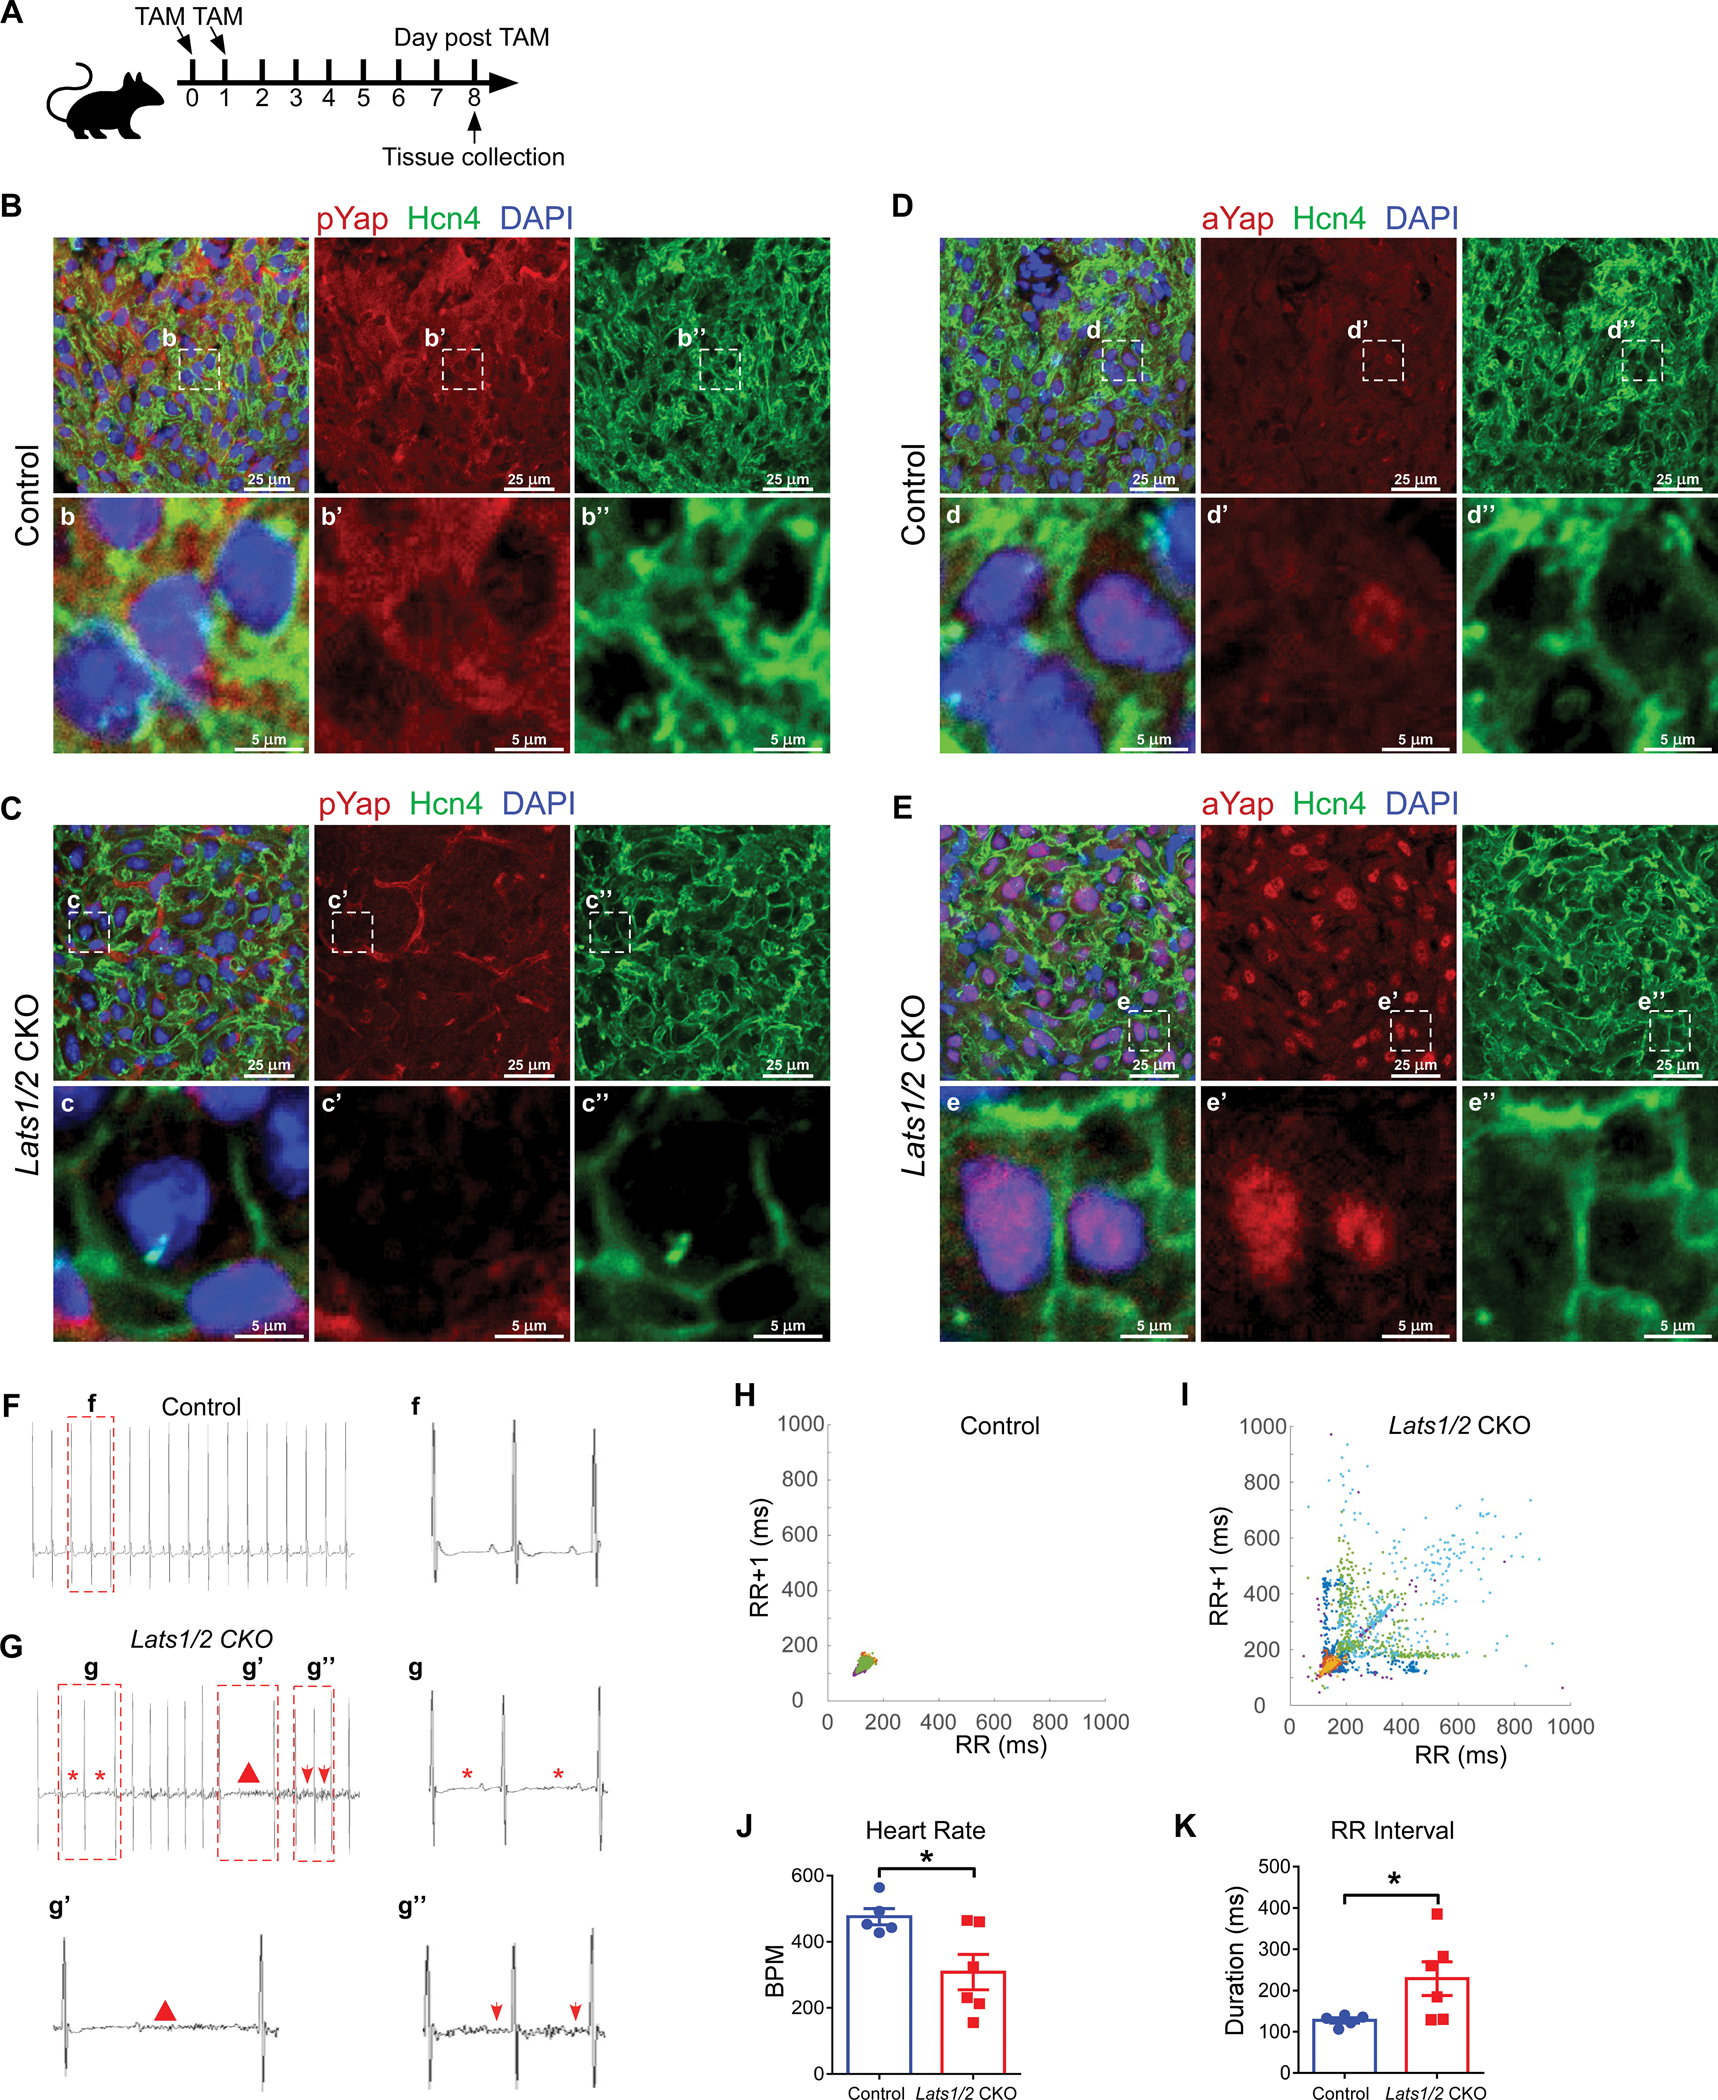
Methods: We investigated key regulators of the Hippo pathway in SAN pacemaker cells by conditionally inactivating the Hippo signaling kinases Lats1 and Lats2 using the tamoxifen-inducible, cardiac conduction system-specific Cre driver Hcn4CreERT2 with Lats1 and Lats2 conditional knockout alleles. In addition, the Hippo-signaling effectors Yap and Taz were conditionally inactivated in the SAN. To determine the function of Hippo signaling in the SAN and other cardiac conduction system components, we conducted a series of physiological and molecular experiments, including telemetry ECG recording, echocardiography, Masson Trichrome staining, calcium imaging, immunostaining, RNAscope, cleavage under targets and tagmentation sequencing using antibodies against Yap1 or H3K4me3, quantitative real-time polymerase chain reaction, and Western blotting. We also performed comprehensive bioinformatics analyses of various datasets.

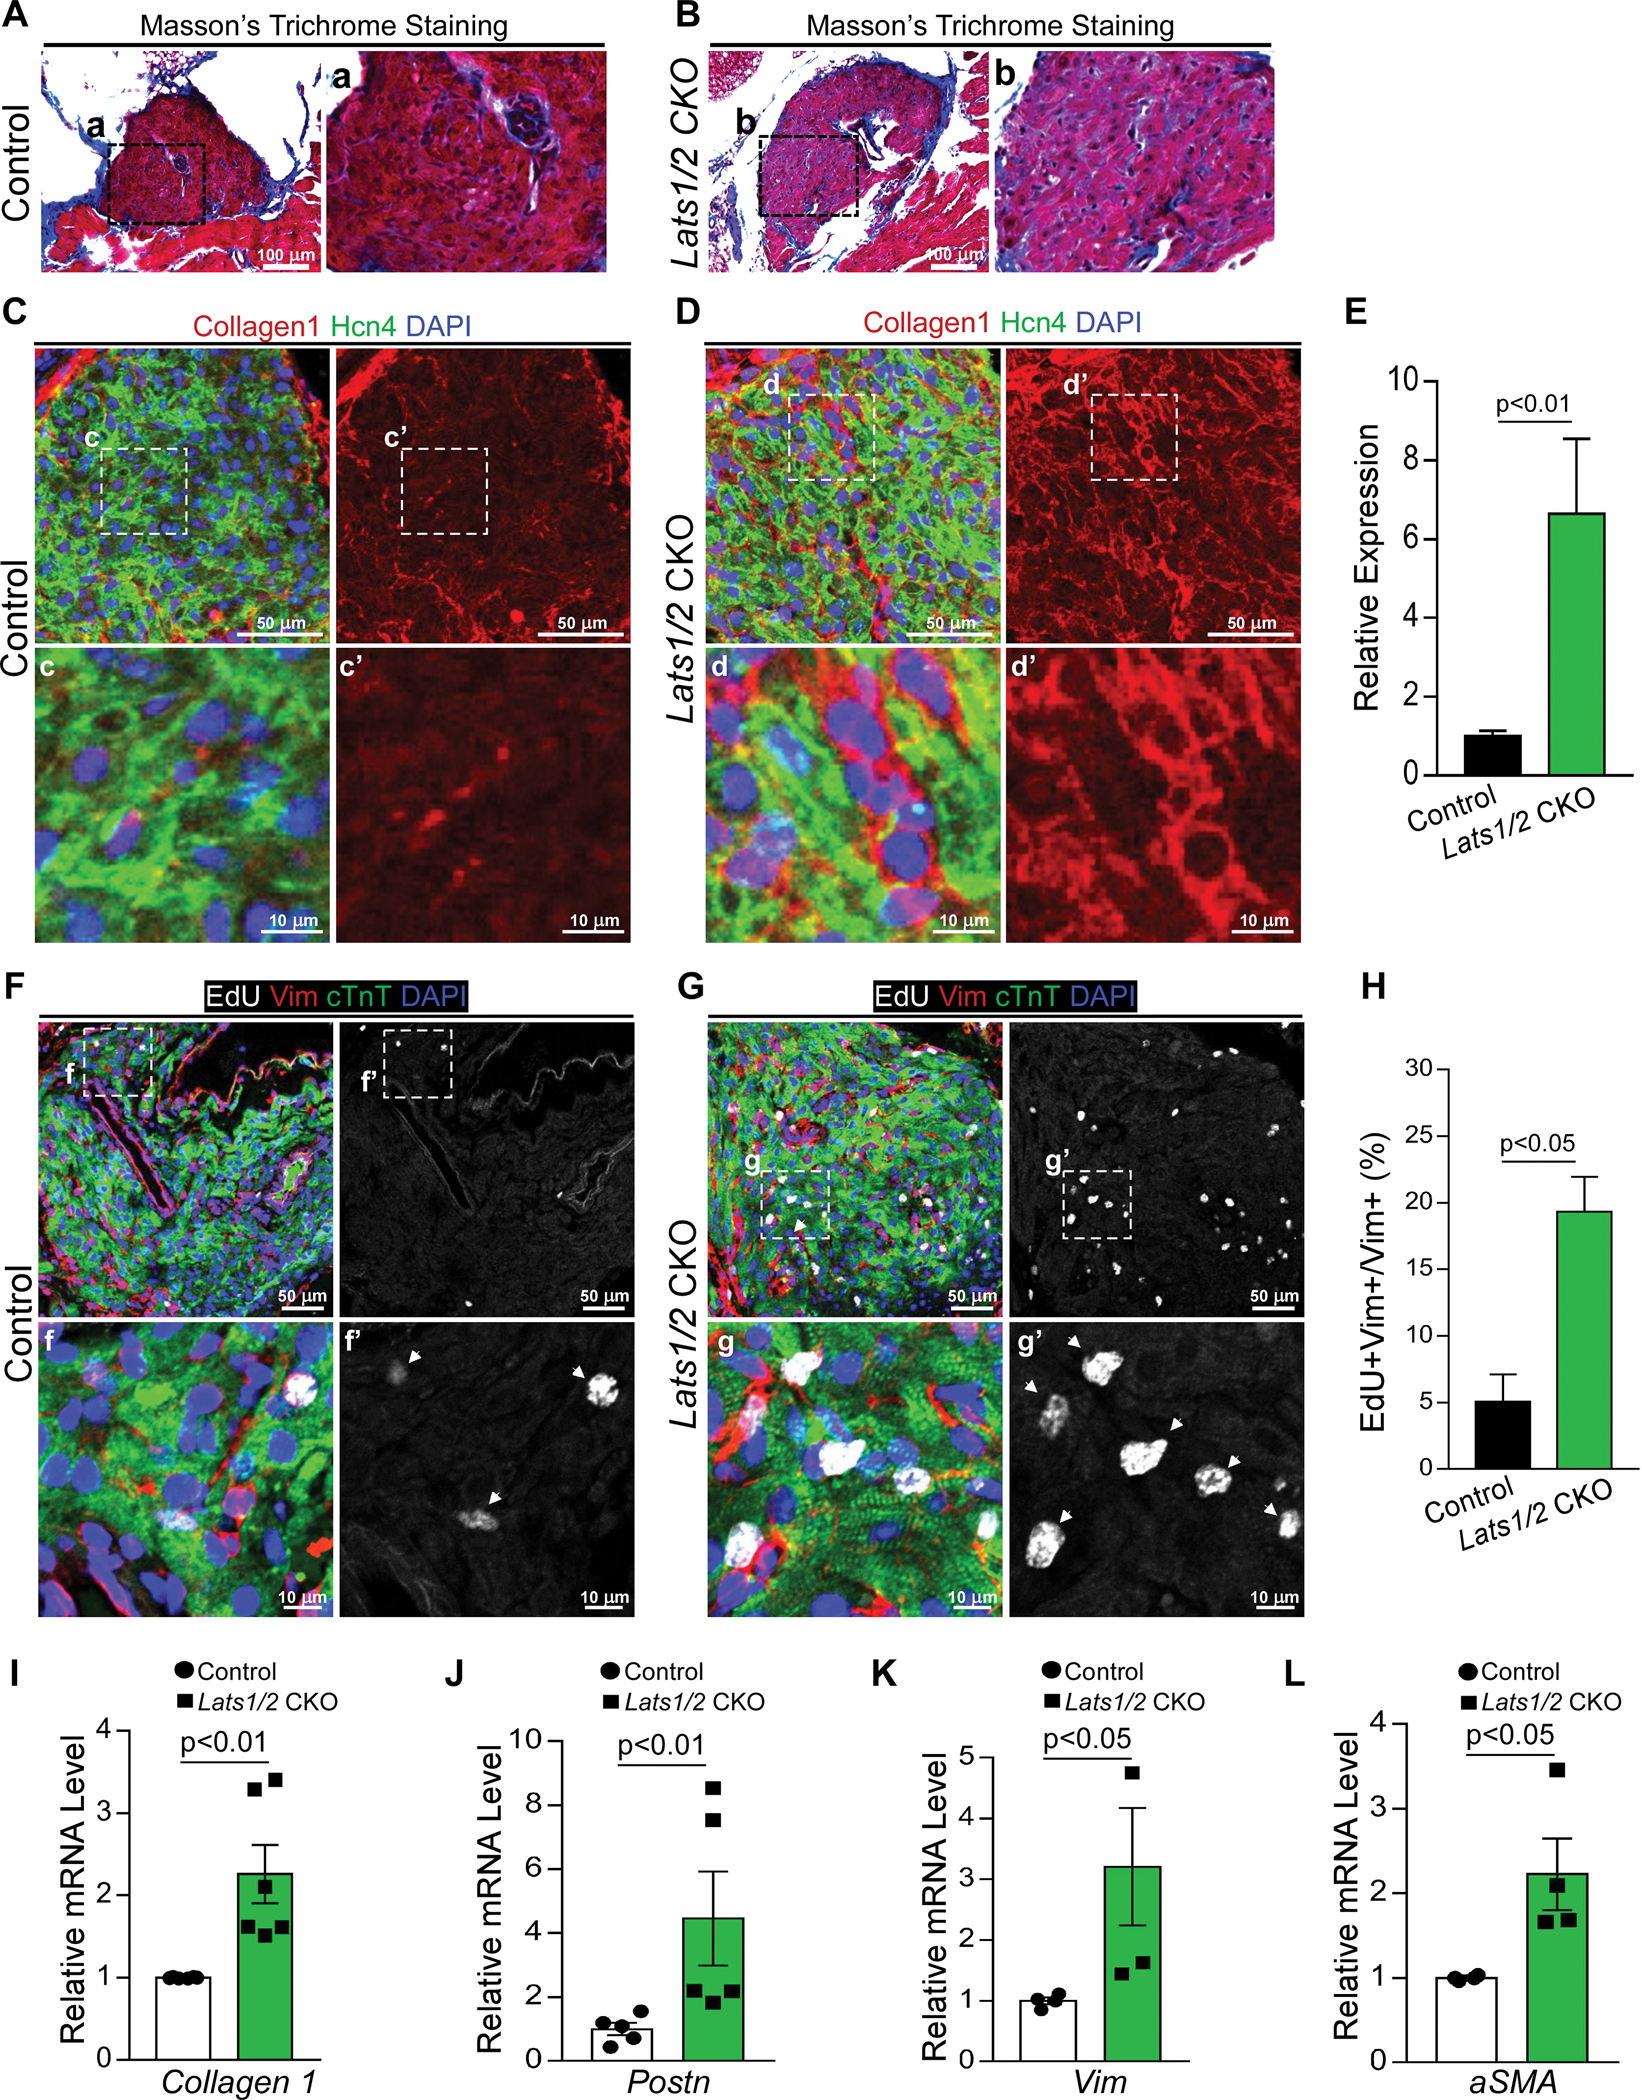
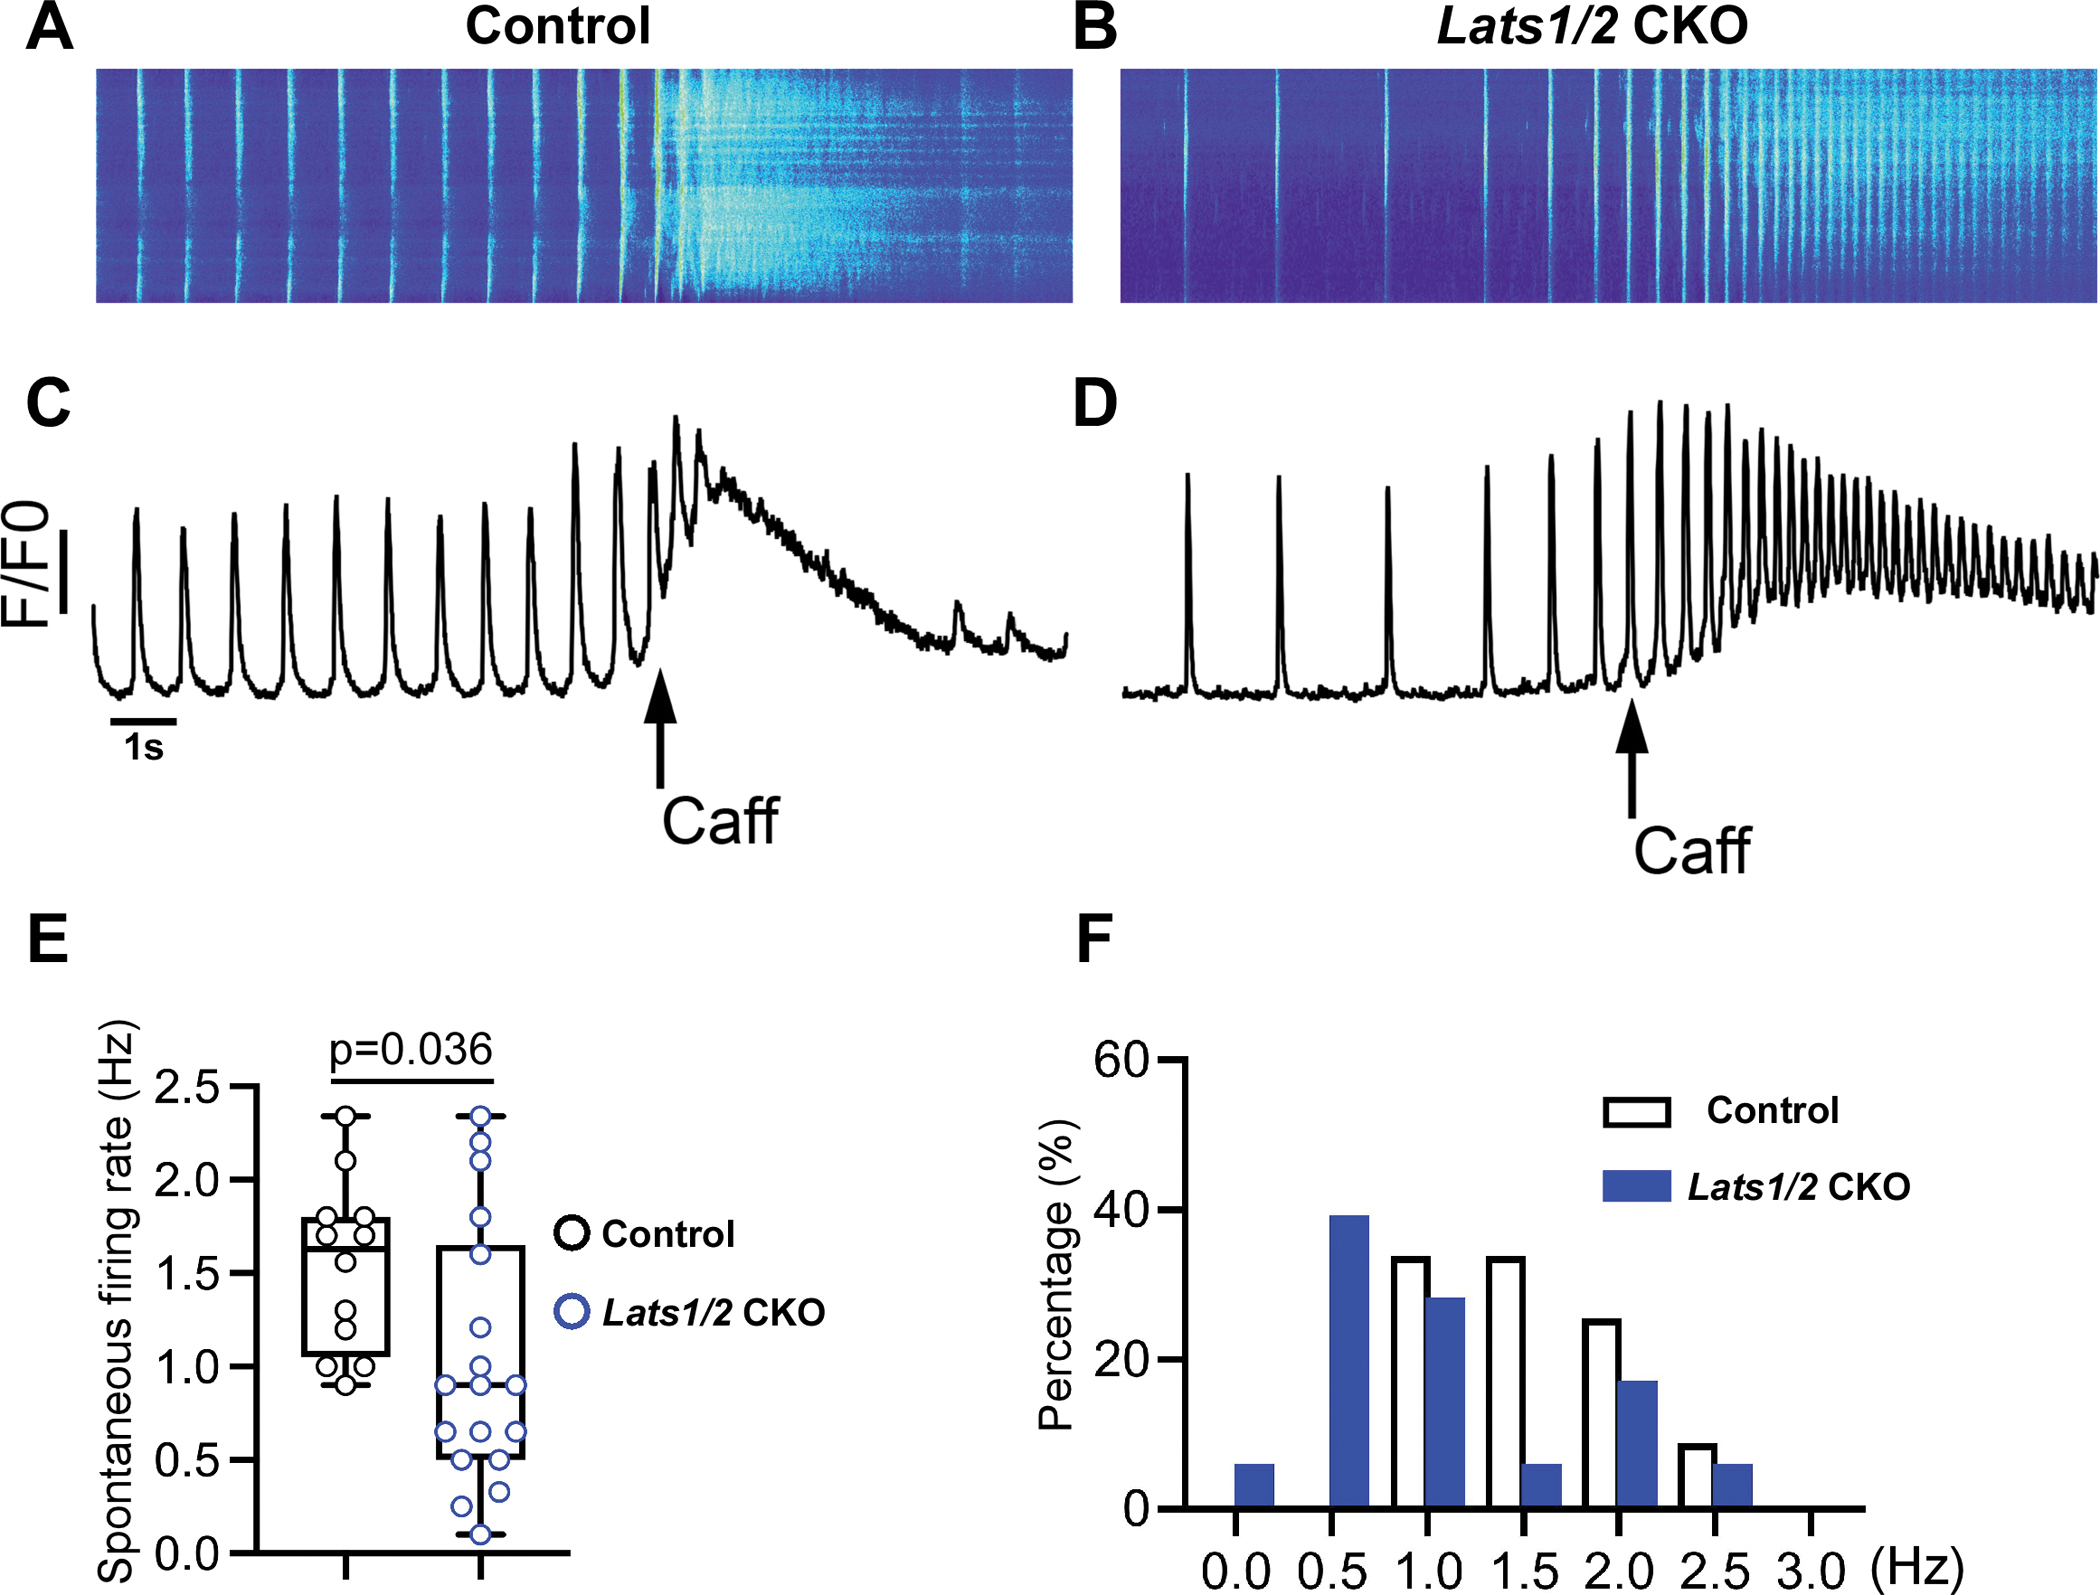
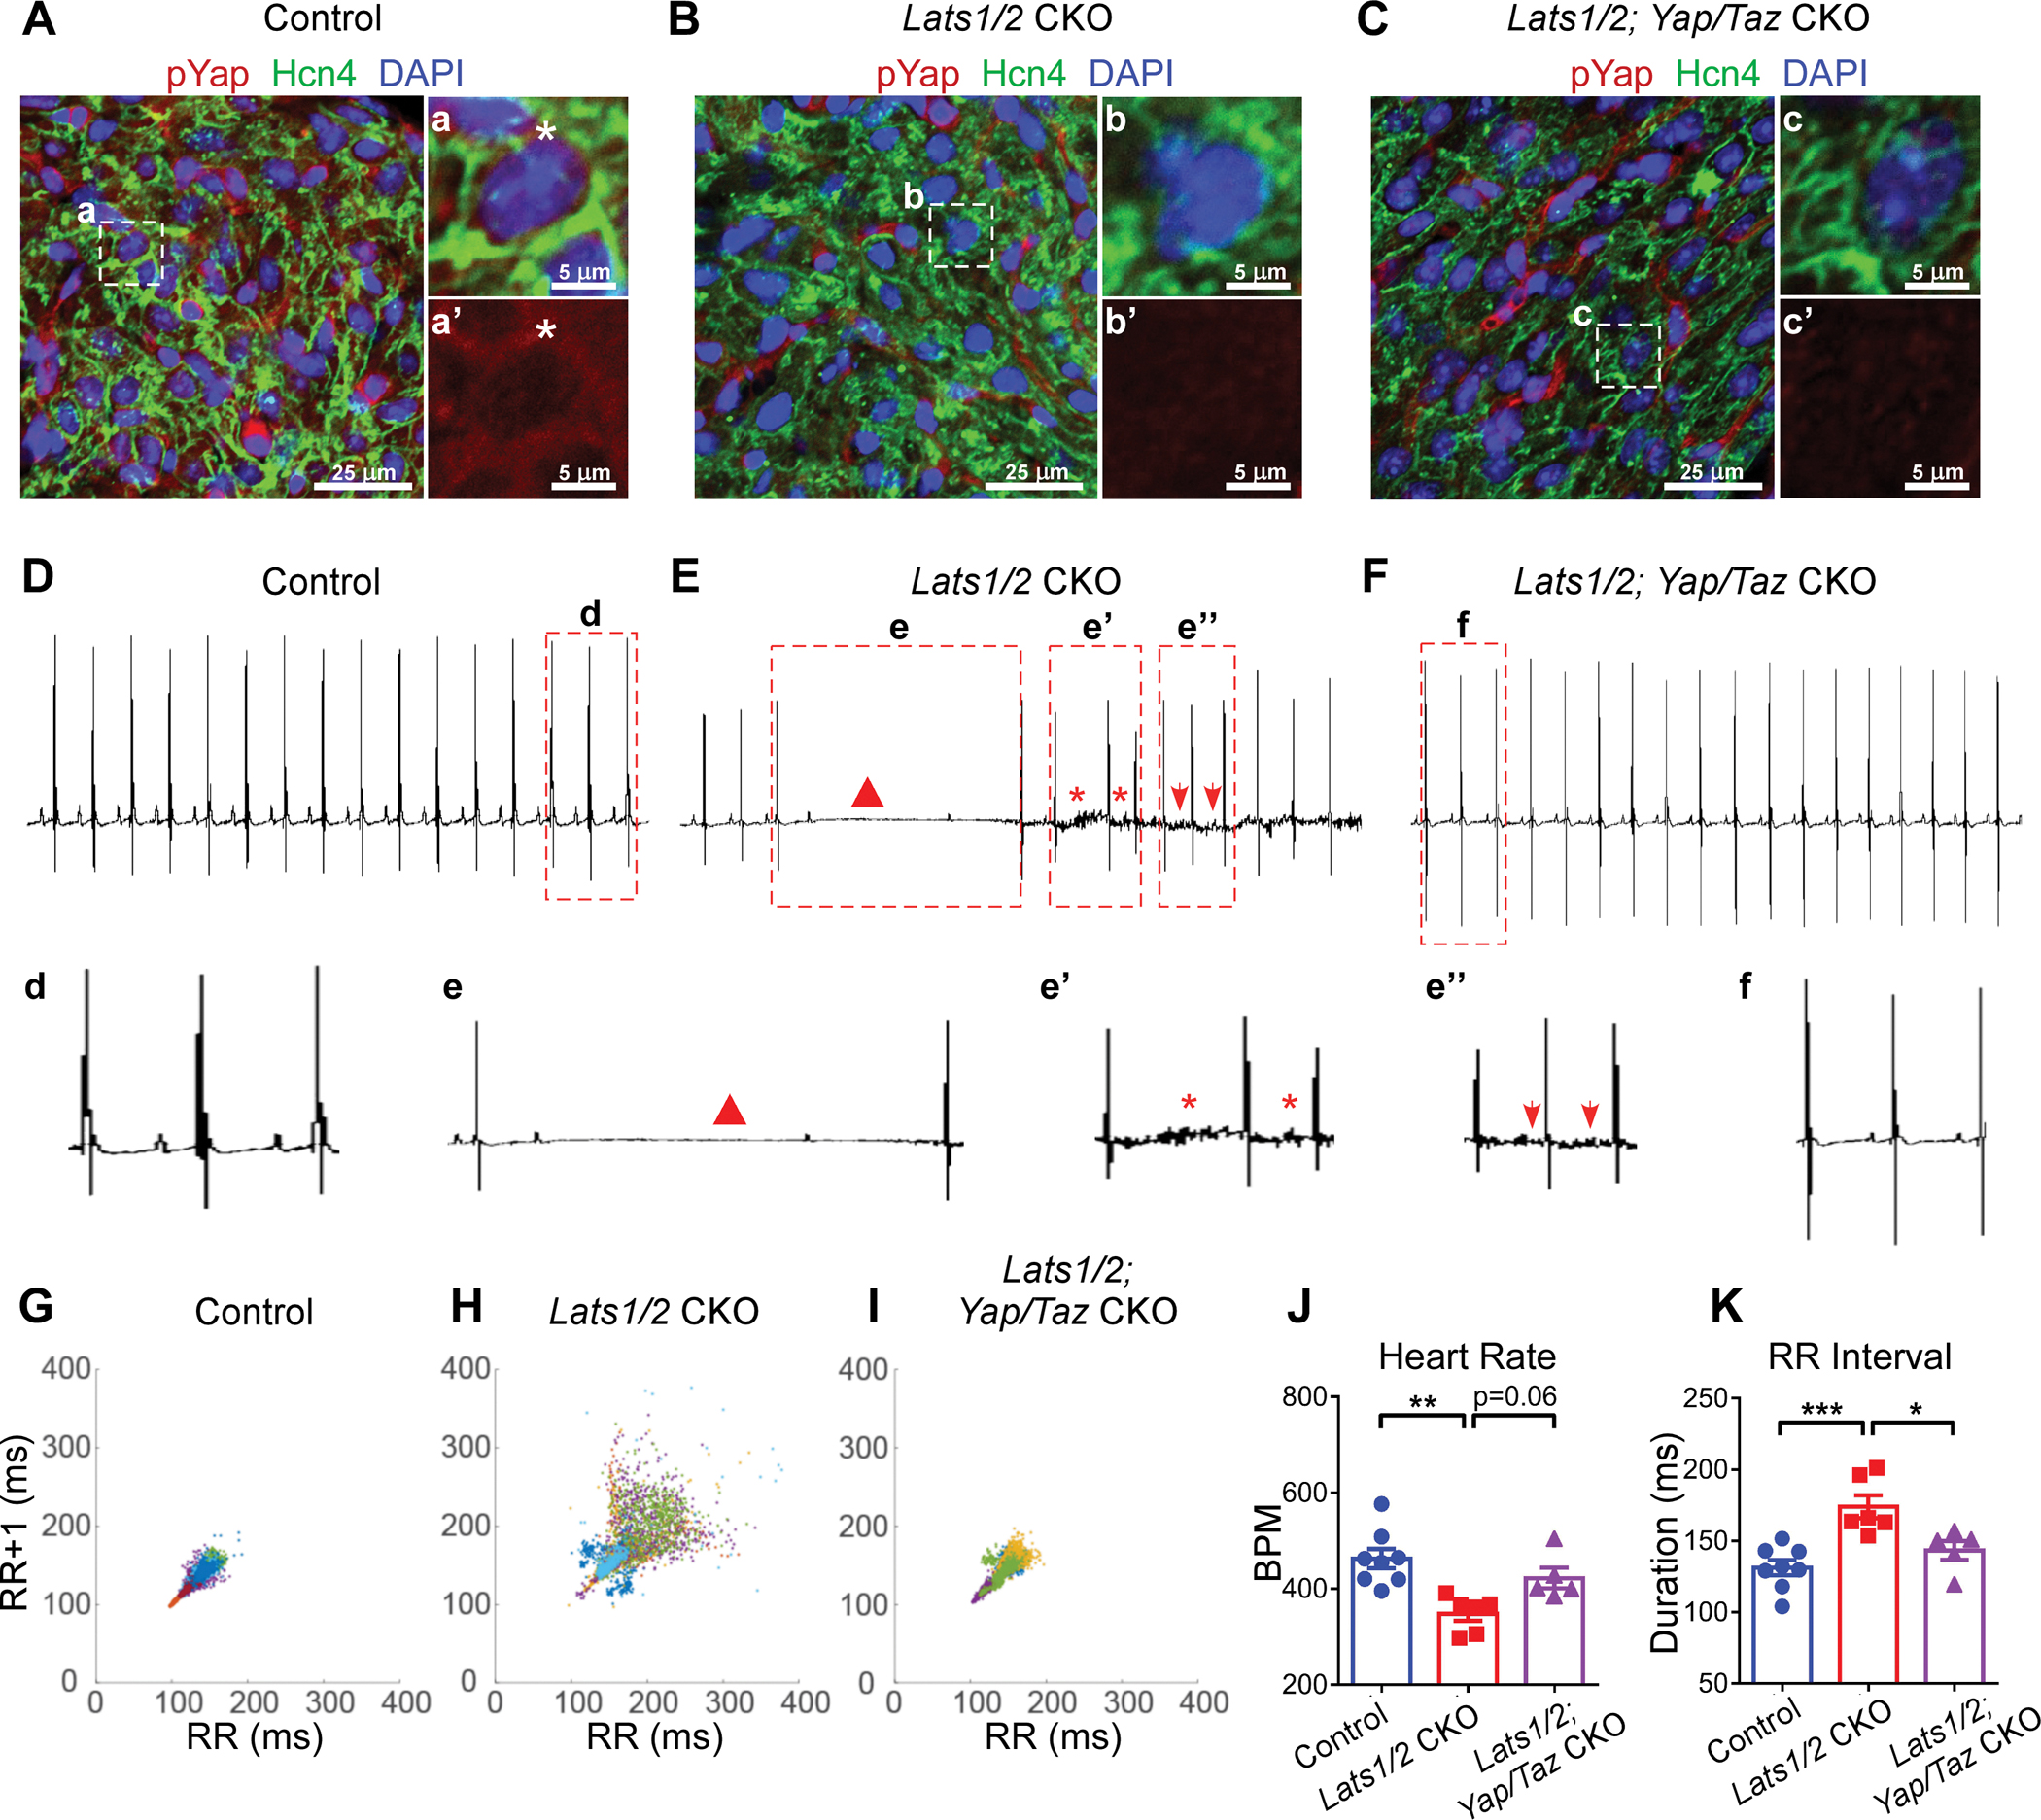
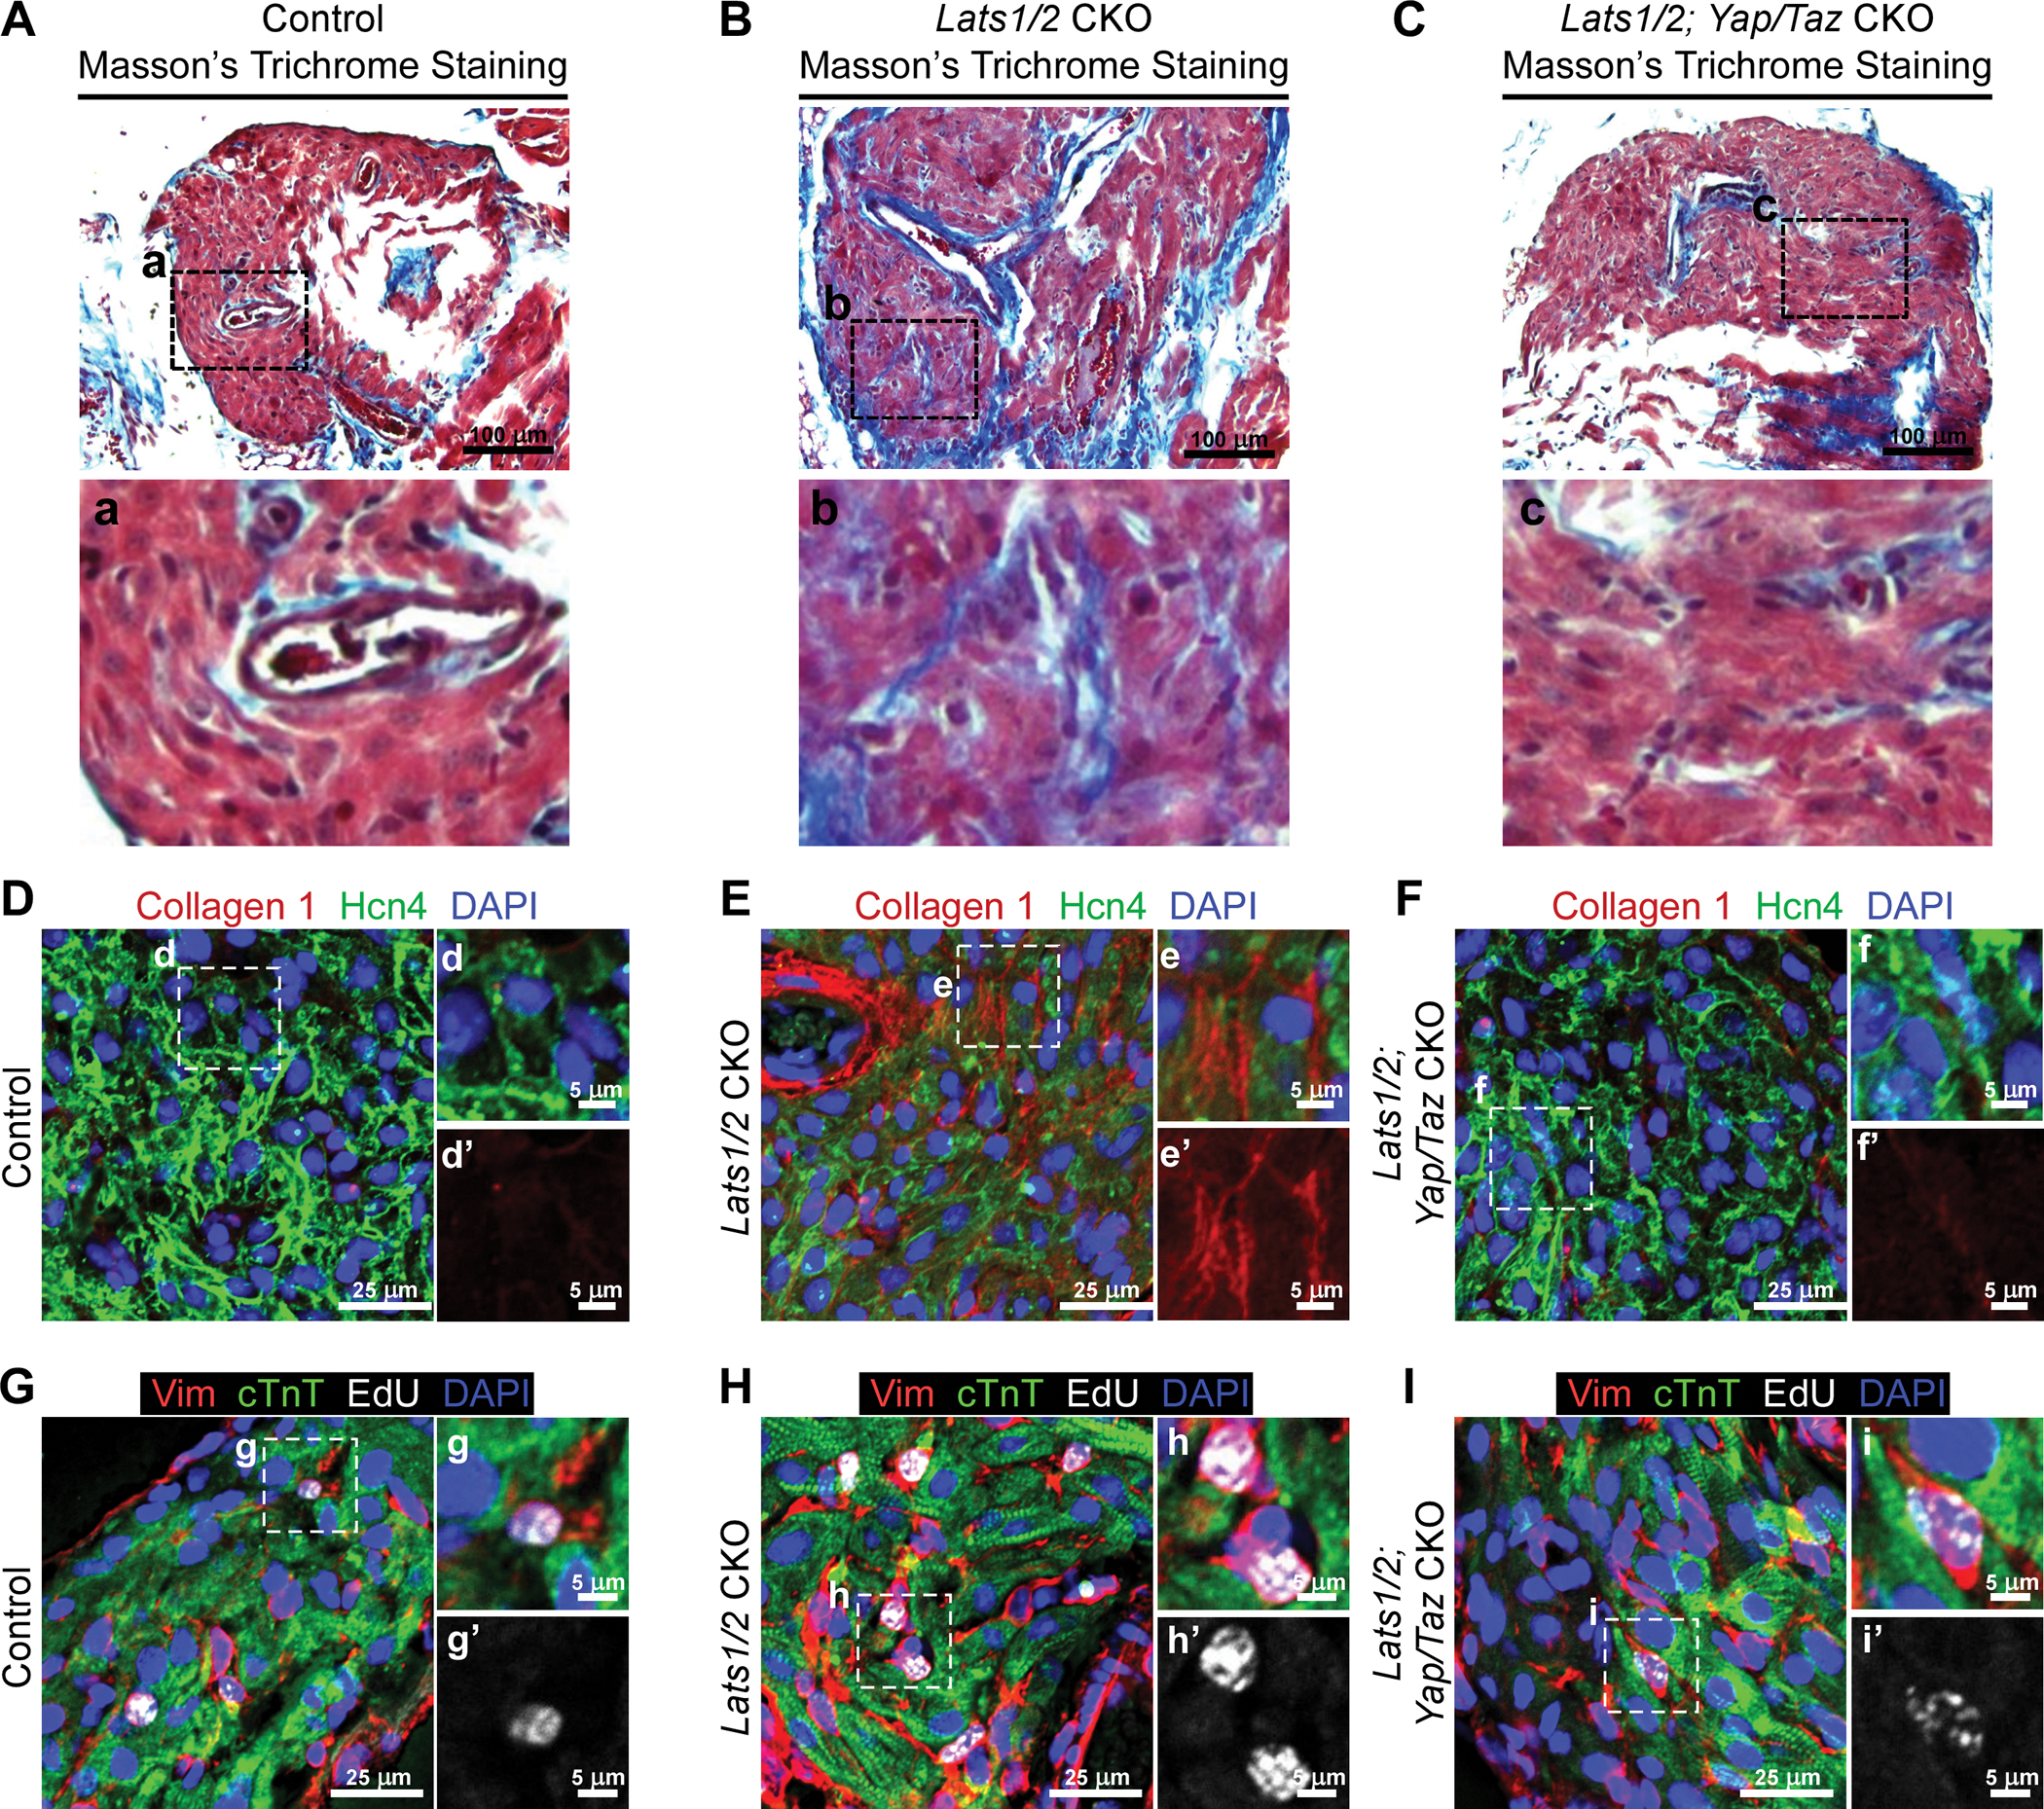
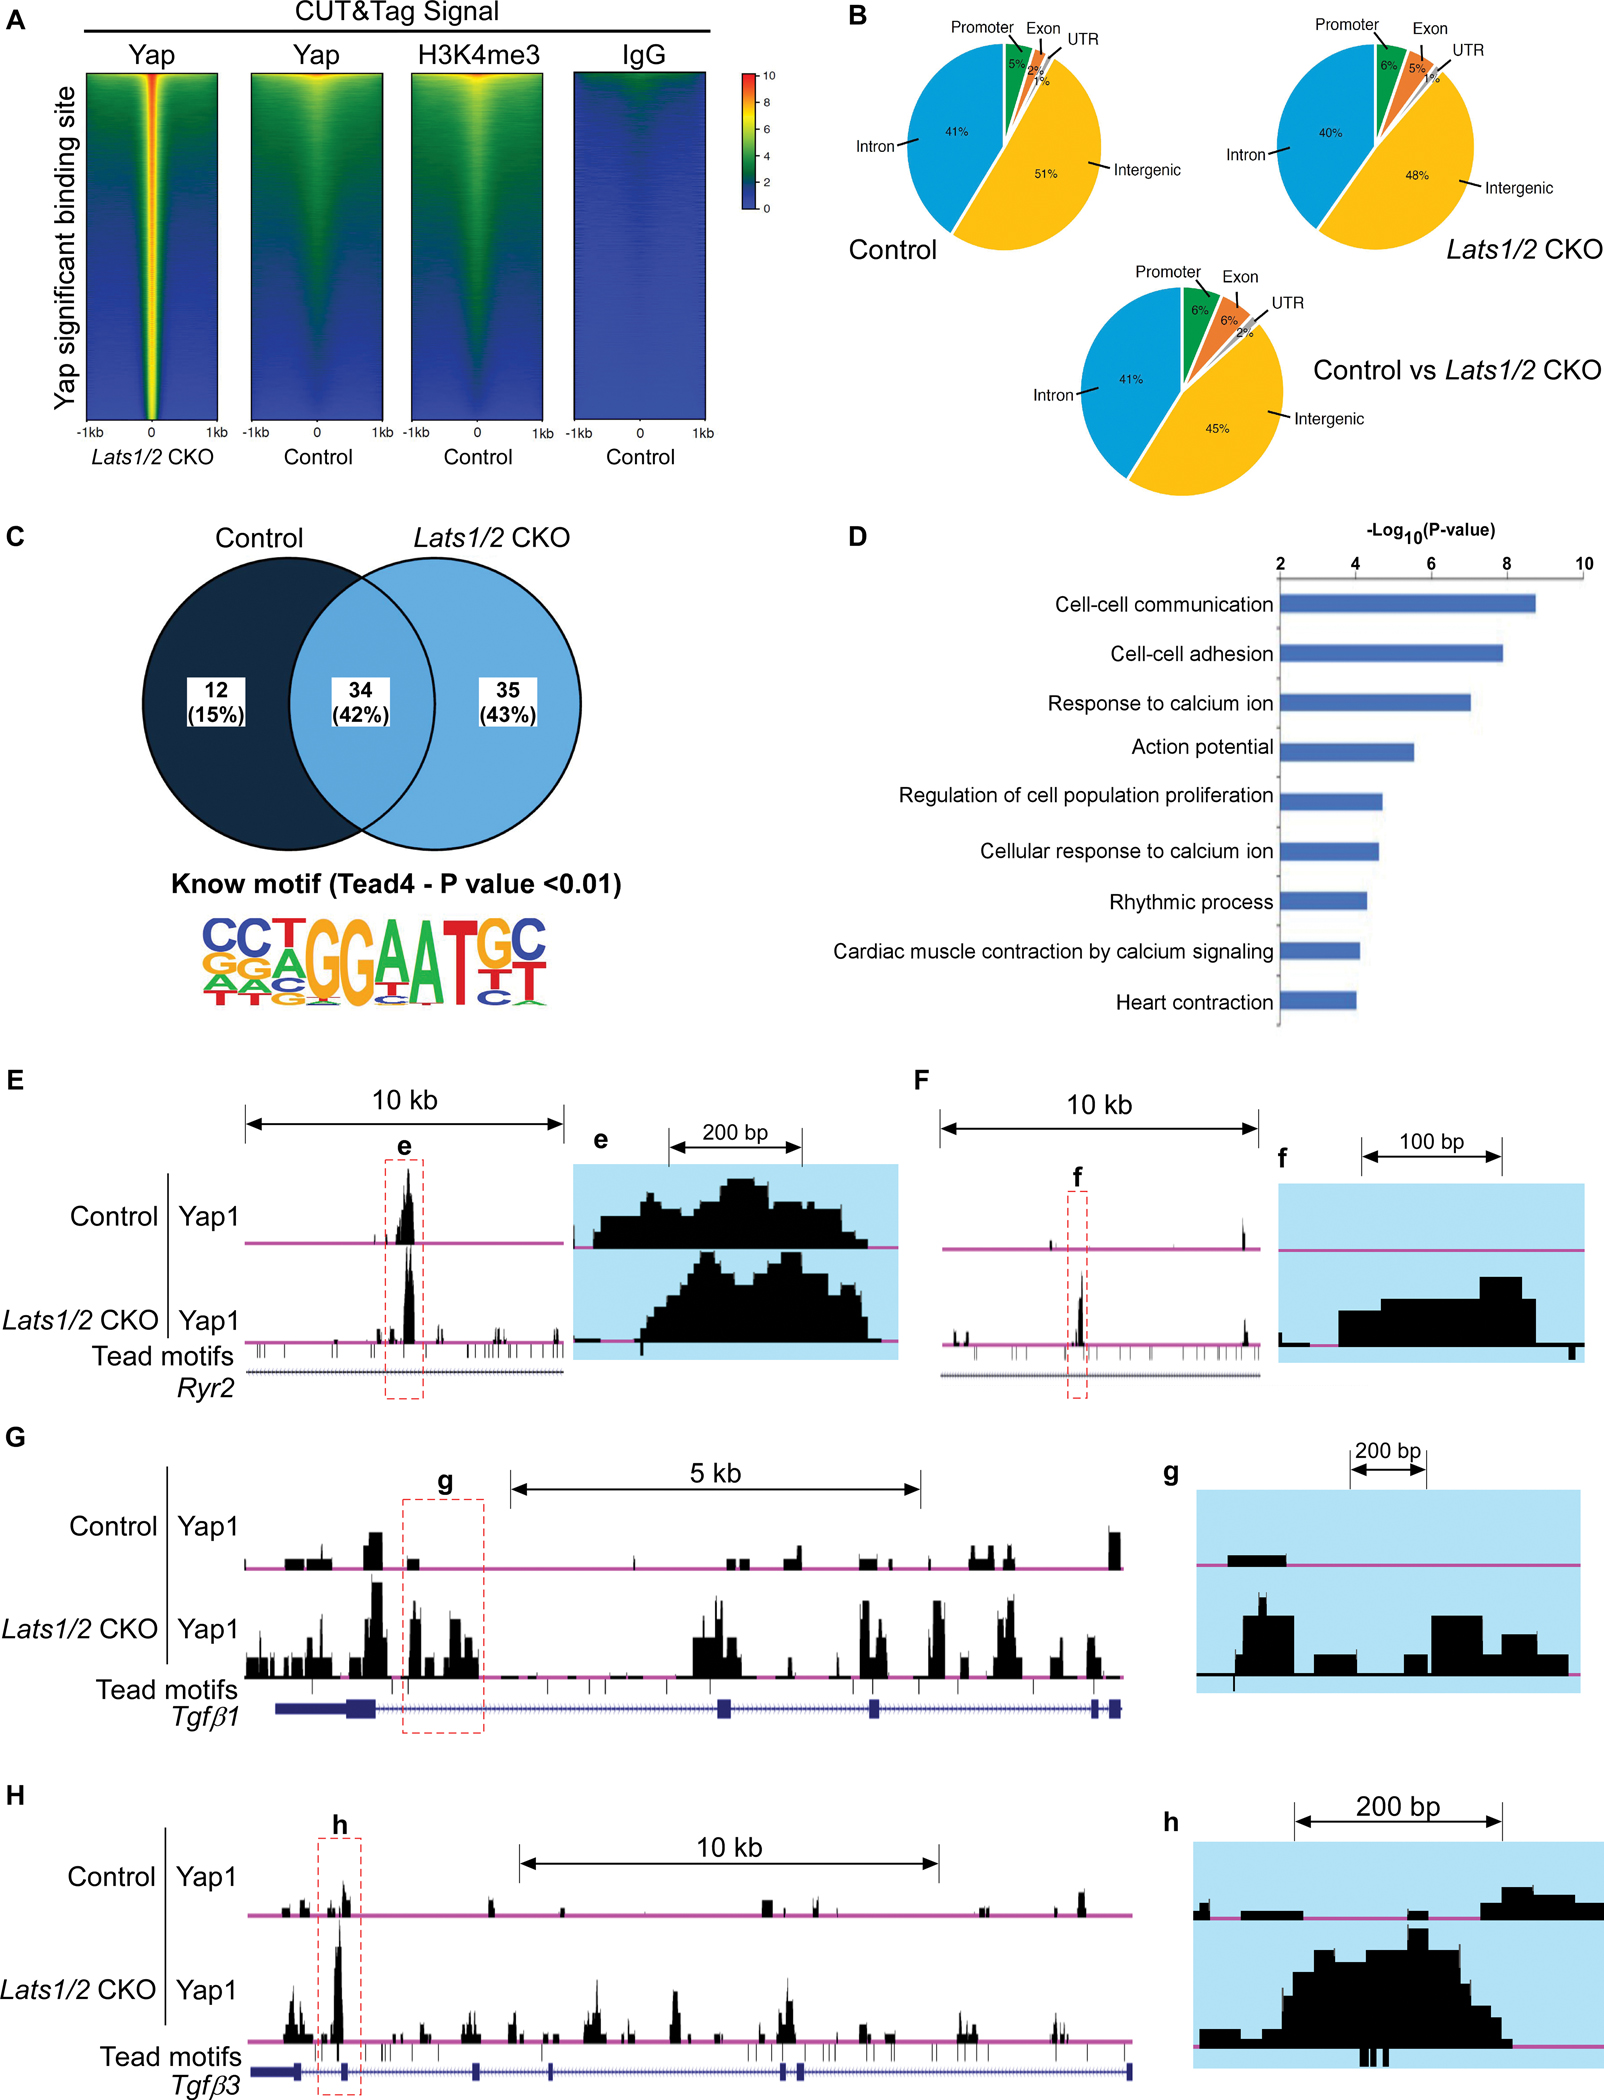
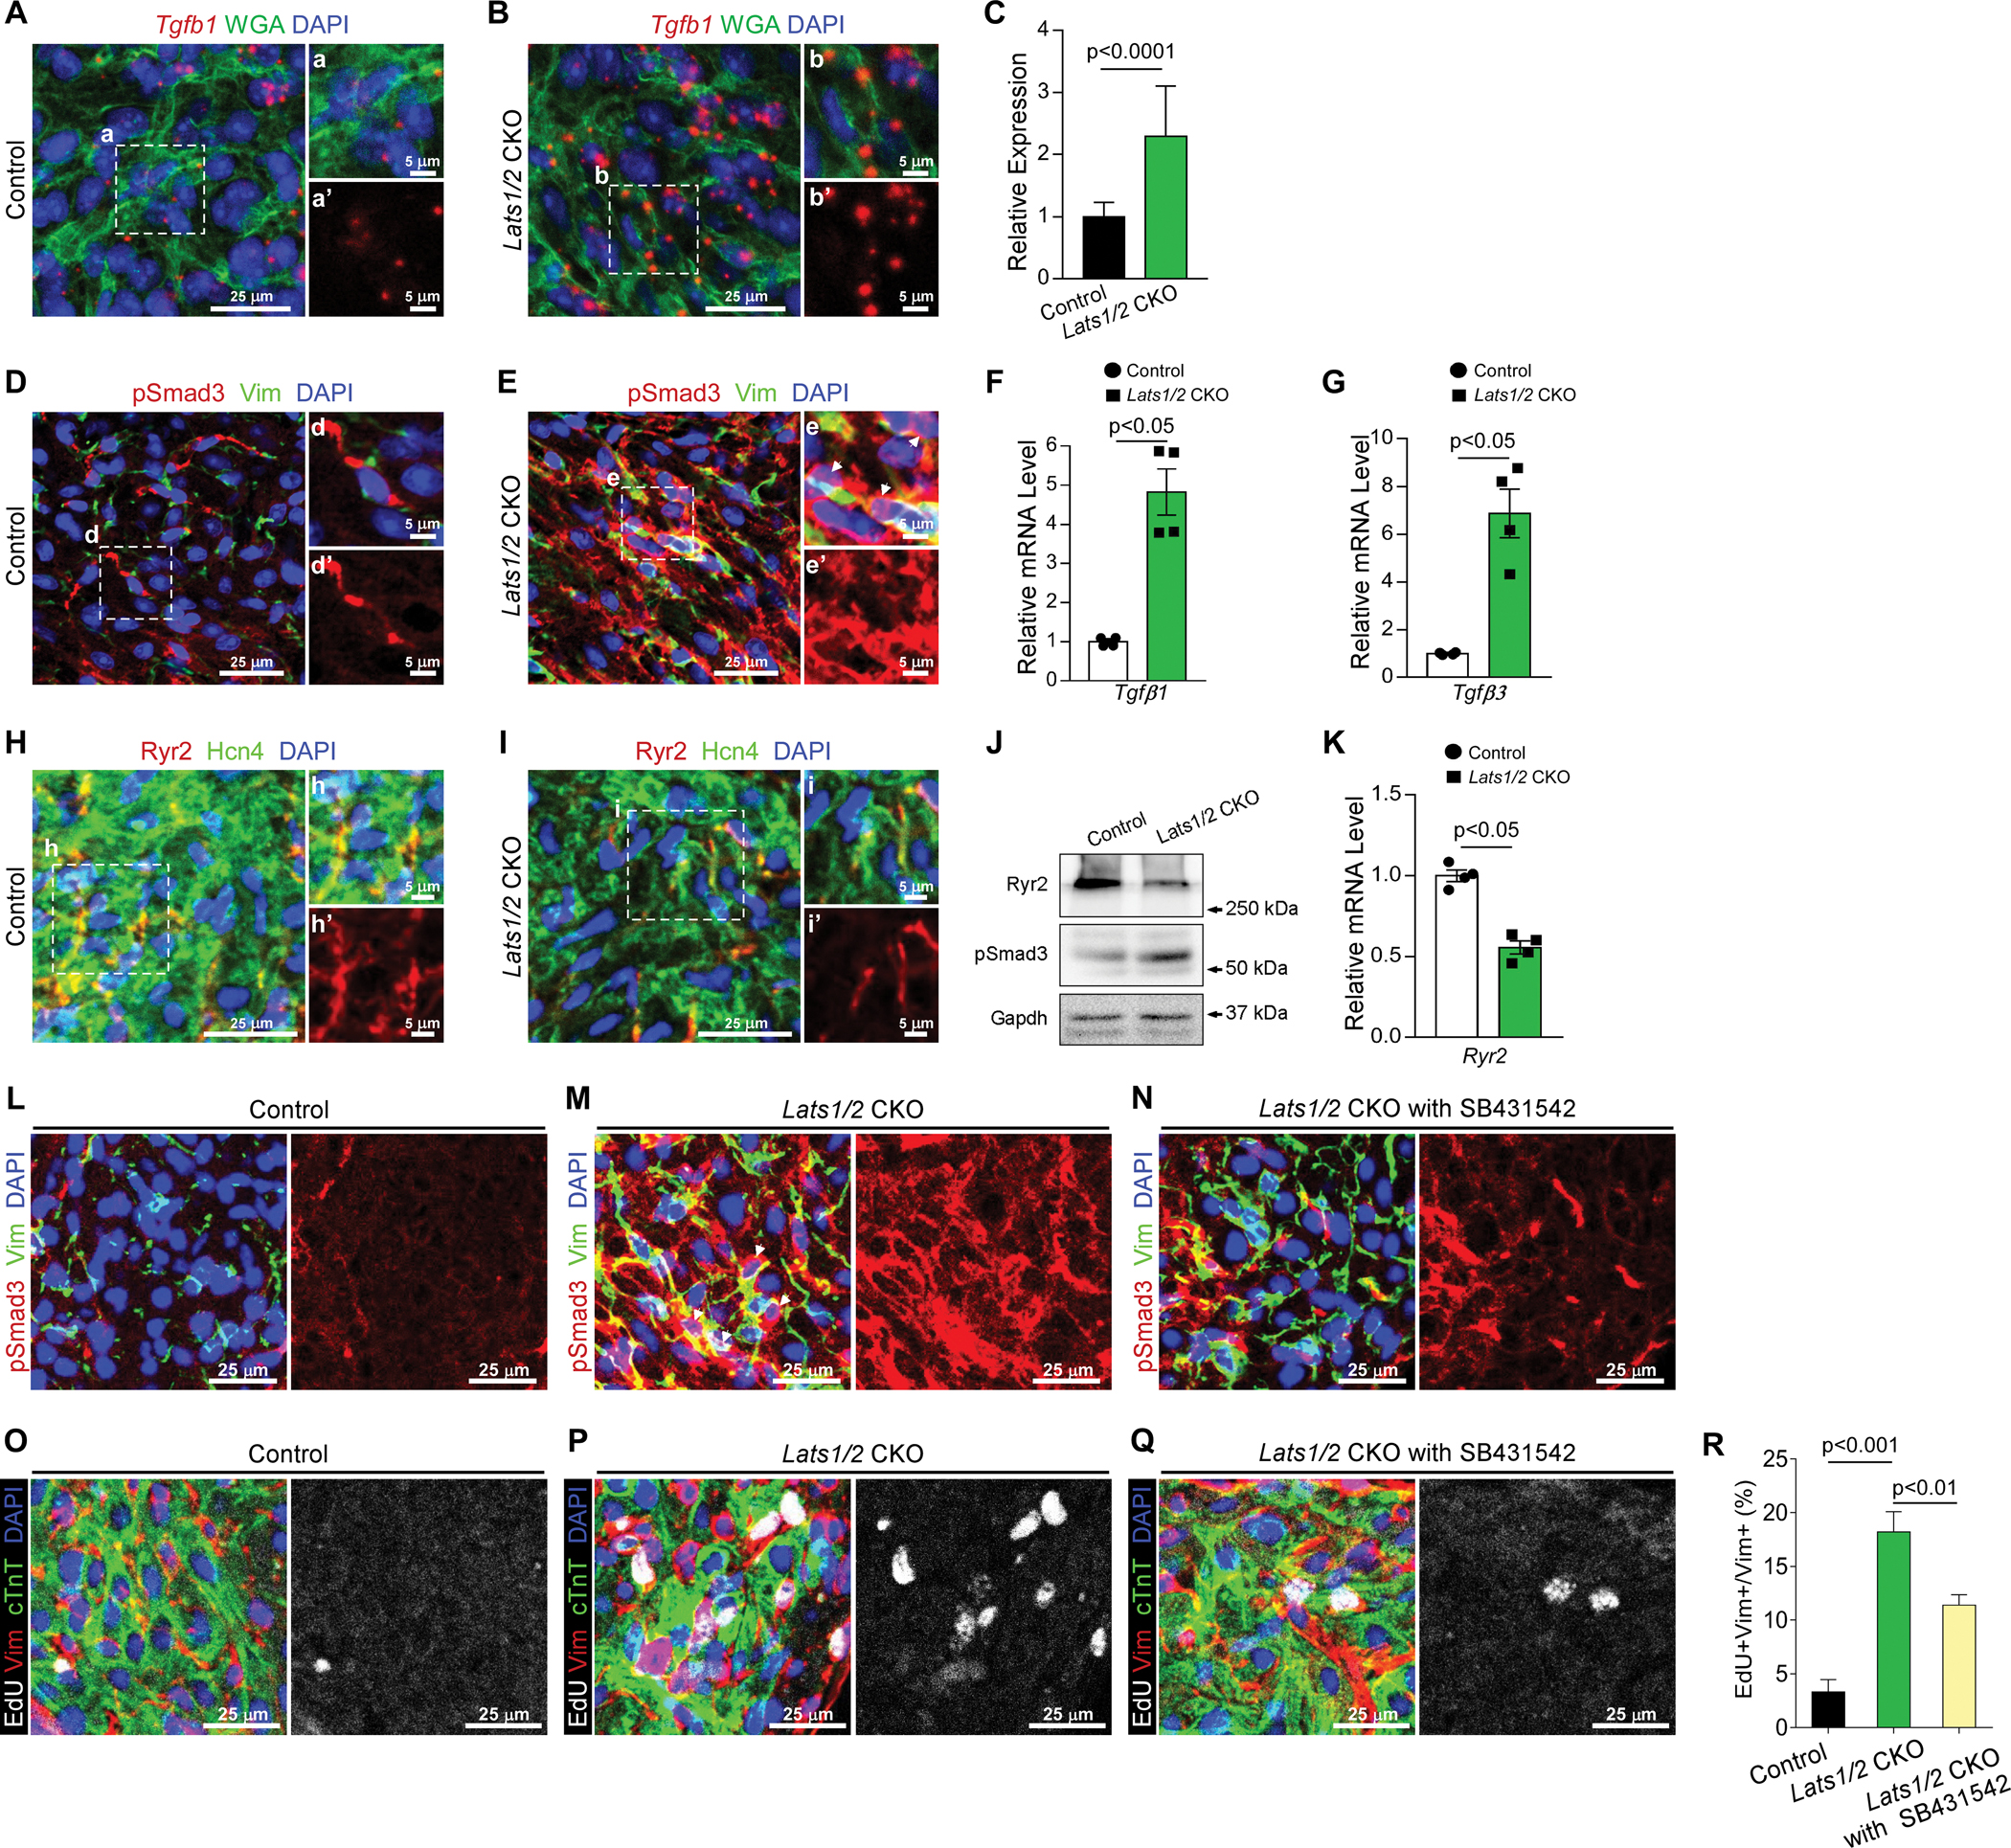
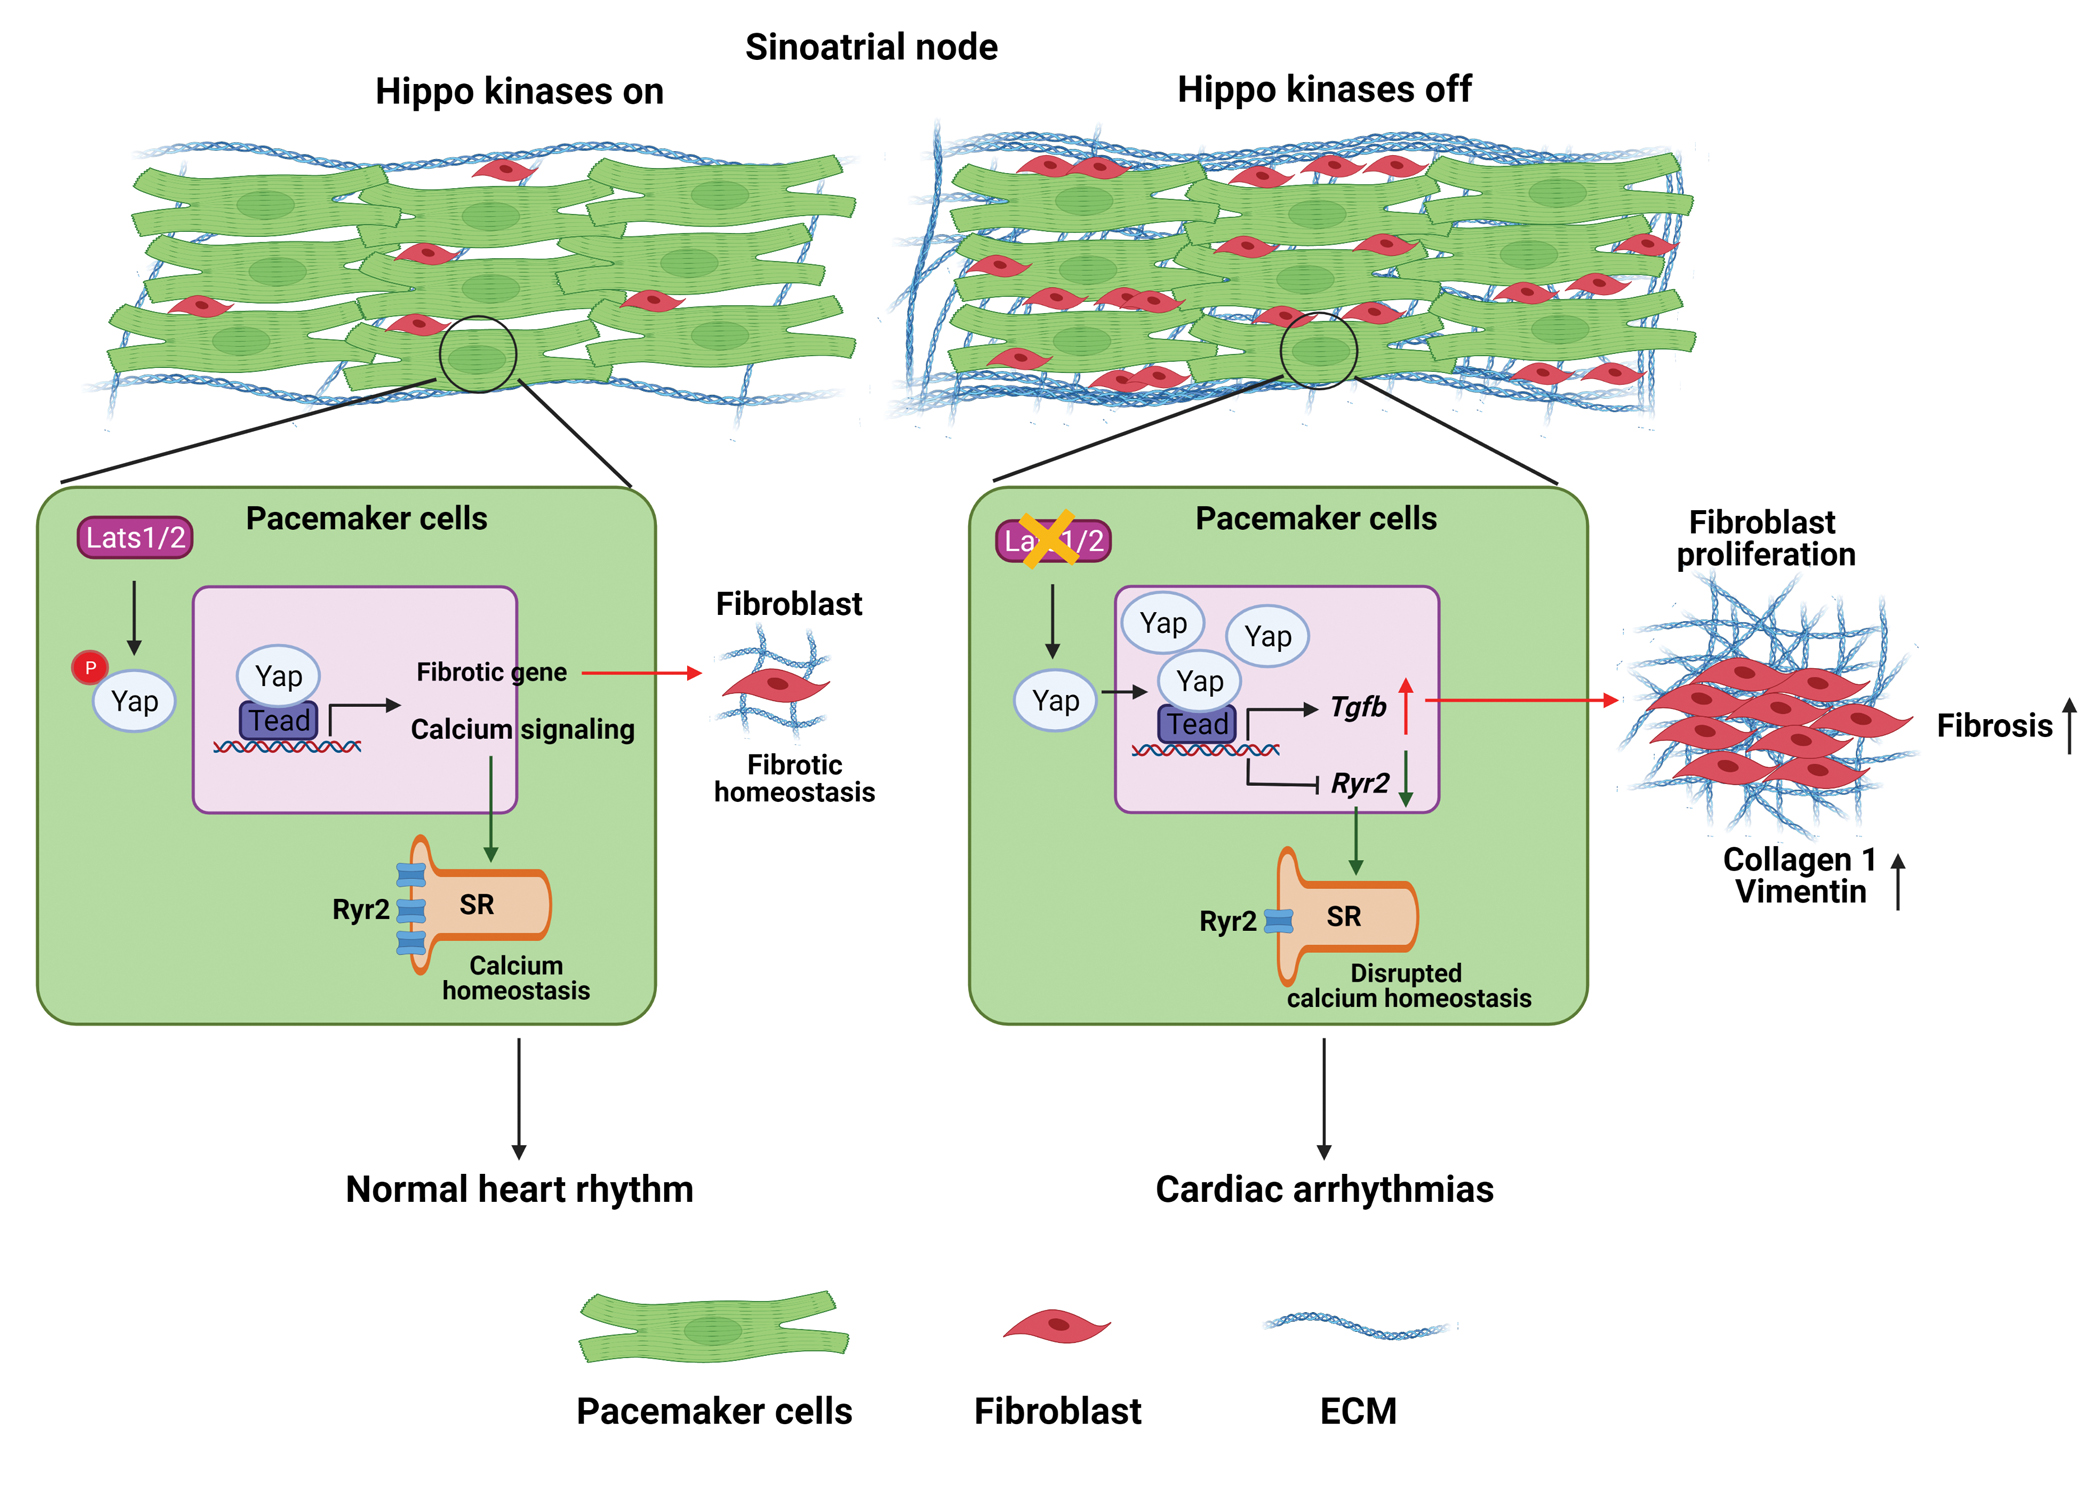
Results: We found that Lats1/2 inactivation caused severe sinus node dysfunction. Compared with the controls, Lats1/2 conditional knockout mutants exhibited dysregulated calcium handling and increased fibrosis in the SAN, indicating that Lats1/2 function through both cell-autonomous and non-cell-autonomous mechanisms. It is notable that the Lats1/2 conditional knockout phenotype was rescued by genetic deletion of Yap and Taz in the cardiac conduction system. These rescued mice had normal sinus rhythm and reduced fibrosis of the SAN, indicating that Lats1/2 function through Yap and Taz. Cleavage Under Targets and Tagmentation sequencing data showed that Yap potentially regulates genes critical for calcium homeostasis such as Ryr2 and genes encoding paracrine factors important in intercellular communication and fibrosis induction such as Tgfb1 and Tgfb3. Consistent with this, Lats1/2 conditional knockout mutants had decreased Ryr2 expression and increased Tgfb1 and Tgfb3 expression compared with control mice.

Conclusions: We reveal, for the first time to our knowledge, that the canonical Hippo-Yap pathway plays a pivotal role in maintaining SAN homeostasis.

Keywords: Hippo signaling pathway; calcium homeostasis; fibrosis; sinus node dysfunction; transforming growth factor-β.


Figures

Figure 1.
Figure 1.. Inducible cardiac conduction system (CCS)-specific Lats1/2 deletion induces cardiac arrhythmias.
A. Experimental strategy for CCS-specific Cre activation and tissue collection. Cre activity was induced with 2 consecutive intraperitoneal injections of tamoxifen. B-C. Representative images of immunofluorescence staining of pYap in the SAN after tamoxifen induction in control (B) and Lats1/2 CKO (C) mice. Hcn4 (green) was used to label pacemaker cells (PCs) in the SAN. pYap (red) is an indicator of Hippo signaling activity. Nuclei were labeled with DAPI (blue). Lower panels show higher-magnification views of the boxed areas in the upper panels. Scale bar, 25 μm and 5 μm. D-E. Representative images of immunofluorescence staining of aYap in the SAN after tamoxifen induction in control (D) and Lats1/2 CKO (E) mice. aYap was stained with red; Hcn4 (green) was used to label PCs in SAN. Nuclei were labeled with DAPI (blue). Lower panels show higher-magnification views of the boxed areas in the upper panels Scale bar, 25 μm and 5 μm. F-G. Representative electrocardiogram (ECG) recordings in control and Lats1/2 CKO mice. Star, irregular RR intervals (g); triangle, AV blocks (g’); arrows, abnormal P waves (g”). H-I. Representative Poincaré plots showing beat-to-beat RR interval variability from control (n=5) and Lats1/2 CKO (n=6) mice. Each color represents individual RR/RR+1 intervals from a different mouse. J-K. Heart rates and RR intervals of control and Lats1/2 CKO mice. Control, n=5; Lats1/2 CKO, n=6. Data are shown as means ± s.e.m. Statistical significance was determined by t-test, *p<0.05.
Figure 2.
Figure 2.. Lats1/2 deletion in CCS results in SAN fibrosis and fibroblast proliferation.
A-B. Masson’s Trichrome staining in control and Lats1/2 CKO SANs. Panels on the right show higher magnification of the boxed area from the panels on the left. Scale bar, 100 μm. C-E. Representative immunofluorescence confocal images from control (C) and Lats1/2 CKO (D) SANs after Hcn4-Cre activation showing collagens (Col1a1, red), PCs (Hcn4, green), and nuclei labeling (DAPI, blue). Panels on the right show higher magnification of the boxed area in panels on the left. Collagen 1 quantification (E), measured by pixel intensity. Data in (E) represent means ± s.e.m; statistical significance was determined by Mann–Whitney test. Scale bar, 25 μm and 5 μm. F-H. Representative images of EdU-labeled control (F) and Lats1/2 CKO (G) SANs. Samples were pulse-chased with EdU (white); fibroblasts and PCs were labeled with vimentin (red) and cTnT (green) respectively. Nuclei were stained with DAPI (blue). Arrows point to EdU-positive cells. Panels on the right show higher magnification of the boxed area in panels on the left. (H) Quantification of fibroblast proliferation. Representative image of proliferating fibroblast cells shown in F and G. Statistical significance was determined using the Mann–Whitney test (P<0.05). Scale bar, 25 μm and 5 μm. I-L. Quantitative real-time polymerase chain reaction validation of Collagen 1 (I), Periostin (Postn) (J), Vimentin (Vim) (K), and Acta2 (α-SMA) (L) in control and Lats1/2 CKO SANs. Each dot represents an independent biological replicate (n≥4). Data are shown as means ± s.e.m. Statistical significance was determined by Mann–Whitney test.
Figure 3.
Figure 3.. Lats1/2 deficiency disrupts the calcium homeostasis of pacemaker cells.
A-D. Ca2+ transient recordings obtained from control (A, C) and Lats1/2 CKO (B, D) PCs in the presence of caffeine (Caff). A-B. Representative confocal line-scan images. C-D Spatial average of fluorescence signal normalized to baseline (F/F0) over the entire field of observation of isolated PCs from control and Lats1/2 CKO. PCs from Lats1/2 mutant showed reduced and irregular frequency of spontaneous firing rate compared to controls. During caffeine challenge, Lats1/2 CKO PCs also had a weaker response and reduced activity of the caffeine-induced Ca2+ signal compared to controls. Caff, caffeine. E-F. Summary data for spontaneous firing rate. (E) Quantification of spontaneous Ca2+ transient rates in SAN cells of control and Lats1/2 CKO mice (n=12 cells/3 mice in control, n=18 cells/6 mice in Lats1/2 CKO, P=0.036 by Student t-test). (F) Distribution of spontaneous Ca2+ transient rates in isolated PCs from control and Lats1/2 CKO.
Figure 4.
Figure 4.. Yap/Taz deletion rescues arrhythmic phenotype in Lats1/2 mutants.
A-C. Representative images of immunofluorescent staining of pYap in SAN after tamoxifen induction in control (A), Lats1/2 CKO (B), and Lats1/2; Yap/Taz CKO (C) mice. Hcn4 (green) was used to label PCs in SAN. pYap (red) is an indicator of Hippo signaling activity. Nuclei were labeled with DAPI (blue). Panels on the right show higher magnification of the boxed area in the panels on the left. Stars, pYap staining. Scale bar, 25 μm and 5 μm. D-F. Representative ECG recordings in control (D), Lats1/2 CKO (E), and Lats1/2; Yap/Taz CKO (F) mice. Triangle, AV blocks (e); star, irregular RR intervals (e’); arrows, abnormal P waves (e”). G-I. Representative Poincaré plots, showing beat-to-beat RR interval variability, from control (n=8), Lats1/2 CKO (n=7) and Lats1/2; Yap/Taz CKO (n=5). Each color represents individual RR/RR+1 intervals from a different mouse. J-K. Heart rate and RR interval of control, Lats1/2 CKO, and Lats1/2; Yap/Taz CKO mice. Data are shown as means ± s.e.m. Statistical significance was determined by one-way ANOVA analysis. *p<0.05, **p<0.01, ***p<0.001.
Figure 5.
Figure 5.. Yap/Taz deletion in Lats1/2 CKO rescues SAN fibrosis and fibroblast proliferation.
A-C. Masson’s Trichrome staining in control (A), Lats1/2 CKO (B), and Lats1/2; Yap/Taz CKO (C) SANs. Lower panels show higher magnification of the boxed areas from the upper panels. Scale bar, 100 μm. D-F. Representative immunofluorescence confocal images of Collagen 1 (red) from control (D), Lats1/2 CKO (E), and Lats1/2; Yap/Taz CKO (F) SANs. Hcn4 are stained with green, and nuclei are stained with blue. The right-hand panels show higher magnification of the boxed areas in the left-hand panels. Scale bar, 25 μm and 5 μm. G-I. Representative images of EdU-labeled control (G), Lats1/2 CKO (H), and Lats1/2; Yap/Taz CKO (I) SANs. Samples were pulse-chased with EdU (white); fibroblasts and PCs were labeled with vimentin (red) and cTnT (green), respectively. Nuclei were stained with DAPI (blue). Right-hand panels show higher magnification of boxed areas in left-hand panels. Scale bar, 25 μm and 5 μm.
Figure 6.
Figure 6.. Analysis of CUT&Tag sequencing data.
A. Heatmap showing DNA binding peaks determined by CUT&Tag sequencing with Yap, IgG, and H3K4me3 in control and Lats1/2 CKO SANs. Quantification of CUT&Tag enrichment signal by ±1 kb to the center of Yap-associated regions. B. Distribution of Yap-associated regions. C. Motif analysis. The upper panel shows the percentage of identified binding sites containing the consensus binding motif(s). HOMER software was used to identify known motifs underneath Yap1 CUT&Tag peaks. The Tead4 consensus motif (the lower panel) was highly enriched and was represented as a sequence logo position weight matrix. D. Gene ontology (GO) analysis of direct targets of Yap. E-H. UCSC genome browser view of Yap CUT&Tag enriched peaks for the labeled genes. Larger peaks were seen in Lats1/2 CKO. Tead (TEA domain) motifs were also aligned.
Figure 7.
Figure 7.. Lats1/2 deficiency activated TGF-β signaling and inhibited Ryr2 expression in the SAN.
A-C. Representative RNAscope confocal images of Tgfb1 from control (A) and Lats1/2 CKO (B) SANs. Tgfb1 mRNA was stained red; the cell membrane was stained green (by using wheat germ agglutinin [WGA]), and nuclei were stained blue. Tgfb1 mRNA quantification (C), measured by pixel intensity. Data in (C) represent means ± s.e.m; statistical significance was determined using the Mann–Whitney test. Scale bar, 25 μm, 5 μm. D-E. Representative images of immunofluorescence staining of pSmad3 in SAN after tamoxifen induction in control (D) and Lats1/2 CKO (E) mice. Vimentin (green) was used to label fibroblasts in SAN. pSmad3 (red) is an indicator of TGF-β signaling activity. Nuclei were labeled with DAPI (blue). Right-hand panels show higher magnification of the boxed area in the left-hand panels. Arrows, pSmad3 staining in nuclei. Scale bar, 25 μm and 5 μm. F-G. Quantitative real-time PCR (qRT-PCR) data indicated that expression of Tgf-β1 (F) and Tgf-β3 (G) was greater in Lats1/2 CKO SAN than in control SAN. Each dot represents an independent biological replicate (n=4). Data are shown as means ± s.e.m; statistical significance was determined using the Mann–Whitney test. H-I. Representative images of immunofluorescence staining of Ryr2 in SAN after tamoxifen induction in control (H) and Lats1/2 CKO (I) mice. Ryr2 was stained with red; Hcn4 (green) was used to label PCs in SAN. Nuclei were labeled with DAPI (blue). Scale bar, 25 μm and 5 μm. J. Representative western blot images of Ryr2, pSmad3, and corresponding GAPDH loading control. K. qRT-PCR data indicated that expression of Ryr2 was decreased in Lats1/2 CKO compared with control SAN. Each dot represents an independent biological replicate (n=4). Data are shown as means ± s.e.m. Statistical significance was determined using the Mann–Whitney test, p< 0.05. L-N. Representative immunofluorescence confocal images of pSmad3 from SANs of control mice (L), Lats1/2 CKO mice (M), and Lats1/2 CKO mice treated with SB431542 (N). SB431542 is a selective inhibitor of TGF-β signaling. Vimentin (Vim) is stained in green, pSmad3 is stained in red, and nuclei are stained in blue. Arrows, pSmad3 staining in nuclei. Scale bar, 25 μm. O-R. Representative images of EdU-labeling of SANs of control mice (O), Lats1/2 CKO mice (P), and Lats1/2 CKO mice treated with SB431542 (Q). Samples were pulse-chased with EdU (white). Fibroblasts and PCs were labeled with vimentin (red) and cTnT (green), respectively. Nuclei were stained with DAPI (blue). (R) Quantification of fibroblast proliferation. Representative images of the experiment shown in Figure 7O–7Q. Statistical significance was determined by the Kruskal–Wallis test. Scale bar, 25 μm.
Figure 8.
Figure 8.. Schematic representation of the Hippo signaling–mediated mechanisms underlying the development of SND.
On one hand, the CCS-specific loss of Lats1/2 (‘Hippo kinases off’) can enhance the transcription of calcium-handling protein genes such as Ryr2 and cause the dysfunctional ‘Ca2+ clock’ in PCs, thereby impairing their pacemaking function. On the other hand, the upregulation of genes in the profibrotic pathway, such as Tgf-β, due to the CCS-specific loss of Lats1/2 can promote fibroblast proliferation and increase fibrosis within and near the SAN, which also impairs the propagation of electrical activation from the SAN to the atrial myocardium. Figure was created with Biorender (https://biorender.com/ ).

References

    1. Rubart M, Zipes DP. Mechanisms of sudden cardiac death. The Journal of clinical investigation. 2005;115:2305–2315 - PMC - PubMed
    1. Huikuri HV, Castellanos A, Myerburg RJ. Sudden death due to cardiac arrhythmias. The New England journal of medicine. 2001;345:1473–1482 - PubMed
    1. Mandla R, Jung C, Vedantham V. Transcriptional and epigenetic landscape of cardiac pacemaker cells: Insights into cellular specialization in the sinoatrial node. Frontiers in physiology. 2021;12:712666. - PMC - PubMed
    1. Christoffels VM, Smits GJ, Kispert A, Moorman AF. Development of the pacemaker tissues of the heart. Circulation research. 2010;106:240–254 - PubMed
    1. van Eif VWW, Devalla HD, Boink GJJ, Christoffels VM. Transcriptional regulation of the cardiac conduction system. Nature reviews. Cardiology. 2018;15:617–630 - PubMed

Publication types

MeSH terms

Substances