. 2023 Jan 3;147(1):66-82.
doi: 10.1161/CIRCULATIONAHA.122.061557. Epub 2022 Nov 1.

Noncanonical Form of ERAD Regulates Cardiac Hypertrophy

Affiliations

Noncanonical Form of ERAD Regulates Cardiac Hypertrophy

Erik A Blackwood et al. Circulation. .

Abstract

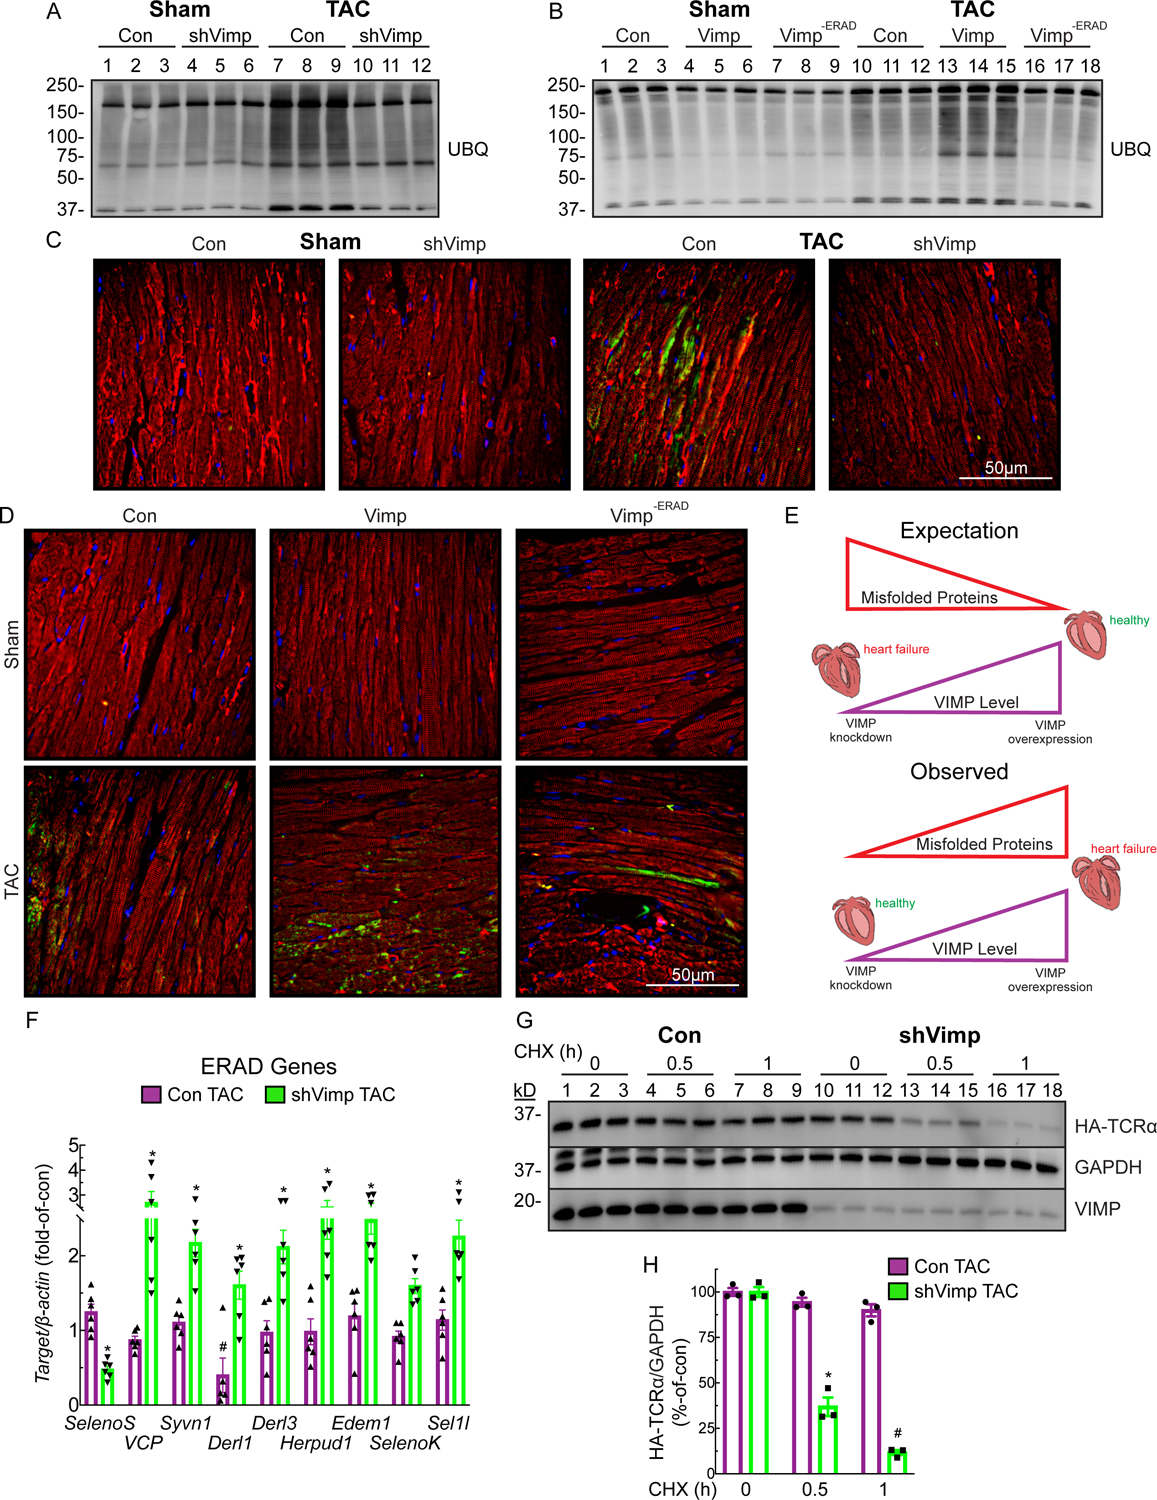
Background: Cardiac hypertrophy increases demands on protein folding, which causes an accumulation of misfolded proteins in the endoplasmic reticulum (ER). These misfolded proteins can be removed by the adaptive retrotranslocation, polyubiquitylation, and a proteasome-mediated degradation process, ER-associated degradation (ERAD), which, as a biological process and rate, has not been studied in vivo. To investigate a role for ERAD in a pathophysiological model, we examined the function of the functional initiator of ERAD, valosin-containing protein-interacting membrane protein (VIMP), positing that VIMP would be adaptive in pathological cardiac hypertrophy in mice.

Methods: We developed a new method involving cardiac myocyte-specific adeno-associated virus serovar 9-mediated expression of the canonical ERAD substrate, TCRα, to measure the rate of ERAD, ie, ERAD flux, in the heart in vivo. Adeno-associated virus serovar 9 was also used to either knock down or overexpress VIMP in the heart. Then mice were subjected to transverse aortic constriction to induce pressure overload-induced cardiac hypertrophy.

Results: ERAD flux was slowed in both human heart failure and mice after transverse aortic constriction. Surprisingly, although VIMP adaptively contributes to ERAD in model cell lines, in the heart, VIMP knockdown increased ERAD and ameliorated transverse aortic constriction-induced cardiac hypertrophy. Coordinately, VIMP overexpression exacerbated cardiac hypertrophy, which was dependent on VIMP engaging in ERAD. Mechanistically, we found that the cytosolic protein kinase SGK1 (serum/glucocorticoid regulated kinase 1) is a major driver of pathological cardiac hypertrophy in mice subjected to transverse aortic constriction, and that VIMP knockdown decreased the levels of SGK1, which subsequently decreased cardiac pathology. We went on to show that although it is not an ER protein, and resides outside of the ER, SGK1 is degraded by ERAD in a noncanonical process we call ERAD-Out. Despite never having been in the ER, SGK1 is recognized as an ERAD substrate by the ERAD component DERLIN1, and uniquely in cardiac myocytes, VIMP displaces DERLIN1 from initiating ERAD, which decreased SGK1 degradation and promoted cardiac hypertrophy.

Conclusions: ERAD-Out is a new preferentially favored noncanonical form of ERAD that mediates the degradation of SGK1 in cardiac myocytes, and in so doing is therefore an important determinant of how the heart responds to pathological stimuli, such as pressure overload.

Keywords: ER associated protein degradation; SGK1; VIMP; cardiac hypertrophy.


Figures

Figure 1.
Figure 1.
ERAD is impaired in both human and a murine model of heart failure (A) Schematic diagraming steps in canonical ERAD of misfolded proteins in the ER. (B and C) Western blots (WB) of LV extracts of human myocardial biopsy samples from failing and non-failing human hearts (B), or mouse hearts after sham or TAC (C) for expression of ubiquitylated proteins (UBQ), high molecular weight (HMW) amyloid oligomers, HRD1, or VIMP. (D and E) Analysis of myocardial protein aggregation in human (D) and mouse (E) heart failure. Bar graphs show mean ± SEM; n=6 human samples and n=5 mice per group. *p<0.01 as determined by unpaired t test. (G) Immunohistochemistry of mouse LV sections for protein aggregation (green), tropomyosin (red), and nuclei (DAPI, blue) of Sham or TAC-HF mice. (G and H) Quantitative real-time PCR (qPCR) for a panel of ERAD genes in human (G) and mouse (H) heart failure. Bar graphs show mean ± SEM; n=6 human samples and n=5 mice per group. *p<0.01 as determined by unpaired t test. (I) WB of HA-TCRa in adult mouse ventricular myocytes (AMVM) isolated from sham or TAC-HF mice. (J) Densitometry analysis of WB in panel I to determine degradation rate of HA-TCRa. Bar graph shows mean ± SEM; n=3 mice per group. *, **, # p<0.01 versus respective control and statistically independent group across all cross-compared data as determined by ANOVA with Tukey’s multiple comparisons test.
Figure 2.
Figure 2.
VIMP mediates pathological cardiac hypertrophy (A and I) Experimental schematic of cardiac function analysis by longitudinal echocardiography at different times after TAC. (B and J) WB for VIMP in mouse hearts 6 weeks after sham or TAC. (C and D) Representative still images from M-mode echocardiography (C) and mitral valve pulse-wave (PW) Doppler (D) in mouse hearts 6 weeks after sham or TAC. Green arrows mark early (E) and late (A) waves forms of LV filling rates. (E and K) Systolic function as measured by echocardiography to determine fractional shortening in mouse hearts 6 weeks after sham or TAC. (F and L) Diastolic function as determined by PW Doppler to analyze E and A waves. (G, H, M, N) Gravimetric measurement ratios of heart weight to tibia length, HW/TL (G and M), and wet lung weight to tibia length, LuW/TL (H and N). (E-H and K-N) Bar graph shows mean ± SEM; n=5–9 mice per group. * and # p<0.01 versus respective sham and statistically independent group across all cross-compared data as determined by ANOVA with Tukey’s multiple comparisons test.
Figure 3.
Figure 3.
VIMP exacerbates misfolded protein aggregation in the hypertrophic heart (A and B) WB for UBQ proteins in mouse hearts 6 weeks after sham or TAC. (C and D) Immunohistochemistry of LV sections for protein aggregation (green), tropomyosin (red), and nuclei (DAPI, blue) in mouse hearts 6 weeks after sham or TAC. (E) Schematic detailing the expected vs the observed findings linking increased Vimp levels to increased cardiac hypertrophy and accumulated misfolded proteins. (F) qPCR for a panel of ERAD genes in Con or shVimp mice 6 weeks after TAC relative to respective sham. Bar graphs show mean ± SEM; n=6 mice per group. *p<0.01 as determined by unpaired t test. (G) WB of HA-TCRa in AMVM isolated from Con or shVimp mice 6 weeks after TAC. (H) Densitometry analysis of WB in panel G to determine degradation rate of HA-TCRa. Bar graph shows mean ± SEM; n=3 mice per group. * and # p<0.01 versus respective control and statistically independent group across all cross-compared data as determined by ANOVA with Tukey’s multiple comparisons test.
Figure 4.
Figure 4.
VIMP selectively impedes degradation of the “ERAD-Out” substrate, SGK1, in cardiac myocytes (A and C) WB of ERAD-M substrate, HA-TCRa, that was infected via adenovirus in neonatal rat ventricular myocytes (NRVM) and transfected with siCon or siVimp (A), or infected with AdV-Con or AdV-Vimp (C) and treated with phenylephrine (PE) for 48 hours. (B and D) Densitometry analysis of WB in panel A (B) or panel C (D) to determine degradation rate of HA-TCRa. Bar graph shows mean ± SEM; n=3 NRVM cultures repeated from at least two independent NRVM isolations per group. *, **, ***, # p<0.01 versus respective control and statistically independent group across all cross-compared data as determined by ANOVA with Tukey’s multiple comparisons test. (E and F) qPCR for prohypertrophic markers Nppa and Nppb in NRVM transfected with siCon or siVimp (A), or infected with AdV-Con or AdV-Vimp (C) and treated with PE for 48 hours. Bar graph shows mean ± SEM; n=3 NRVM cultures repeated from at least two independent NRVM isolations per group. * and # p<0.01 versus respective vehicle and statistically independent group across all cross-compared data as determined by ANOVA with Tukey’s multiple comparisons test. (G and I) WB of “ERAD-Out” substrate, FLAG-SGK1, that was infected via adenovirus in NRVM and transfected with siCon or siVimp (G), or infected with AdV-Con or AdV-Vimp (I) and treated with PE for 48 hours. (H and J) Densitometry analysis of WB in panel G (H) or panel I (J) to determine degradation rate of FLAG-SGK1. Bar graph shows mean ± SEM; n=3 NRVM cultures repeated from at least two independent NRVM isolations per group. *, **, ***, # p<0.01 versus respective control and statistically independent group across all cross-compared data as determined by ANOVA with Tukey’s multiple comparisons test. (K) Schematic detailing the proposed mechanism whereby increased VIMP levels are discordant with canonical ERAD substrate, TCRa, but increase the level of the “ERAD-Out” substrate, SGK1, which correlates with increased cardiac hypertrophy.
Figure 5.
Figure 5.
SGK1 is elevated in heart failure and VIMP knockdown enhances its degradation in an ERAD-dependent manner (A) Schematic detailing the hypothesis that when SGK1 is not degraded at the ER, it leads to pathologic cardiac hypertrophy. (B and C) WB of LV extracts of healthy or heart failure human myocardial biopsy samples (B) or mouse hearts after sham or TAC (C) for SGK1 and its (or SGK1) phosphorylation targets. (D and E) WB of FLAG-SGK1 in AMVM isolated from sham or TAC mice (D), or AAV9-Con or AAV9-shVimp mice 6 weeks after TAC. n=3 mice per group. (F) WB of NRVM treated with siControl or siVimp, infected without or with AdV-FLAG-SGK1. Cell extracts were subjected to FLAG immunoprecipitation (IP) followed by SDS-PAGE and UBQ, HRD1, or FLAG WB. Note that HRD1 was also detected as a higher molecular weight complex with FLAG-SGK1 after FLAG IP (arrow). (G) Densitometry quantifications of WB in panel F to analyze the UBQ or HRD1 interaction with SGK1 after FLAG IP. (H) WB of NRVM treated with siControl or siVimp, infected without or with AdV-FLAG-SGK1, and treated with bortezomib (BZ) for 4 hours. Cell extracts were subjected to FLAG IP followed by SDS-PAGE and UBQ, HRD1, or FLAG WB. (I and J) Densitometry quantifications of WB in panel H to analyze the UBQ (I) or HRD1 (J) interaction with SGK1 after FLAG IP.
Figure 6.
Figure 6.
VIMP displaces DERLIN1 from recruiting VCP to allow for “ERAD-Out” substrate degradation (A and B) WB of FLAG-SGK1 (A) or HA-TCRa (B) in NRVM transfected with siCon, siVimp, or both siVimp and siDerlin1 and treated with PE for 48 hours. (C) qPCR for pro-hypertrophic markers Nppa and Nppb in NRVM transfected with siCon, siVimp, or both siVimp and siDerlin1 and treated with PE for 48 hours. Bar graph shows mean ± SEM; n=3 NRVM cultures repeated from at least two independent NRVM isolations per group. *p<0.01 as determined by ANOVA with Tukey’s multiple comparisons test. (D) WB of NRVM treated with siCon, siVimp, or both siVimp and siDerlin1 and infected without or with AdV-FLAG-SGK1. Cell extracts were subjected to FLAG IP followed by SDS-PAGE and UBQ, HRD1, or FLAG WB. (E) Densitometry quantifications of WB in panel D to analyze the UBQ or HRD1 interaction with SGK1 after FLAG IP. (F) WB of Cos7 cells transfected with HA-VCP and either low-dose (LD; 6ng) or high-dose (HD; 100ng) of FLAG-Vimp plasmid. Cell extracts were subjected to HA IP followed by SDS-PAGE and DERLIN1, HA, or VIMP WB. (G) Densitometry quantifications of WB in panel F to analyze the Derlin1 interaction with VCP after HA IP. (H) Schematic detailing VCP mutants (mut) with serial truncations in its reported co-factor binding N domain. (I and J) WB of Cos7 cells transfected with HA-VCP truncations and either FLAG-Vimp (I) or Flag-Derlin1 (J). Cell extracts were subjected to FLAG IP followed by SDS-PAGE and HA, VIMP, or DERLIN1 WB. (K) Densitometry quantifications of WB in panels I and J to analyze the interaction between VIMP or DERLIN1 with serial VCP truncation mutants.

References

    1. Frey N, Katus HA, Olson EN, Hill JA. Hypertrophy of the heart: a new therapeutic target? Circulation. 2004. Apr 6;109(13):1580–9. - PubMed
    1. Arrieta A, Blackwood EA, Glembotski CC. ER Protein Quality Control and the Unfolded Protein Response in the Heart. Curr Top Microbiol Immunol. 2018;414:193–213. - PMC - PubMed
    1. Blackwood EA, Bilal AS, Stauffer WT, Arrieta A, Glembotski CC. Designing Novel Therapies to Mend Broken Hearts: ATF6 and Cardiac Proteostasis. Cells. 2020. Mar 3;9(3):602. - PMC - PubMed
    1. Walter P, Ron D. The unfolded protein response: from stress pathway to homeostatic regulation. Science. 2011. Nov 25;334(6059):1081–6. - PubMed
    1. Brodsky JL. Cleaning up: ER-associated degradation to the rescue. Cell. 2012. Dec 7;151(6):1163–7. - PMC - PubMed

Publication types

MeSH terms