. 2023 Jan;38(1):113-122.
doi: 10.1002/mds.29251. Epub 2022 Nov 1.

Longitudinal Clinical and Biological Characteristics in Juvenile-Onset Huntington's Disease

Affiliations

Longitudinal Clinical and Biological Characteristics in Juvenile-Onset Huntington's Disease

Jordan L Schultz et al. Mov Disord. 2023 Jan.

Abstract

Background: Juvenile-onset Huntington's disease (JOHD) is a rare form of Huntington's disease (HD) characterized by symptom onset before the age of 21 years. Observational data in this cohort is lacking.

Objectives: Quantify measures of disease progression for use in clinical trials of patients with JOHD.

Methods: Participants who received a motor diagnosis of HD before the age of 21 were included in the Kids-JOHD study. The comparator group consisted of children and young adults who were at-risk for inheriting the genetic mutation that causes HD, but who were found to have a CAG repeat in the non-expanded range (gene non-expanded [GNE]).

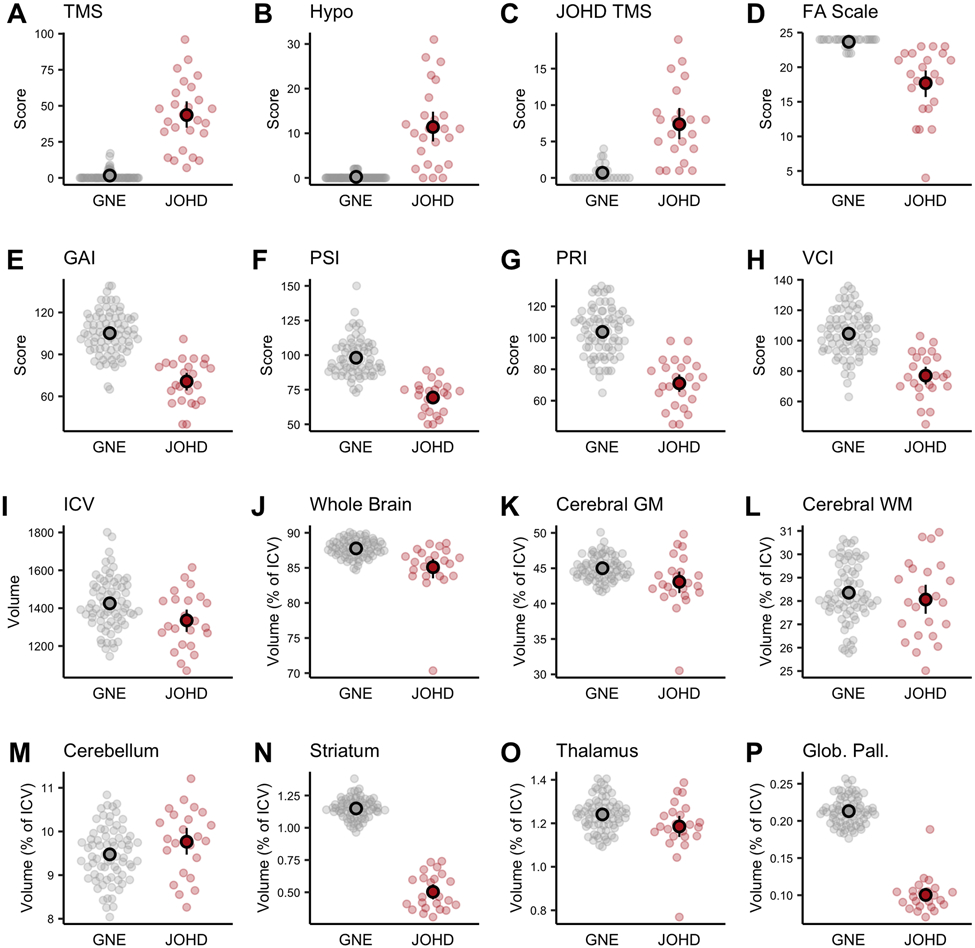
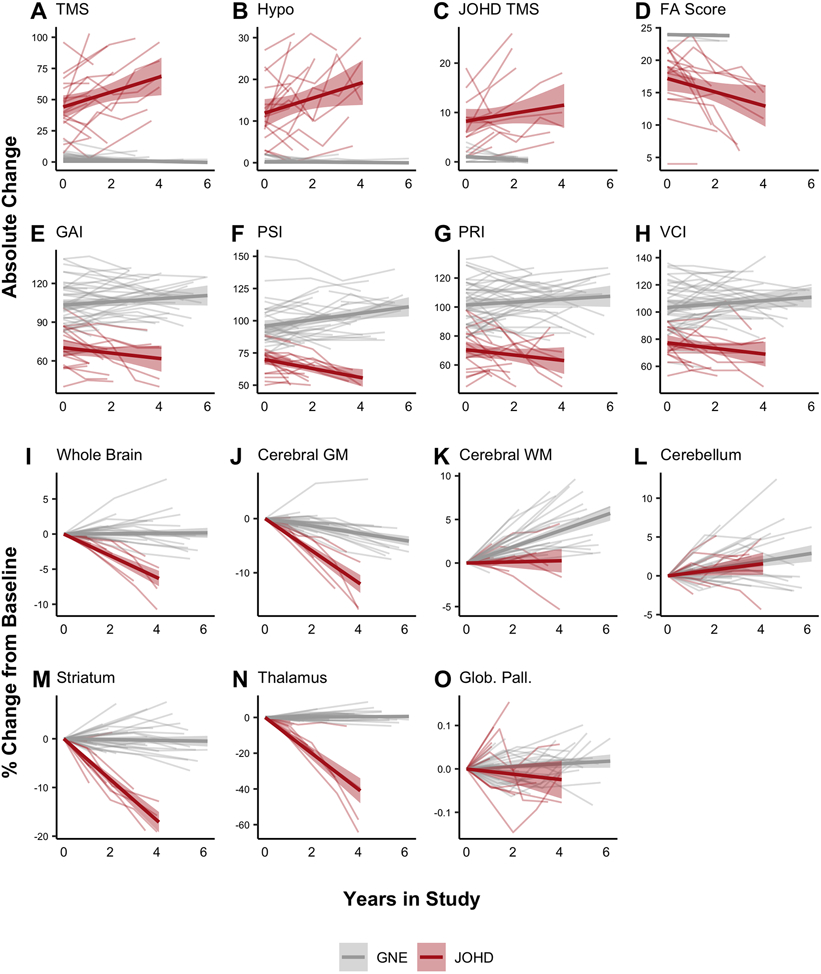
Results: Data were obtained between March 17, 2006, and February 13, 2020. There were 26 JOHD participants and 78 GNE participants who were comparable on age (16.03 vs. 14.43, respectively) and sex (53.8% female vs. 57.7% female, respectively). The mean annualized decrease in striatal volume in the JOHD group was -3.99% compared to -0.06% in the GNE (mean difference [MD], -3.93%; 95% confidence intervals [CI], [-4.98 to -2.80], FDR < 0.0001). The mean increase in the Unified Huntington's Disease Rating Scale Total Motor Score per year in the JOHD group was 7.29 points compared to a mean decrease of -0.21 point in the GNE (MD, 7.5; 95% CI, [5.71-9.28], FDR < 0·0001).

Conclusions: These findings demonstrate that structural brain imaging and clinical measures in JOHD may be potential biomarkers of disease progression for use in clinical trials. Collaborative efforts are required to validate these results in a larger cohort of patients with JOHD. © 2022 International Parkinson and Movement Disorder Society.

Keywords: juvenile-onset Huntington disease; longitudinal; neuroimaging; prospective.


Conflict of interest statement

Author Disclosures

The authors report no potential conflicts of interest related to this work.

Figures

Figure 1
Figure 1. Baseline Differences in Clinical and Neuroimaging Measures Between Groups
The gray and red circles represent the raw data points for the GNE and JOHD groups, respectively. The black circles represent the group means and the black lines represent the 95% confidence intervals of the mean. Panels A-C represent the motor assessments of A) TMS, B) Hypokinesia Score, and C) JHD-TMS score. Panel D shows the Functional Assessment Scale between groups. Panels E-H represent the cognitive measures from the Wechsler Scale. For panels A-H, data were available for 26 participants with JOHD and 78 participants in the GNE group. Panels I-P show baseline brain volumes between groups. For the baseline neuroimaging results, there were data available for 23 participants in the JOHD group and 72 participants in the GNE group. FA: Functional Assessment; GAI: General Ability Index; Glob. Pall.: Globus Pallidus; GM: Gray Matter; GNE: Gene-Non-Expanded.; Hypo: Hypokinesia Score; ICV: Intracranial Volume; JHD TMS: Juvenile HD Motor Scale; JOHD: Juvenile-Onset Huntington Disease; PRI: Perceptual Reasoning Index; PSI: Processing Speed Index; TMS: Total Motor Score; VCI: Verbal Comprehension Index; WM: White Matter
Figure 2
Figure 2. Longitudinal Changes in Clinical and Neuroimaging Measures Between Groups
Longitudinal clinical data was available for 18 patients with JOHD and 42 participants in the GNE group. Patients with JOHD had a faster rate of worsening in regards to motor (A-C), functional (D), and cognitive (E-H) outcomes compared to the GNE group. Longitudinal neuroimaging data were available for 11 patients with JOHD and 35 participants in the GNE group. Patients with JOHD had faster annualized percent decreases in the volume of the whole brain (I), and cerebral GM (J) compared to the GNE group. The JOHD participants seemed to have slower developmental increases in cerebral WM (K) compared to the GNE group. The trajectory of change in the percent volume change of the cerebellum did not differ between groups (L). The JOHD group experienced longitudinal atrophy in the striatum (M) and thalamus (N) compared to the GNE group. The annualized percent change over time in volume of the globus pallidus (O) did not differ between groups. The thin gray and red lines are the raw, connected data points for each individual participant. The bold gray and red lines represent the predicted fit of the raw values from a linear model and the accompanying shaded areas represent the predicted 95% confidence interval. FA: Functional Assessment; GAI: General Ability Index; Glob. Pall.: Globus Pallidus; GM: Gray Matter; GNE: Gene-Non-Expanded; Hypo: Hypokinesia Score; ICV: Intracranial Volume JHD TMS: Juvenile HD Motor Scale; JOHD: Juvenile-Onset Huntington Disease; PRI: Perceptual Reasoning Index; PSI: Processing Speed Index; TMS: Total Motor Score; VCI: Verbal Comprehension Index; WM: White Matter
Figure 3
Figure 3. Structure-Function Relationships Between Clinical Measure and Brain Volumes
A) This grid helps to visualize the relationships between brain measures (vertical axis) and clinical measures (horizontal axis). Red indicates a positive relationship and blue is indicative of a negative relationship. The values in each box are the associated FDR-corrected p-values (q) from the models. B) Figures 3B-D are presented to show selected individualized associations with raw values. The solid black lines represent the predicted fit of the raw values from a linear model. The gray area represents the predicted 95% confidence interval of a linear model. FA: Functional Assessment; GAI: General Ability Index; ICV: Intracranial Volume; JOHD TMS: Juvenile HD Motor Scale; PRI: Perceptual Reasoning Index; PSI: Processing Speed Index; VCI: Verbal Comprehension Index

References

    1. A novel gene containing a trinucleotide repeat that is expanded and unstable on Huntington's disease chromosomes. The Huntington's Disease Collaborative Research Group. Cell 1993;72(6):971–983. - PubMed
    1. Langbehn DR, Brinkman RR, Falush D, Paulsen JS, Hayden MR, International Huntington's Disease Collaborative G. A new model for prediction of the age of onset and penetrance for Huntington's disease based on CAG length. Clin Genet 2004;65(4):267–277. - PubMed
    1. Nopoulos PC. Huntington disease: a single-gene degenerative disorder of the striatum. Dialogues Clin Neurosci 2016;18(1):91–98. - PMC - PubMed
    1. Douglas I, Evans S, Rawlins MD, Smeeth L, Tabrizi SJ, Wexler NS. Juvenile Huntington's disease: a population-based study using the General Practice Research Database. BMJ Open 2013;3(4). - PMC - PubMed
    1. Cronin T, Rosser A, Massey T. Clinical Presentation and Features of Juvenile-Onset Huntington's Disease: A Systematic Review. J Huntingtons Dis 2019;8(2):171–179. - PubMed

Publication types