. 2022 Nov 10;185(23):4376-4393.e18.
doi: 10.1016/j.cell.2022.09.036. Epub 2022 Oct 31.

Multiphase coalescence mediates Hippo pathway activation

Affiliations

Multiphase coalescence mediates Hippo pathway activation

Li Wang et al. Cell. .

Abstract

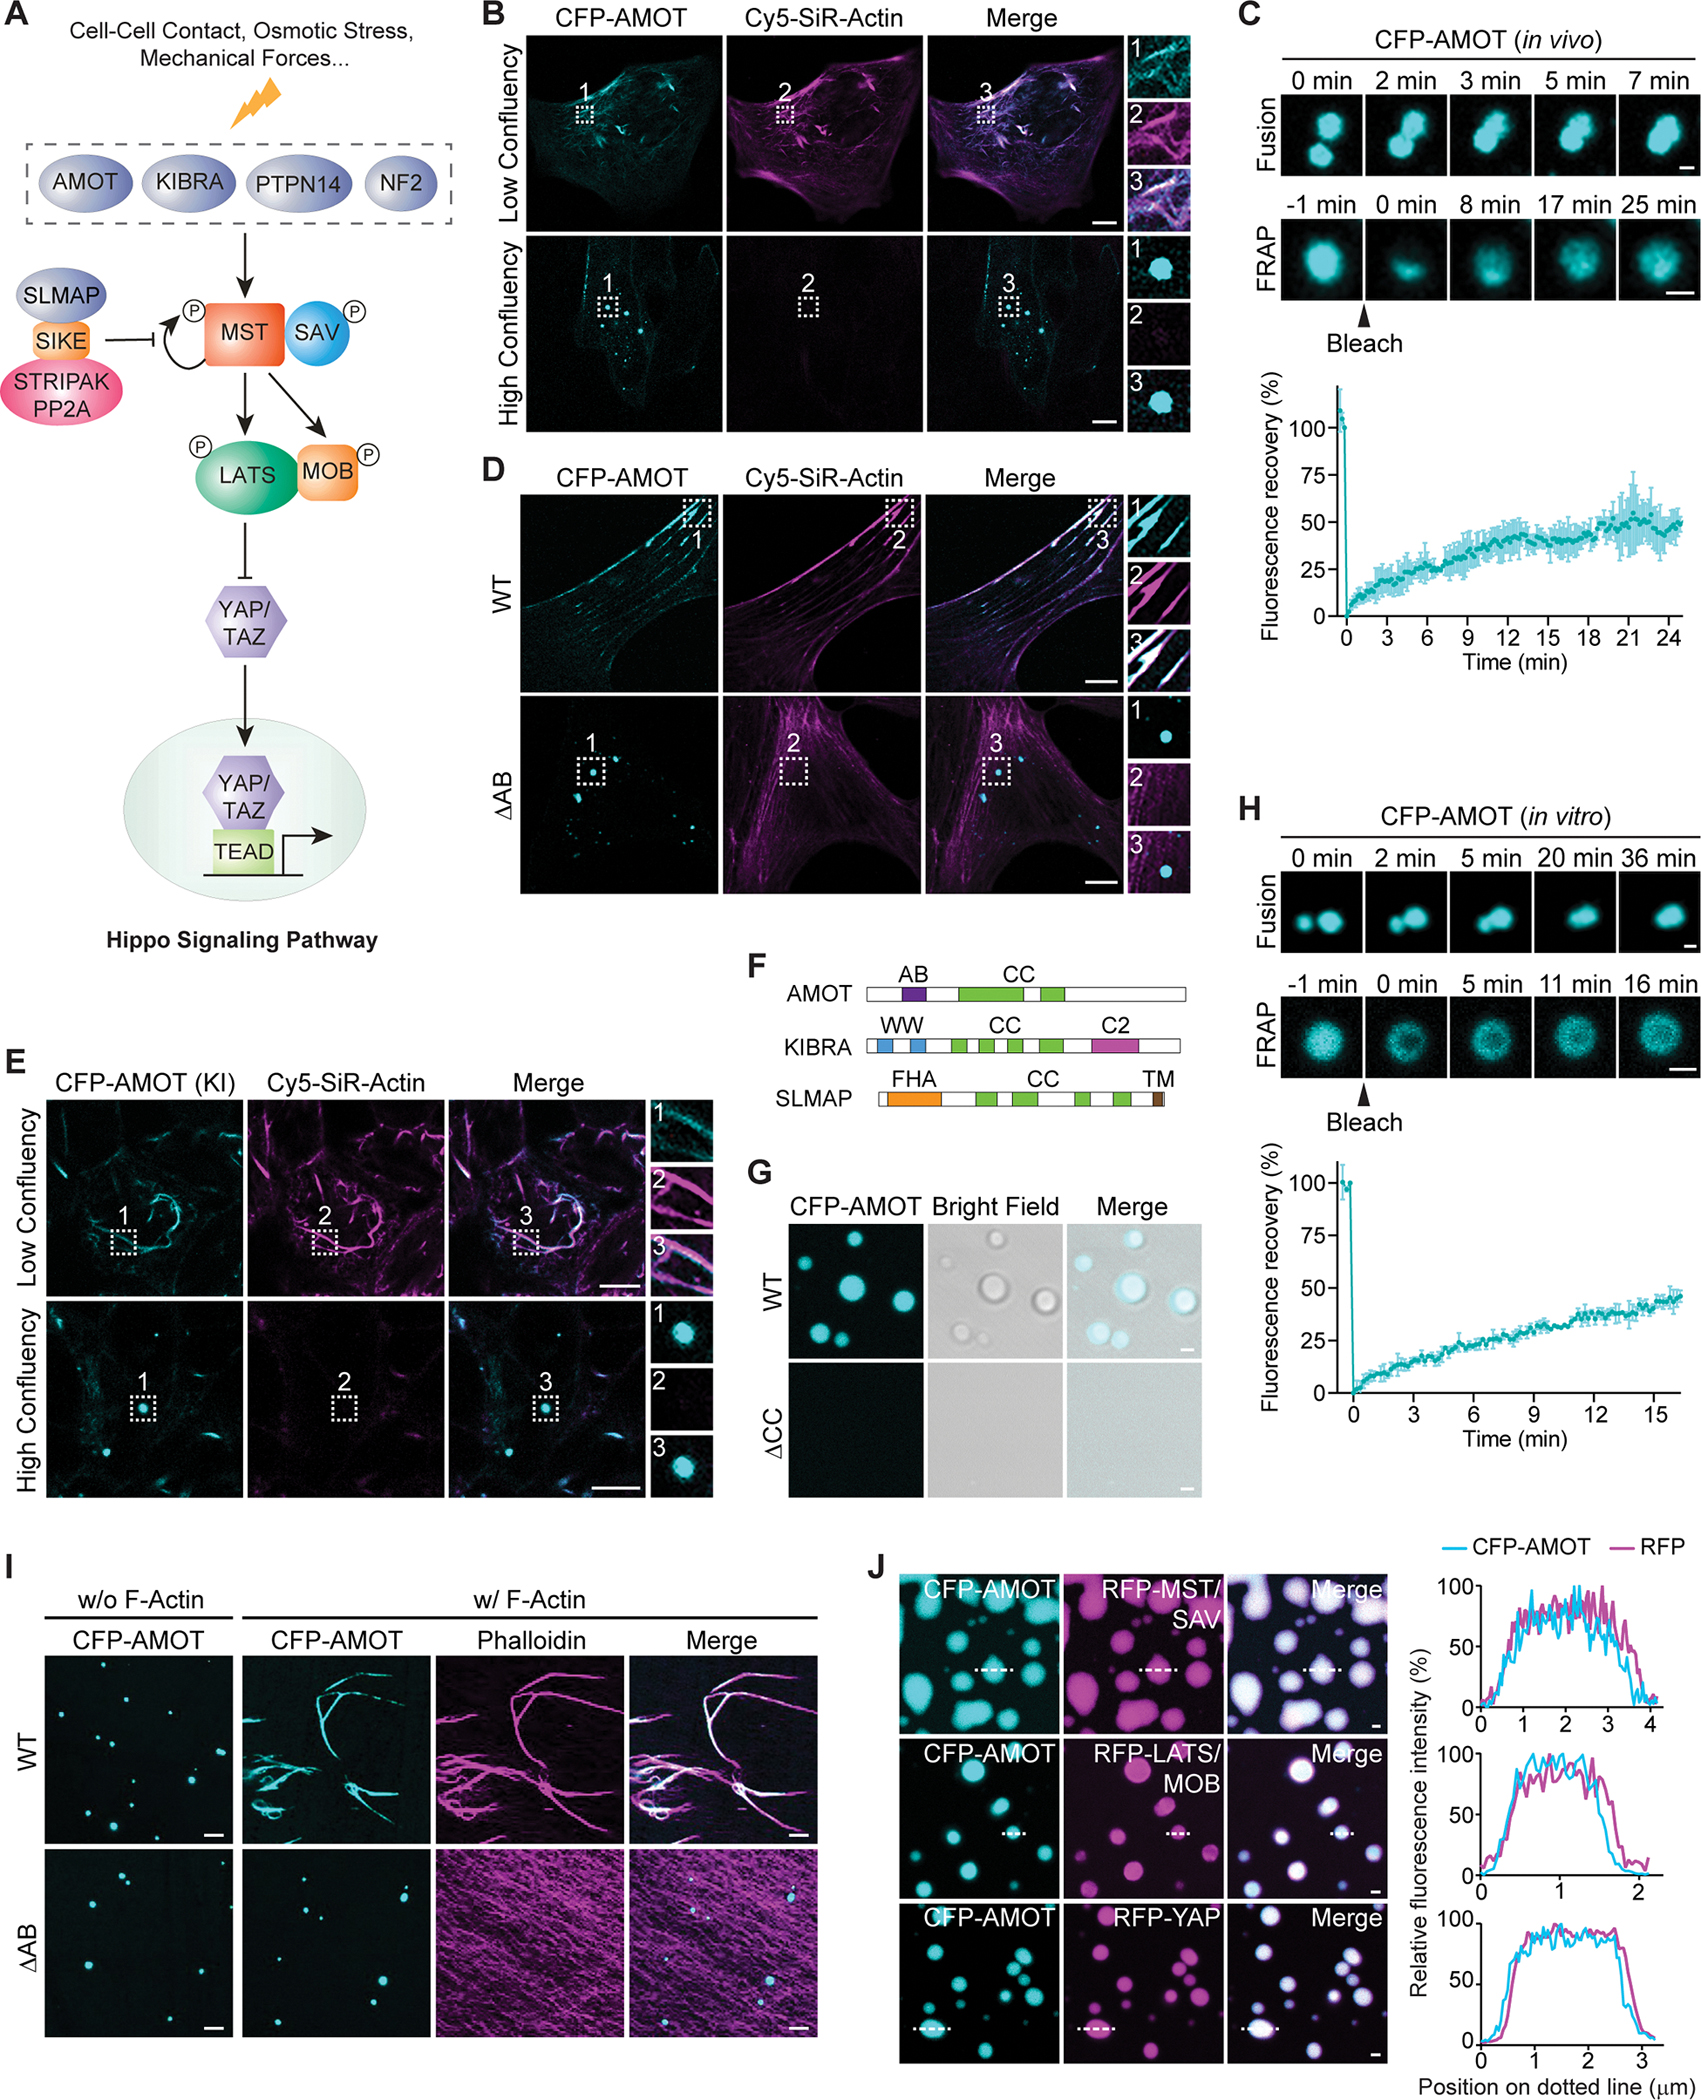
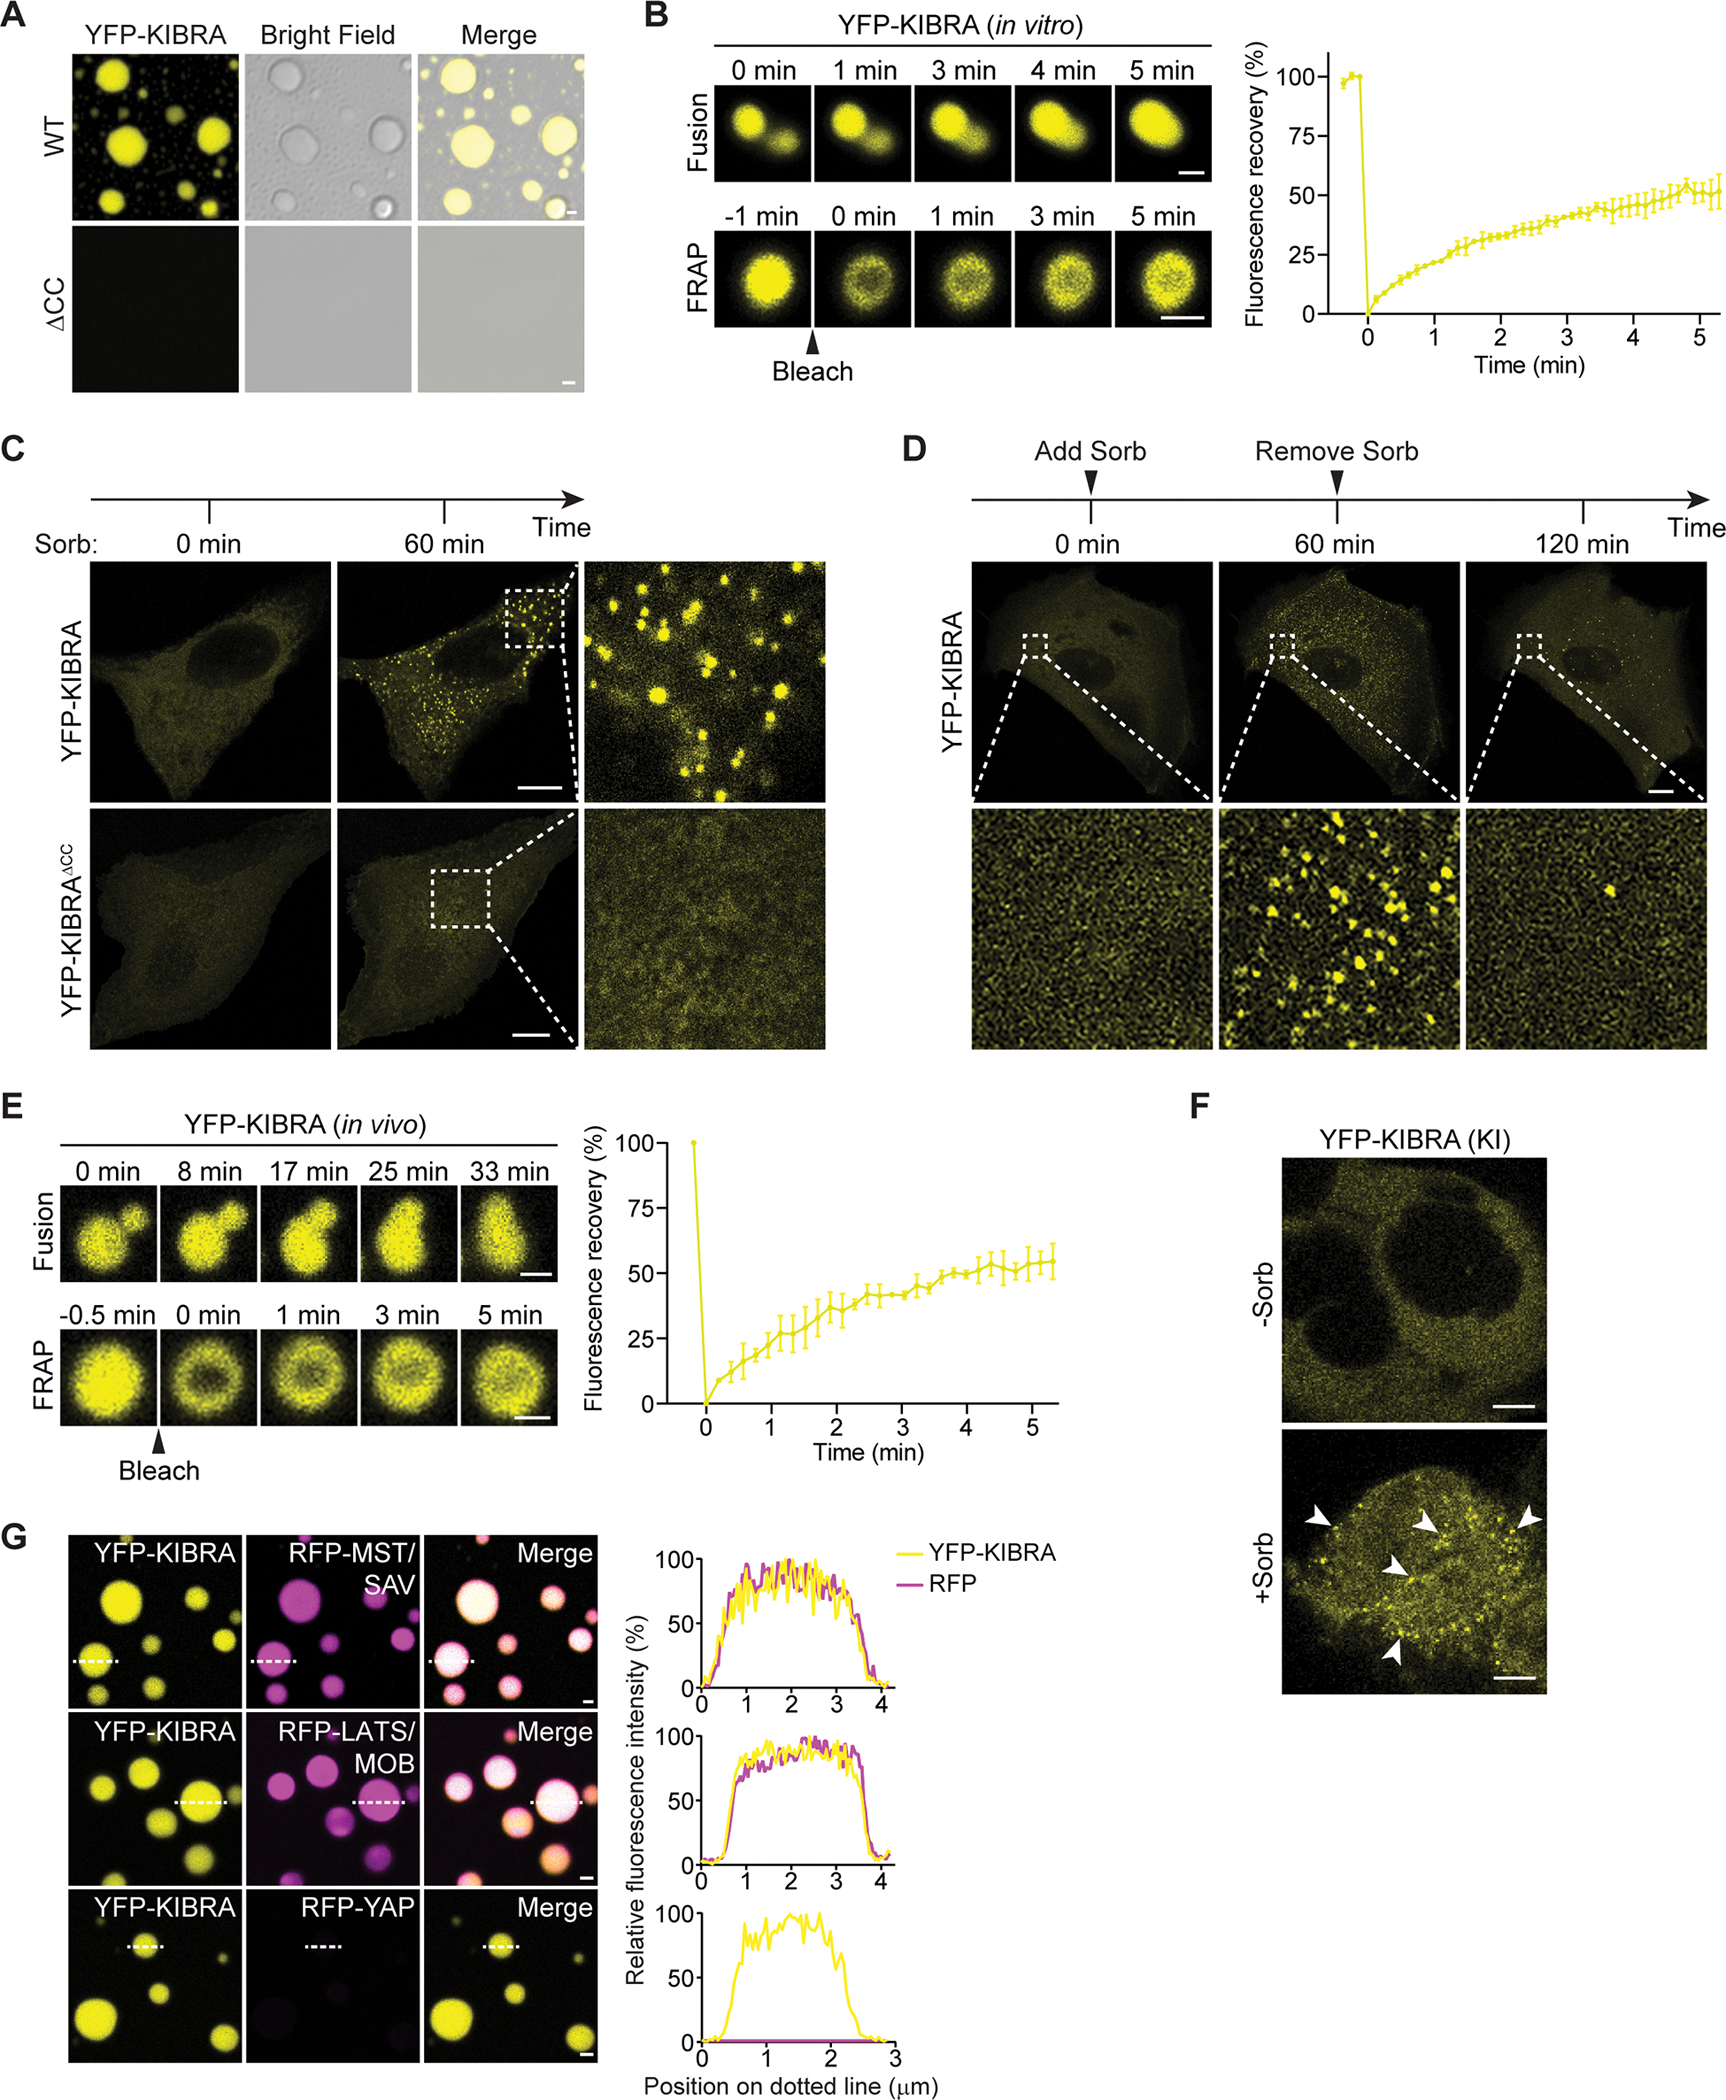
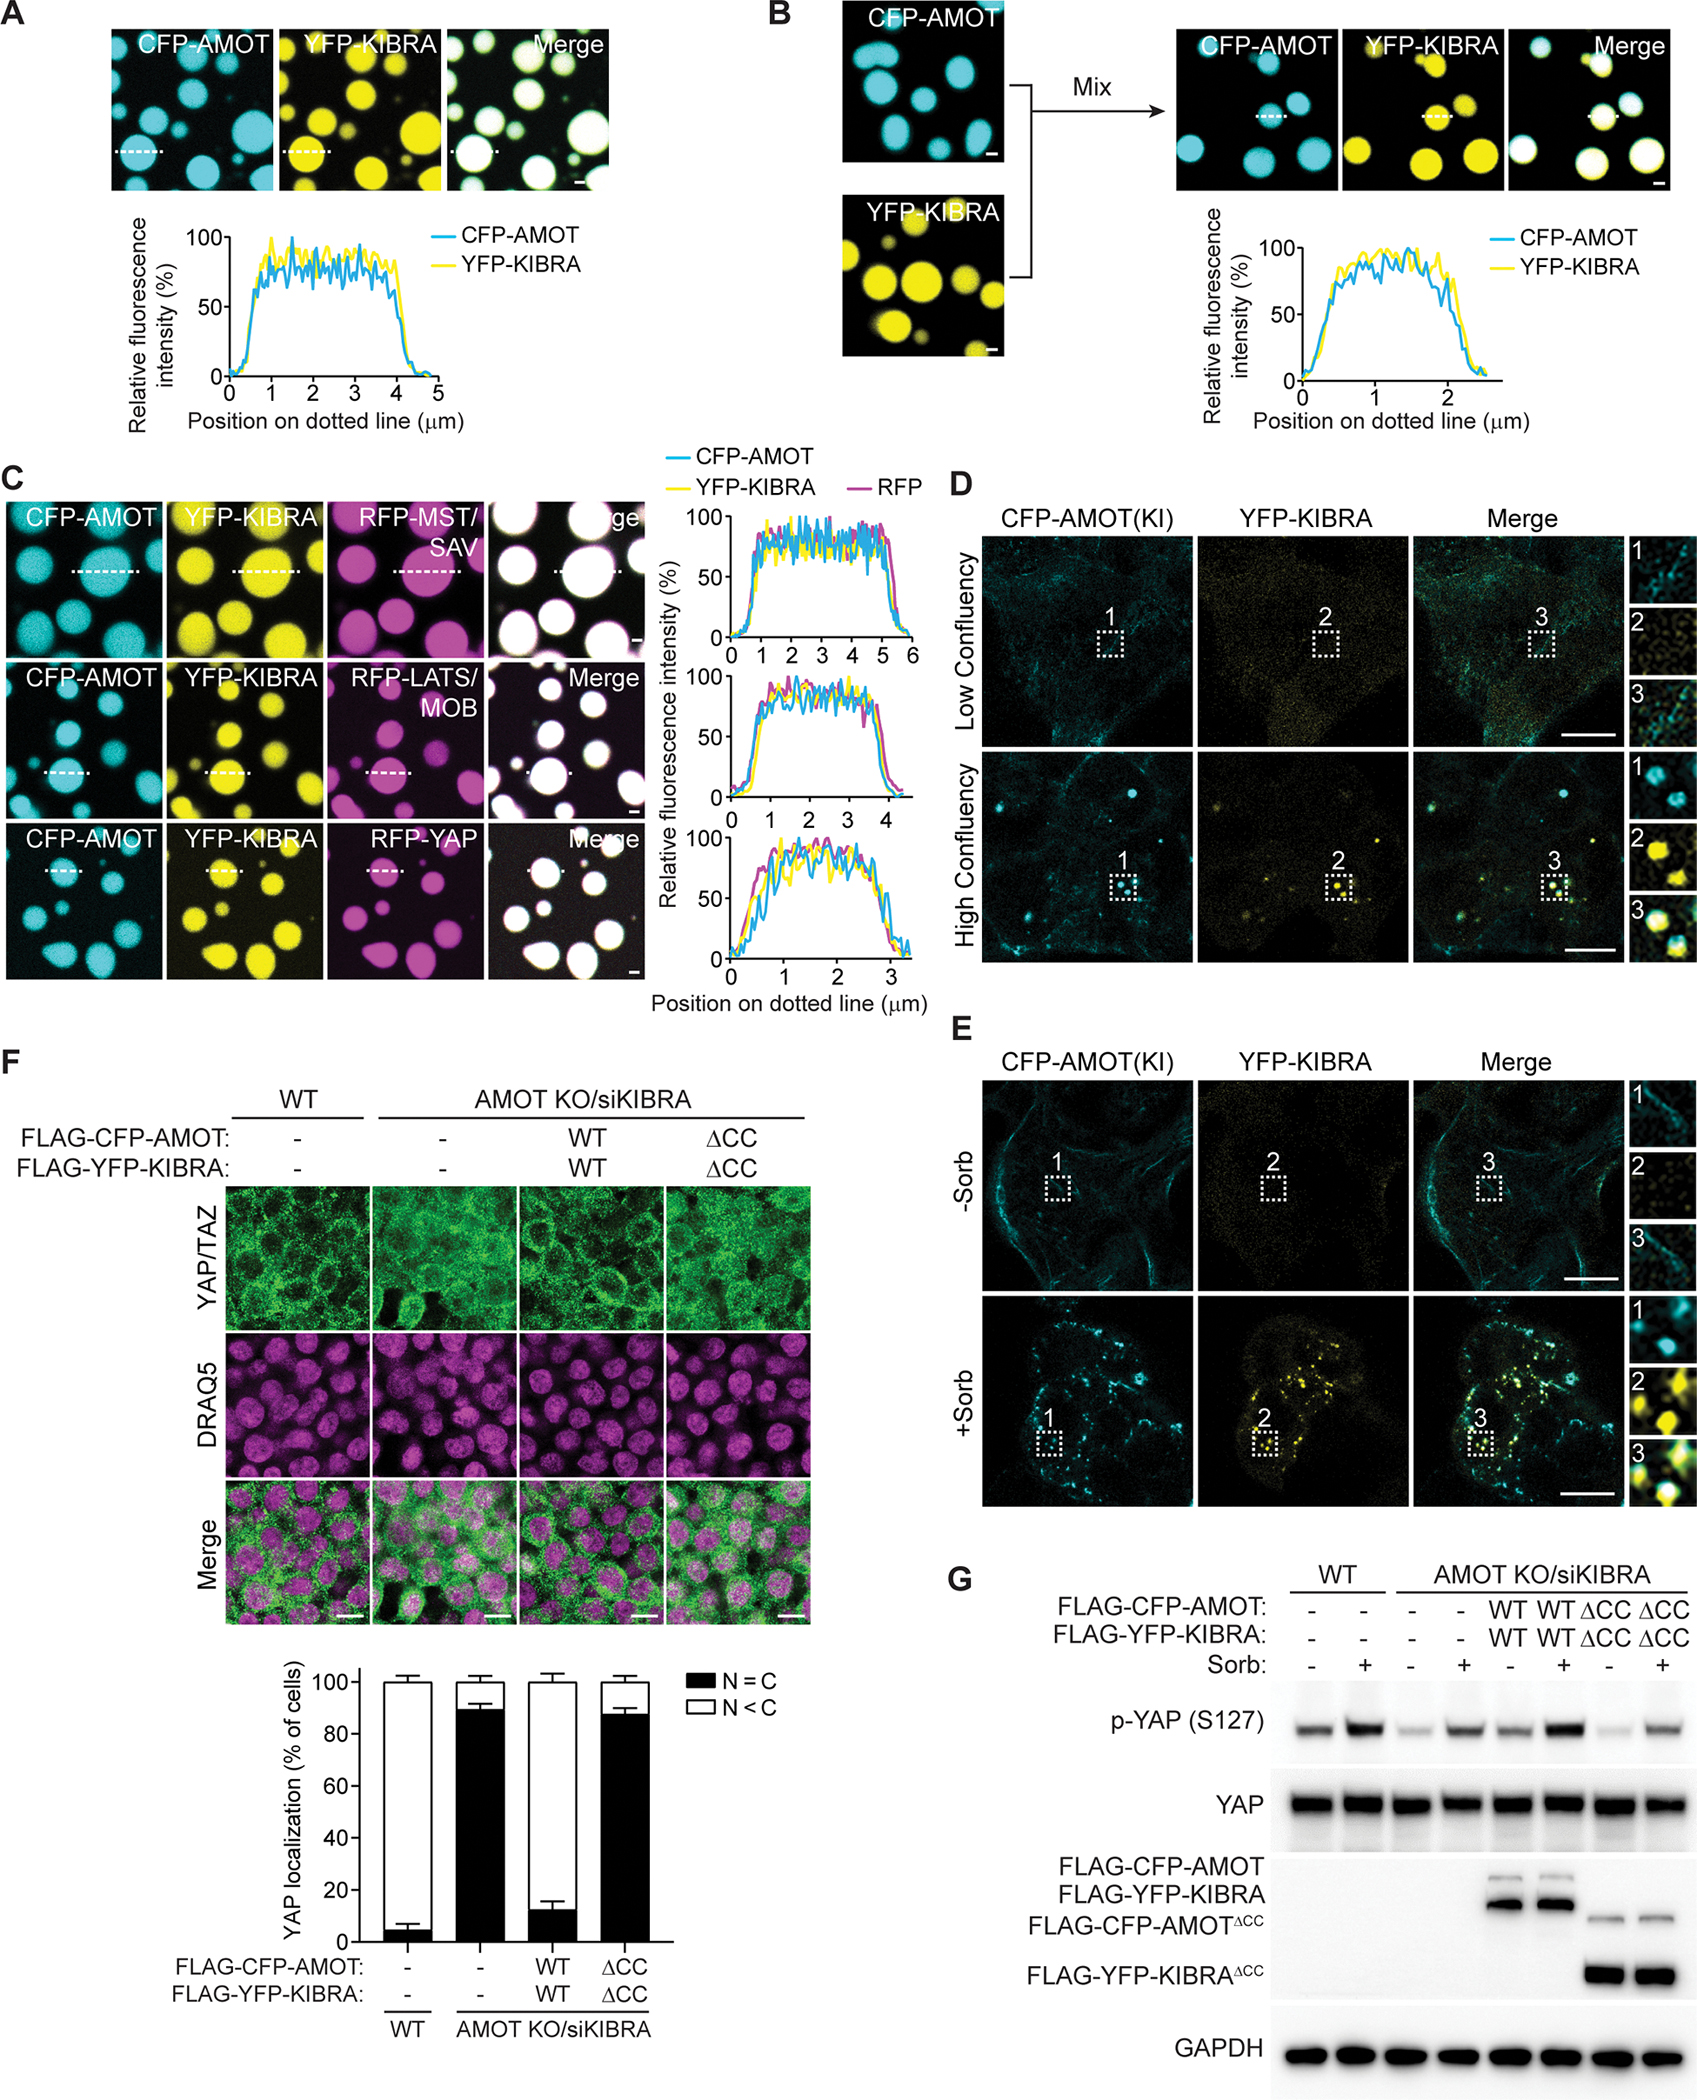
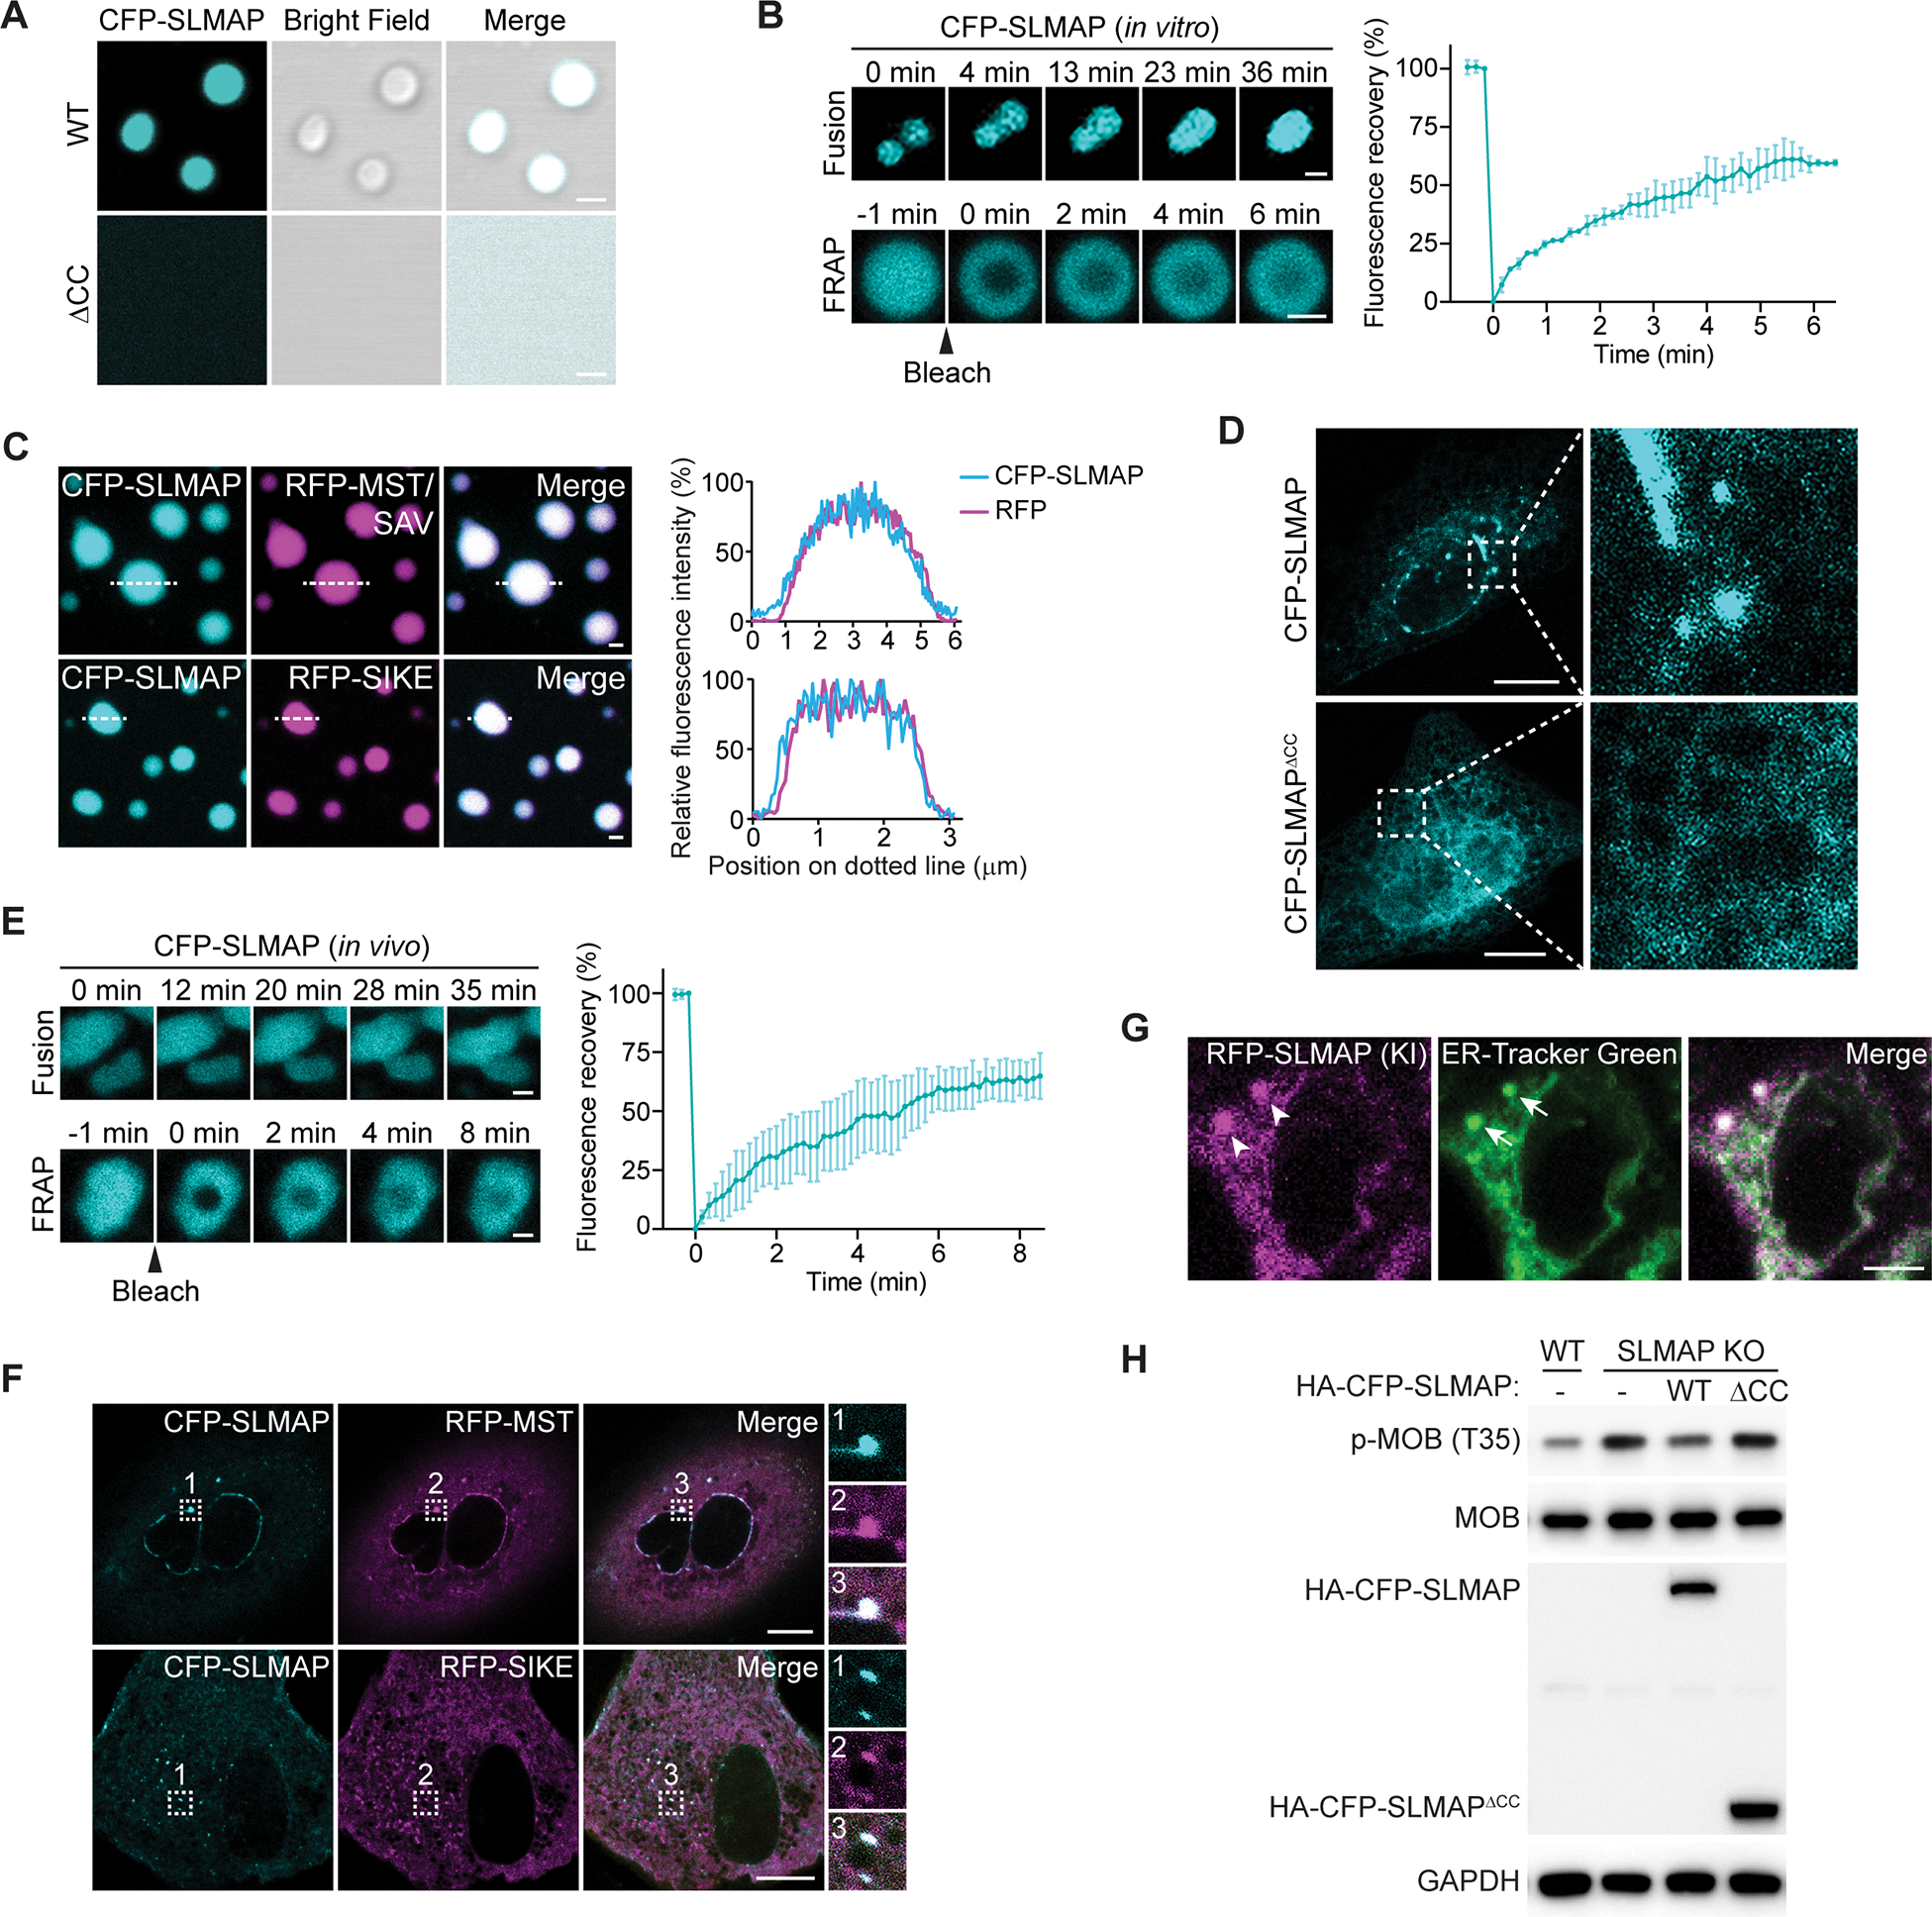
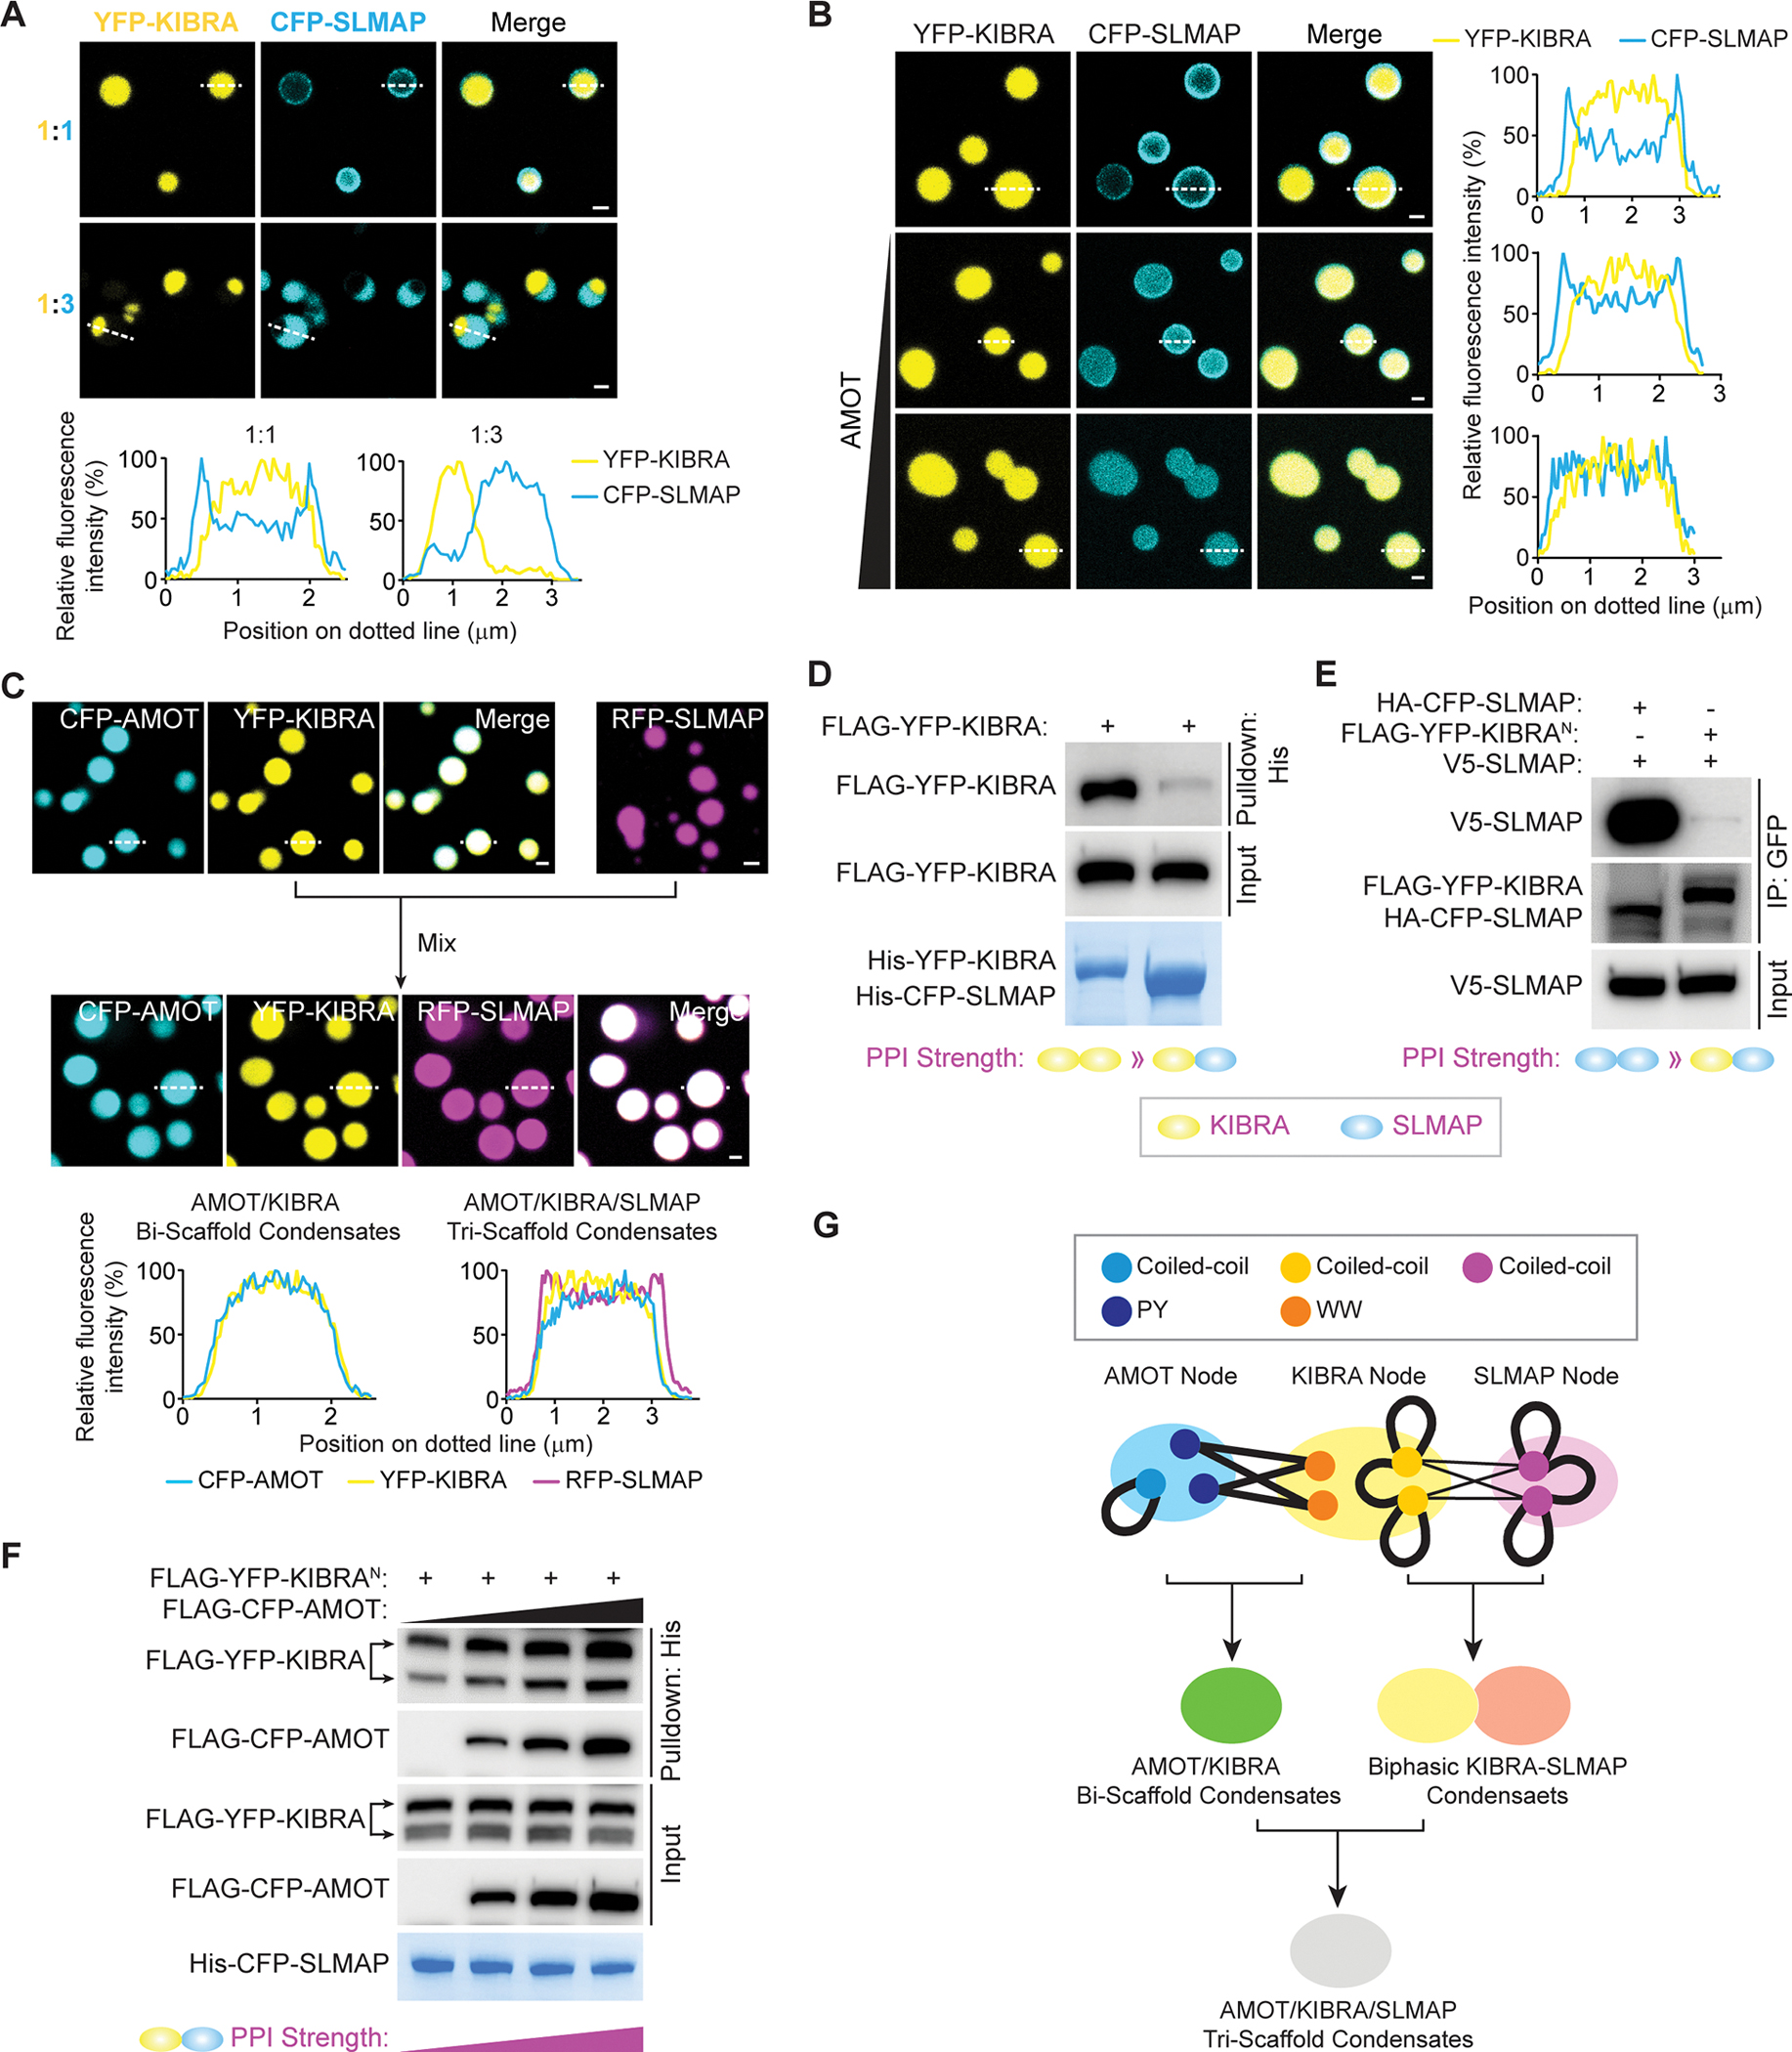
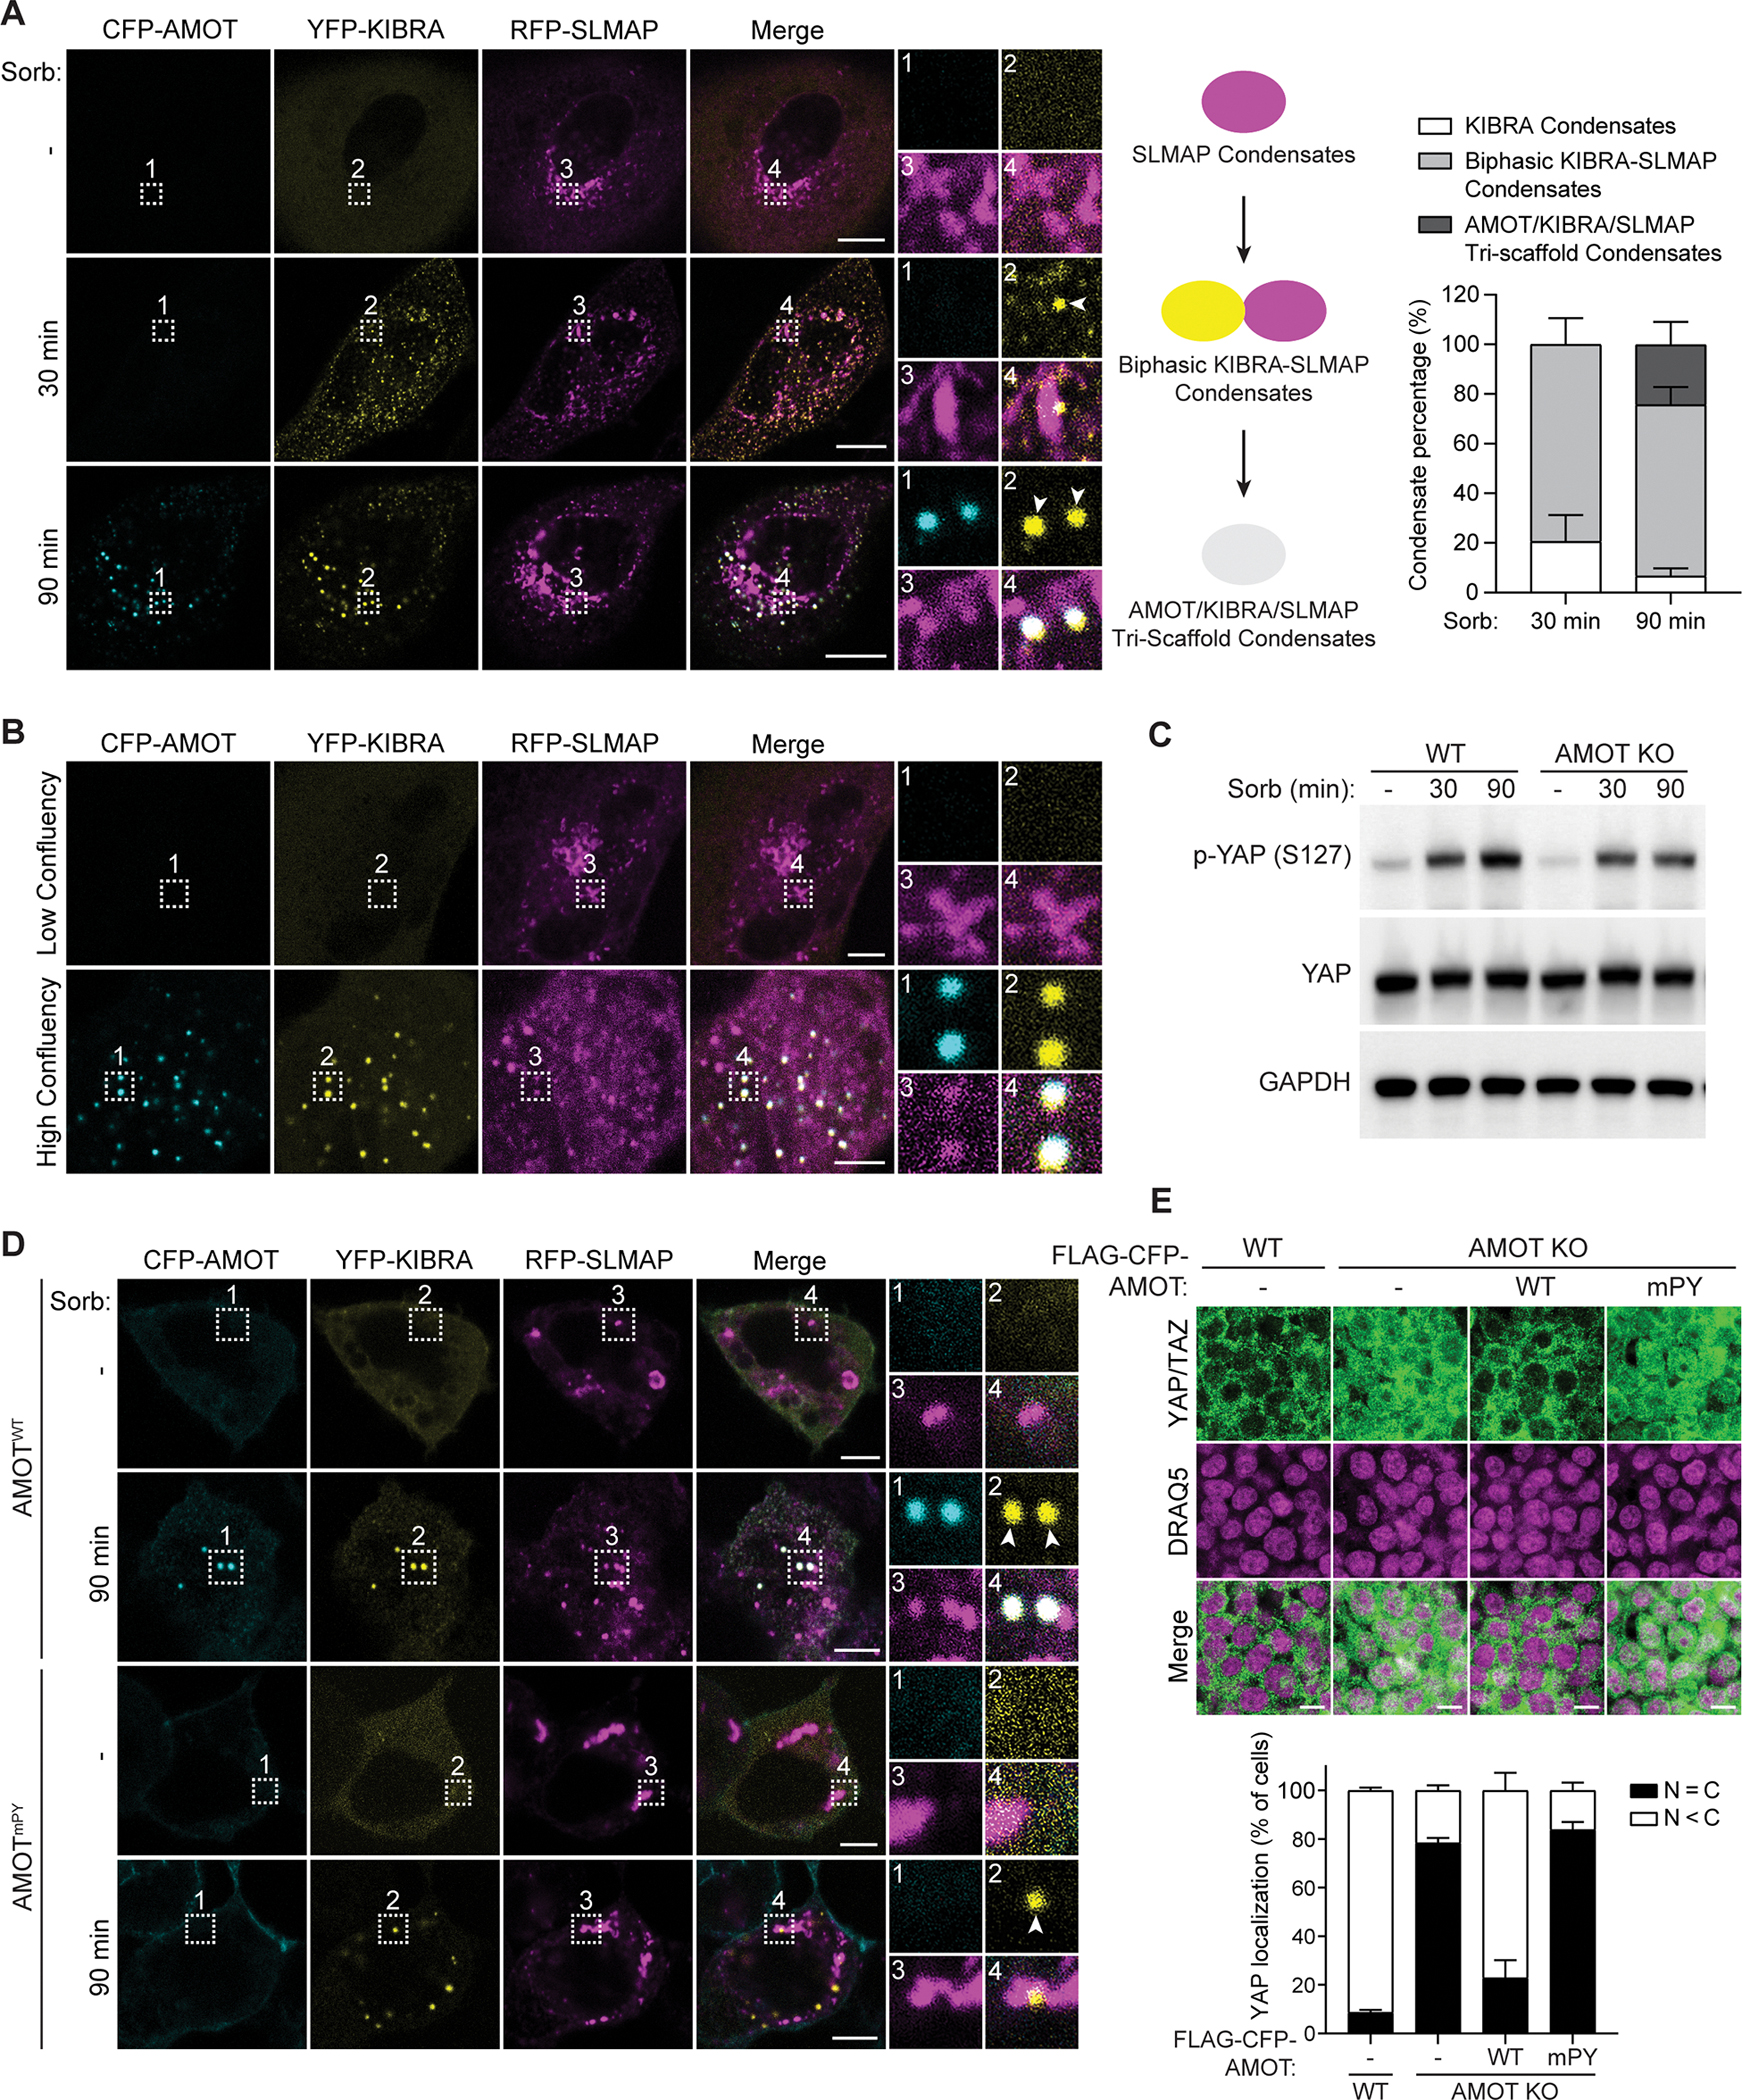
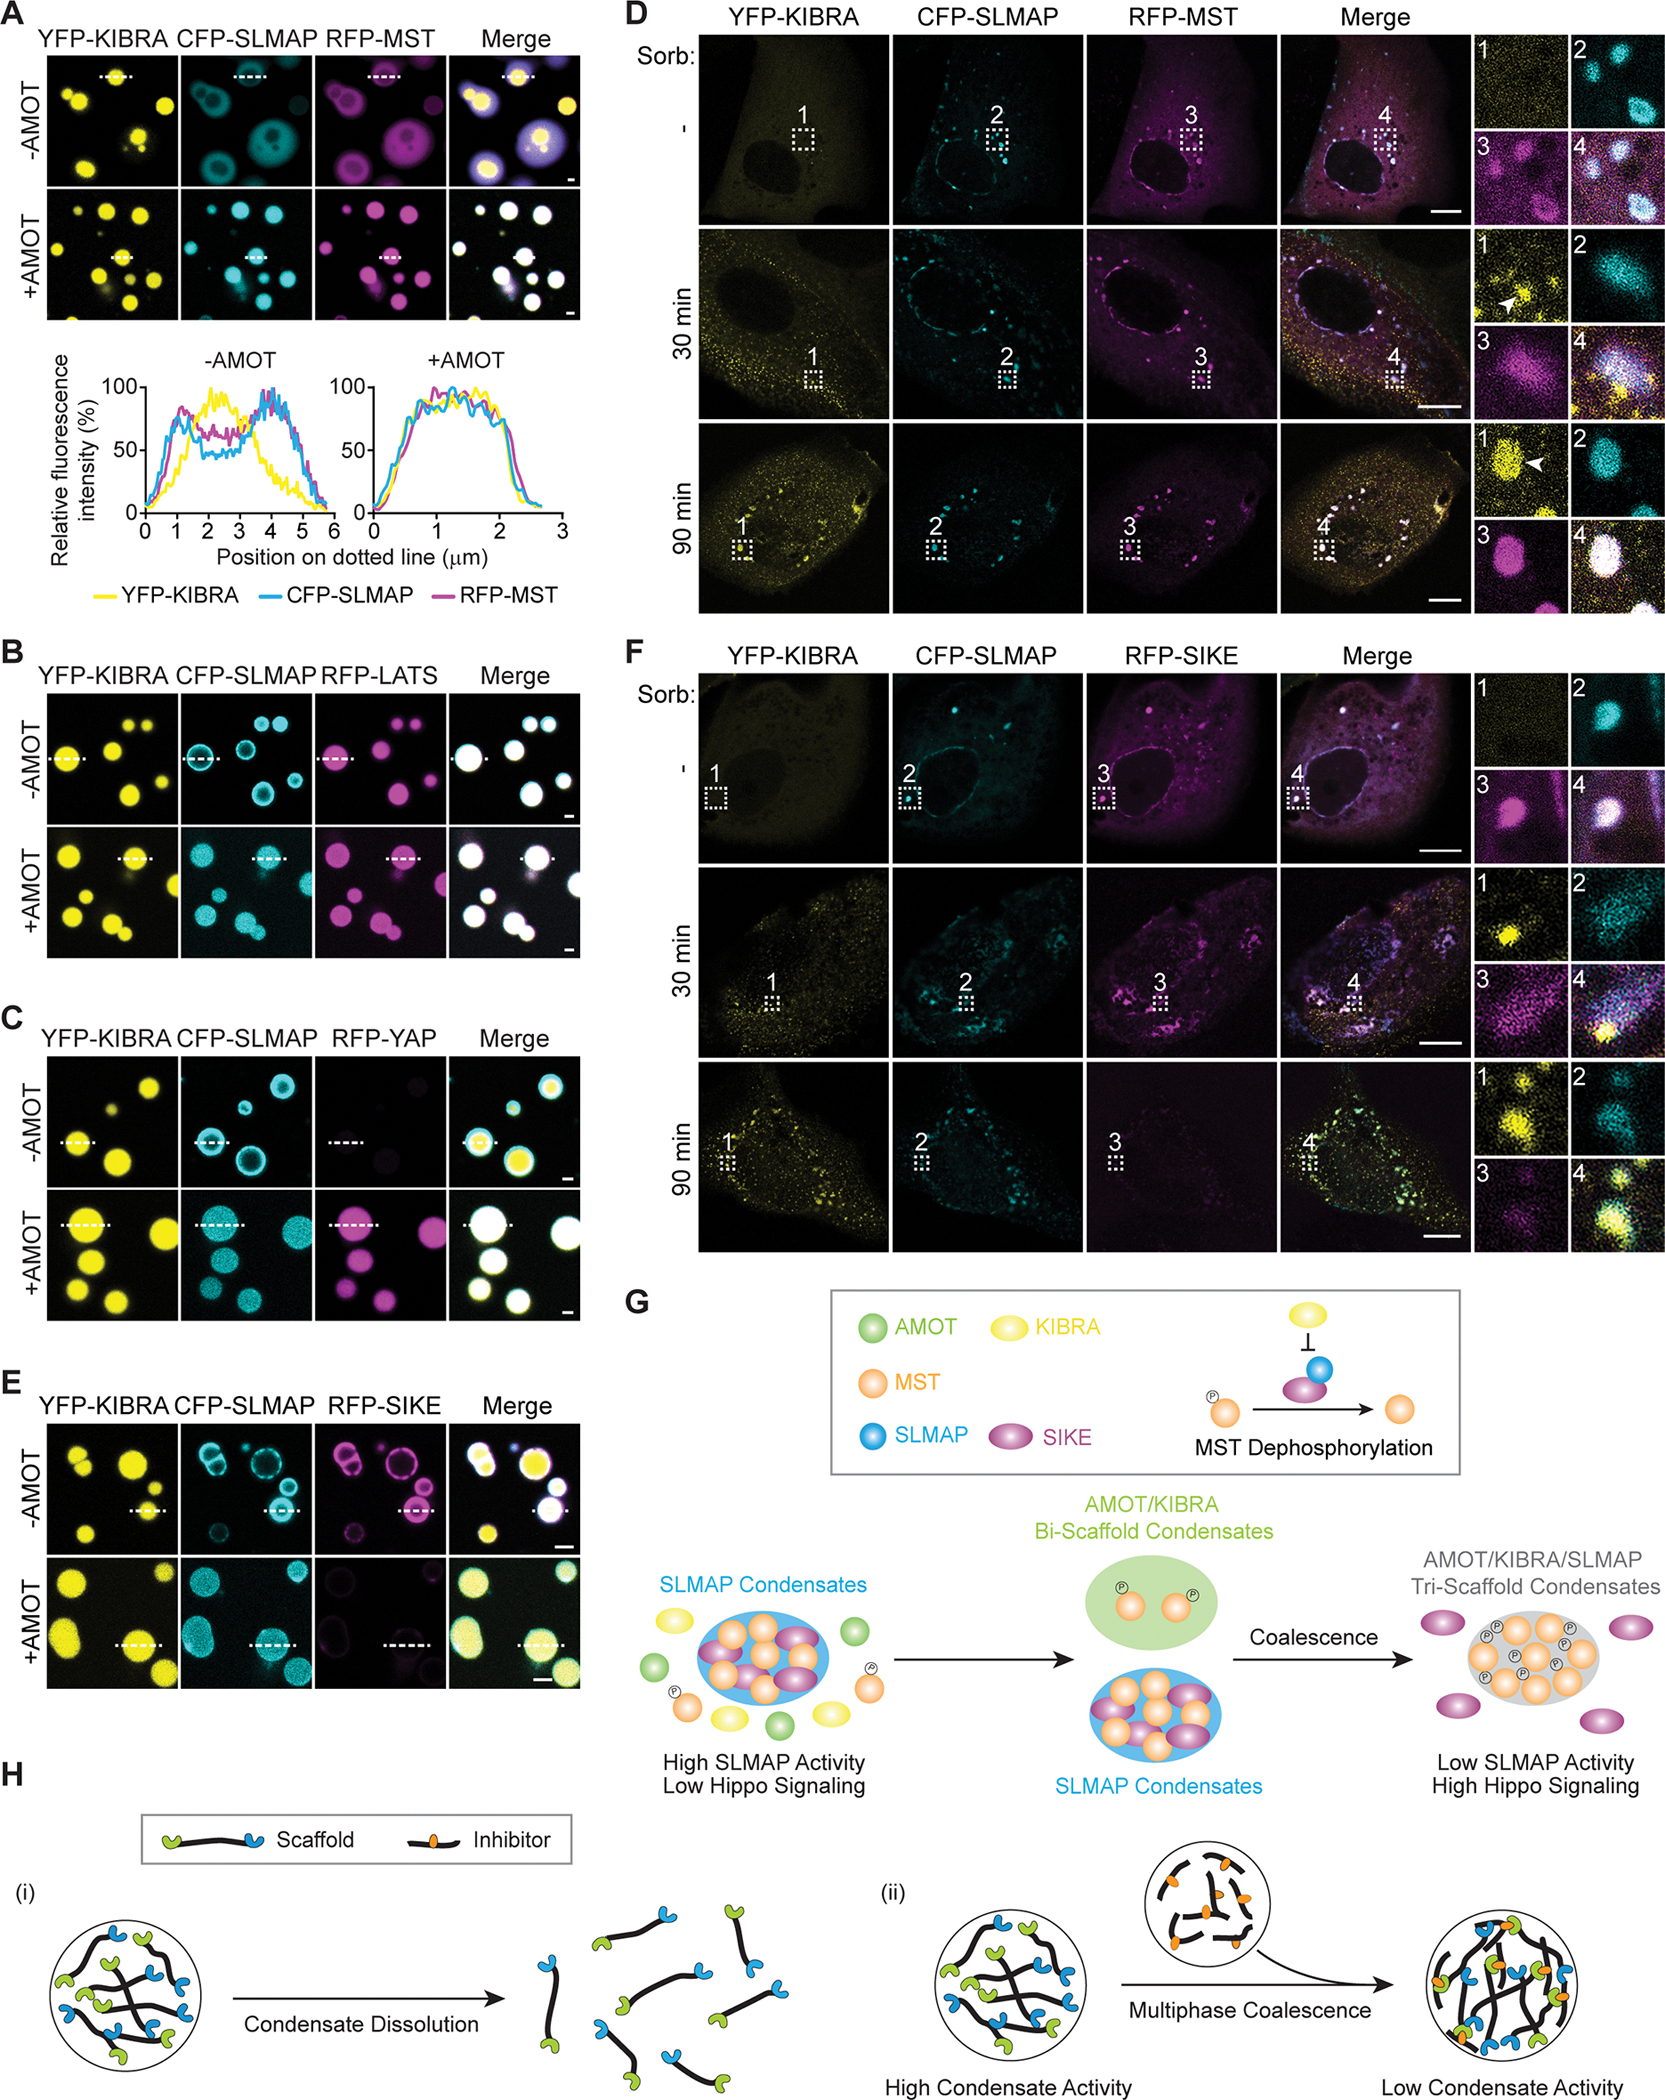
The function of biomolecular condensates is often restricted by condensate dissolution. Whether condensates can be suppressed without condensate dissolution is unclear. Here, we show that upstream regulators of the Hippo signaling pathway form functionally antagonizing condensates, and their coalescence into a common phase provides a mode of counteracting the function of biomolecular condensates without condensate dissolution. Specifically, the negative regulator SLMAP forms Hippo-inactivating condensates to facilitate pathway inhibition by the STRIPAK complex. In response to cell-cell contact or osmotic stress, the positive regulators AMOT and KIBRA form Hippo-activating condensates to facilitate pathway activation. The functionally antagonizing SLMAP and AMOT/KIBRA condensates further coalesce into a common phase to inhibit STRIPAK function. These findings provide a paradigm for restricting the activity of biomolecular condensates without condensate dissolution, shed light on the molecular principles of multiphase organization, and offer a conceptual framework for understanding upstream regulation of the Hippo signaling pathway.

Keywords: AMOT; Hippo pathway; KIBRA; STRIPAK; YAP; biomolecular condensates; cell-cell contact; cytoskeleton; multiphase; osmotic stress.


Conflict of interest statement

Declaration of interests The authors declare no competing interests.

Figures

Figure 1.
Figure 1.. AMOT forms biomolecular condensates in response to cell-cell contact.
(A) A schematic model illustrating Hippo pathway regulation in mammals. (B) Confocal images of live MDCK cells expressing CFP-AMOT with F-actin labeled by Cy5-SiR-Actin at low or high confluency. Enlarged view of boxed region shown to the right. (C) Fusion (top) and FRAP (bottom) assays of CFP-AMOT foci in MDCK cells. Quantification of fluorescence recovery shown at the bottom. (D) Confocal images of live MDCK cells expressing CFP-AMOT or CFP-AMOTΔAB at low confluency. Enlarged view of boxed region shown to the right. (E) Confocal images of live HA-CFP-AMOT knock-in HEK293A cells with F-actin labeled by Cy5-SiR-Actin at low or high confluency. Enlarged view of boxed region shown to the right. (F) A schematic diagram showing the domain organization of Hippo pathway upstream regulators AMOT, KIBRA and SLMAP. AB, actin-binding domain; CC, coiled-coil domain; WW, WW domain; C2, C2 domain; FHA, forkhead-associated domain; TM, transmembrane domain. (G) In vitro LLPS of purified CFP-AMOT variants (1 μM). (H) Fusion and FRAP assays of CFP-AMOT droplets in vitro. Quantification of fluorescence recovery shown at the bottom. (I) In vitro reconstitution of AMOT phase separation with and without F-actin (visualized by phalloidin). (Top) AMOT formed droplets without F-actin, but appeared as cables with F-actin. (Bottom) AMOTΔAB formed droplets with or without F-actin. (J) Confocal images showing the enrichment of purified MST/SAV complex (0.2 μM), LATS/MOB complex (0.1 μM) or YAP (0.2 μM) in AMOT condensates (0.4 μM) in vitro. Line profile of fluorescence shown to the right. Data in (C) and (H) are presented as mean ± S.D., n=3. Scale bars, 0.5 μm in (C), (H); 1 μm in (G), (J); 5 μm in (I); 10 μm in (B), (D), (E). See also Figure S1.
Figure 2.
Figure 2.. KIBRA undergoes phase separation in response to osmotic stress.
(A) In vitro LLPS of purified YFP-KIBRA variants (6 μM). (B) Fusion and FRAP assays of YFP-KIBRA droplets in vitro. Quantification of fluorescence recovery shown to the right. (C) Time-lapse images of live MDCK cells expressing the indicated YFP-KIBRA proteins with 0.4 M sorbitol. Enlarged view of boxed region shown to the right. (D) Time-lapse images of live MDCK cells expressing YFP-KIBRA treated with 0.4 M sorbitol followed by removing sorbitol at indicated time. Enlarged view of boxed region shown to the right. (E) Fusion and FRAP assays of YFP-KIBRA condensates in MDCK cells. Quantification of fluorescence recovery shown to the right. (F) Confocal images of live FLAG-YFP-KIBRA knock-in HEK293A cells with or without 0.4 M sorbitol. Arrowheads mark representative YFP-KIBRA foci. (G) Confocal images showing the enrichment of purified MST/SAV complex (0.2 μM) or LATS/MOB complex (0.1 μM) but not YAP (0.2 μM) in KIBRA condensates (0.4 μM) in vitro. Line profile of fluorescence shown to the right. Data in (B) and (E) are presented as mean ± S.D., n=3. Scale bars, 1 μm in (A), (B), (E), (G); 5 μm in (F); 10 μm in (C), (D). See also Figure S2.
Figure 3.
Figure 3.. AMOT and KIBRA coalesce into bi-scaffold condensates.
(A) In vitro reconstitution of AMOT/KIBRA bi-scaffold condensates using a mixture of purified CFP-AMOT (0.4 μM) and YFP-KIBRA (0.4 μM) proteins. Line profile of fluorescence shown at the bottom. (B) Coalescence of preformed AMOT (0.8 μM) and KIBRA (0.4 μM) condensates into bi-scaffold condensates in vitro. Line profile of fluorescence shown at the bottom. (C) Confocal images showing the enrichment of purified MST/SAV complex (0.2 μM), LATS/MOB (0.1 μM) complex or YAP (0.2 μM) in AMOT/KIBRA bi-scaffold condensates (0.4 μM /0.4 μM) in vitro. Line profile of fluorescence shown to the right. (D) Confocal images showing the induction of AMOT/KIBRA bi-scaffold condensates by high cell confluency in live HA-CFP-AMOT knock-in HEK293A cells expressing YFP-KIBRA. Enlarged view of boxed region shown to the right. (E) Confocal mages showing the induction of AMOT/KIBRA bi-scaffold condensates by 0.4 M sorbitol in live HA-CFP-AMOT knock-in HEK293A cells expressing YFP-KIBRA. Enlarged view of boxed region shown to the right. (F) Immunostaining showing localization of endogenous YAP in wildtype or AMOT/KIBRA-depleted HEK293 cells infected with lentivirus expressing the indicated AMOT and KIBRA proteins at high confluency. Quantification of YAP localization shown at the bottom. Cells were scored as diffusive YAP localization throughout the cell (N = C) or predominant cytoplasm YAP localization (N < C). At least 200 cells were quantified for each sample. Data are presented as mean ± S.D., n=3. (G) Western blot analysis of YAP phosphorylation (S127) upon 0.4 M sorbitol treatment in wildtype or AMOT/KIBRA double deficient HEK293 cells infected with control or lentivirus expressing the indicated AMOT and KIBRA proteins. Scale bars, 1 μm in (A-C); 10 μm in (D-F). See also Figure S3.
Figure 4.
Figure 4.. SLMAP forms condensates enriching MST and SIKE at steady state.
(A) In vitro LLPS of purified CFP-SLMAP variants (0.4 μM). (B) Fusion and FRAP assays of CFP-SLMAP droplets in vitro. Quantification of fluorescence recovery shown to the right. (C) Confocal images showing the enrichment of purified MST/SAV complex (0.1 μM) or SIKE (0.4 μM) in SLMAP condensates (0.4 μM) in vitro. Line profile of fluorescence shown to the right. (D) Confocal images of live sparsely cultured MDCK cells expressing the indicated CFP-SLMAP proteins. Enlarged view of boxed region shown to the right. (E) Fusion and FRAP assays of CFP-SLMAP foci in MDCK cells. Quantification of fluorescence recovery shown to the right. (F) Confocal images showing the enrichment of MST or SIKE in SLMAP condensates in live MDCK cells expressing the indicated proteins. Enlarged view of boxed region shown to the right. (G) Confocal images showing the colocalization of SLMAP condensates (arrowheads) with ER-Tracker Green (arrows) in live V5-RFP-SLMAP knock-in HEK293A cells. (H) Western blot analysis of MOB phosphorylation (T35) in wildtype or SLMAP knock-out HEK293A cells and infected with lentivirus expressing the indicated SLMAP proteins. Data in (B) and (E) are presented as mean ± S.D., n=3. Scale bars, 1 μm in (A-C), (E); 5 μm in (G); 10 μm in (D), (F). See also Figure S4.
Figure 5.
Figure 5.. AMOT/KIBRA bi-scaffold condensates coalesce with SLMAP condensates into tri-scaffold condensates in vitro.
(A) In vitro LLPS of purified YFP-KIBRA and CFP-SLMAP at a molar ratio of 1:1 (0.4 μM/0.4 μM) or 1:3 (0.2 μM/0.6 μM). Line profile of fluorescence shown at the bottom. (B) In vitro LLPS of purified YFP-KIBRA (0.4 μM) and CFP-SLMAP (0.4 μM) in the presence of increasing amount of purified AMOT protein (0, 0.2 and 0.8 μM). Line profile of fluorescence shown to the right. The SLMAP phase encircled the KIBRA droplets in the absence of AMOT (top row) but merged with KIBRA phase with increasing amount of AMOT (middle and bottom rows). (C) In vitro coalescence of preformed AMOT/KIBRA bi-scaffold condensates (0.8 μM/0.4 μM) and SLMAP condensates (0.4 μM). Line profile of fluorescence shown at the bottom. (D) Comparison of homotypic KIBRA-KIBRA and heterotypic KIBRA-SLMAP protein interactions by His-tag pulldown analysis. (E) Comparison of homotypic SLMAP-SLMAP and heterotypic KIBRA-SLMAP protein interactions by Co-IP analysis. (F) His-tag pulldown analysis of heterotypic KIBRA-SLMAP interaction in the presence of increasing amount of AMOT. (G) A network model depicting the role of relative PPI strengths in multiphase organization. Small circles represent monovalent interaction sites and lines indicate PPIs. Heavier line weight represents stronger interaction. Strength difference between noncompeting interactions is omitted. Homotypic PPIs drive LLPS of AMOT, KIBRA or SLMAP, noncompeting heterotypic PPI (AMOT-KIBRA) causes co-phase separation of AMOT and KIBRA, and competing PPIs (KIBRA-KIBRA, SLMAP-SLMAP, and KIBRA-SLMAP) lead to the formation of biphasic KIBRA-SLMAP condensates. AMOT may enhance the heterotypic KIBRA-SLMAP interaction or create de novo PPIs to promote multiphase coalescence. Scale bars, 1 μm. See also Figure S5.
Figure 6.
Figure 6.. Osmotic stress or high cell confluency induces AMOT/KIBRA/SLMAP tri-scaffold condensates in cells.
(A) Confocal images showing the sequential induction of biphasic KIBRA-SLMAP condensates and AMOT/KIBRA/SLMAP tri-scaffold condensates by 0.4 M sorbitol in live MDCK cells expressing the indicated proteins. Enlarged view of boxed region shown to the right. KIBRA foci were undetectable in untreated cells (top row), appeared frequently as small foci (arrowheads) immediately adjacent to SLMAP phase after 30 min treatment (middle row), and completely colocalized with SLMAP phase in tri-scaffold condensates after 90 min treatment (bottom row). Magenta oval, SLMAP phase; yellow oval, KIBRA phase; grey oval, AMOT/KIBRA/SLMAP tri-scaffold condensates. Quantification of the relative percentage of KIBRA condensates, biphasic KIBRA-SLMAP condensates and AMOT/KIBRA/SLAMAP tri-scaffold condensates is also shown. (B) Confocal images showing the induction of AMOT/KIBRA/SLMAP tri-scaffold condensates by high cell confluency in live MDCK cells. Enlarged view of boxed region shown to the right. (C) Western blot analysis of YAP phosphorylation (S127) upon 0.4 M sorbitol treatment in wildtype or AMOT knock-out HEK293 cells. (D) Confocal images showing the induction of condensates by 0.4 M sorbitol in AMOT knock-out HEK293 cells transfected with the indicated AMOT-expressing plasmids. Enlarged view of boxed region shown to the right. After 90 min treatment, KIBRA (arrowheads) colocalized with SLMAP phase in AMOTWT-expressing cells, but remained adjacent to SLMAP phase in AMOTmPY-expressing cells. (E) Immunostaining showing localization of endogenous YAP in wildtype or AMOT knock-out HEK293 cells infected with lentivirus expressing the indicated AMOT proteins at high confluency. Quantification of YAP localization shown at the bottom. Cells were scored as described in Figure 3F. Data in (A, n=5) and (E, n=3) are presented as mean ± S.D. Scale bars, 5 μm in (B), (D); 10 μm in (A), (E). See also Figure S6.
Figure 7.
Figure 7.. Tri-scaffold condensates enrich core kinase cascade components and exclude SIKE.
(A) Confocal images showing the partition of purified MST/SAV complex (0.2 μM) relative to the biphasic KIBRA-SLMAP condensates (0.4 μM/0.4 μM) or AMOT/KIBRA/SLMAP tri-scaffold condensates (0.8 μM/0.4 μM/0.4 μM) in vitro. Line profile of fluorescence shown at the bottom. (B) Confocal images showing the partition of purified LATS/MOB complex (0.1 μM) relative to the reconstituted biphasic KIBRA-SLMAP condensates (0.4 μM/0.4 μM) or AMOT/KIBRA/SLMAP tri-scaffold condensates (0.8 μM/0.4 μM/0.4 μM) in vitro. Line profile of fluorescence shown in Figure S7A. (C) Confocal images showing the partition of purified YAP (0.1 μM) relative to the reconstituted biphasic KIBRA-SLMAP condensates (0.4 μM/0.4 μM) or AMOT/KIBRA/SLMAP tri-scaffold condensates (0.8 μM/0.4 μM/0.4 μM) in vitro. Line profile of fluorescence shown in Figure S7B. (D) Confocal images showing the partition of MST relative to the biphasic KIBRA-SLMAP condensates or AMOT/KIBRA/SLMAP tri-scaffold condensates induced by 0.4 M sorbitol in live MDCK cells expressing the indicated proteins and AMOT. Enlarged view of boxed region shown to the right. (E) Confocal images showing the partition of SIKE (0.4 μM) into the SLMAP phase of biphasic KIBRA-SLMAP condensates (0.4 μM/0.4 μM) and its exclusion from reconstituted AMOT/KIBRA/SLMAP tri-scaffold condensates (0.8 μM/0.4 μM/0.4 μM) in vitro. Line profile of fluorescence shown in Figure S7G. (F) Confocal images showing the exclusion of SIKE from AMOT/KIBRA/SLMAP tri-scaffold condensates induced by 0.4 M sorbitol in live MDCK cells. Enlarged view of boxed region shown to the right. (G) Regulation of Hippo signaling by LLPS and multiphase coalescence of upstream regulators. When Hippo signaling is low, the constitutive SLMAP condensates enrich MST and SIKE to facilitate STRIPAK-mediated MST dephosphorylation. Hippo activating signals induce the formation of AMOT/KIBRA bi-scaffold condensates to facilitate pathway activation. The SLMAP condensates and AMOT/KIBRA bi-scaffold condensates further coalesce into AMOT/KIBRA/SLMAP tri-scaffold condensates to boost pathway activation by bringing KIBRA into SLMAP condensates to exclude SIKE. (H) Suppression of biomolecular condensate activity by two distinct mechanisms. Besides condensate dissolution (i), this study implicates multiphase coalescence (ii) as another mechanism that suppresses condensate activity by bringing in inhibitors from another phase without condensate dissolution. Scale bars, 1 μm in (A-C), (E); 10 μm in (D), (F). See also Figure S7.

Similar articles

  • Targeted perturbation of signaling-driven condensates.
    Gui T, Fleming C, Manzato C, Bourgeois B, Sirati N, Heuer J, Papadionysiou I, Montfort DIV, Gijzen MV, Smits LMM, Burgering BMT, Madl T, Schuijers J. Gui T, et al. Mol Cell. 2023 Nov 16;83(22):4141-4157.e11. doi: 10.1016/j.molcel.2023.10.023. Epub 2023 Nov 16. Mol Cell. 2023. PMID: 37977121
  • STK25 suppresses Hippo signaling by regulating SAV1-STRIPAK antagonism.
    Bae SJ, Ni L, Luo X. Bae SJ, et al. Elife. 2020 Apr 15;9:e54863. doi: 10.7554/eLife.54863. Elife. 2020. PMID: 32292165 Free PMC article.
  • Phase separation of Hippo signalling complexes.
    Bonello TT, Cai D, Fletcher GC, Wiengartner K, Pengilly V, Lange KS, Liu Z, Lippincott-Schwartz J, Kavran JM, Thompson BJ. Bonello TT, et al. EMBO J. 2023 Mar 15;42(6):e112863. doi: 10.15252/embj.2022112863. Epub 2023 Feb 20. EMBO J. 2023. PMID: 36807601 Free PMC article.
  • KIBRA connects Hippo signaling and cancer.
    Swaroop B SS, Kanumuri R, Ezhil I, Naidu Sampangi JK, Kremerskothen J, Rayala SK, Venkatraman G. Swaroop B SS, et al. Exp Cell Res. 2021 Jun 15;403(2):112613. doi: 10.1016/j.yexcr.2021.112613. Epub 2021 Apr 24. Exp Cell Res. 2021. PMID: 33901448 Review.
  • Hippo Signaling in Embryogenesis and Development.
    Wu Z, Guan KL. Wu Z, et al. Trends Biochem Sci. 2021 Jan;46(1):51-63. doi: 10.1016/j.tibs.2020.08.008. Epub 2020 Sep 11. Trends Biochem Sci. 2021. PMID: 32928629 Free PMC article. Review.

Cited by

References

    1. Adler JJ, Johnson DE, Heller BL, Bringman LR, Ranahan WP, Conwell MD, Sun Y, Hudmon A, and Wells CD (2013). Serum deprivation inhibits the transcriptional co-activator YAP and cell growth via phosphorylation of the 130-kDa isoform of Angiomotin by the LATS1/2 protein kinases. Proceedings of the National Academy of Sciences of the United States of America 110, 17368–17373. - PMC - PubMed
    1. Alberti S, Gladfelter A, and Mittag T (2019). Considerations and Challenges in Studying Liquid-Liquid Phase Separation and Biomolecular Condensates. Cell 176, 419–434. - PMC - PubMed
    1. Aragona M, Panciera T, Manfrin A, Giulitti S, Michielin F, Elvassore N, Dupont S, and Piccolo S (2013). A mechanical checkpoint controls multicellular growth through YAP/TAZ regulation by actin-processing factors. Cell 154, 1047–1059. - PubMed
    1. Bae SJ, Ni L, Osinski A, Tomchick DR, Brautigam CA, and Luo X (2017). SAV1 promotes Hippo kinase activation through antagonizing the PP2A phosphatase STRIPAK. eLife 6. - PMC - PubMed
    1. Banani SF, Lee HO, Hyman AA, and Rosen MK (2017). Biomolecular condensates: organizers of cellular biochemistry. Nature reviews Molecular cell biology 18, 285–298. - PMC - PubMed

Publication types

MeSH terms

Substances