. 2022 Nov 23;185(24):4488-4506.e20.
doi: 10.1016/j.cell.2022.09.042. Epub 2022 Oct 31.

WNK kinases sense molecular crowding and rescue cell volume via phase separation

Affiliations

WNK kinases sense molecular crowding and rescue cell volume via phase separation

Cary R Boyd-Shiwarski et al. Cell. .

Abstract

When challenged by hypertonicity, dehydrated cells must recover their volume to survive. This process requires the phosphorylation-dependent regulation of SLC12 cation chloride transporters by WNK kinases, but how these kinases are activated by cell shrinkage remains unknown. Within seconds of cell exposure to hypertonicity, WNK1 concentrates into membraneless condensates, initiating a phosphorylation-dependent signal that drives net ion influx via the SLC12 cotransporters to restore cell volume. WNK1 condensate formation is driven by its intrinsically disordered C terminus, whose evolutionarily conserved signatures are necessary for efficient phase separation and volume recovery. This disorder-encoded phase behavior occurs within physiological constraints and is activated in vivo by molecular crowding rather than changes in cell size. This allows kinase activity despite an inhibitory ionic milieu and permits cell volume recovery through condensate-mediated signal amplification. Thus, WNK kinases are physiological crowding sensors that phase separate to coordinate a cell volume rescue response.

Keywords: K-Cl cotransport; Na-K-2Cl cotransport; SLC12 cotransporter; WNK kinase; biomolecular condensates; cell volume regulation; hyperosmotic stress; macromolecular crowding; phase separation.


Conflict of interest statement

Declaration of interests The authors declare no competing interests.

Figures
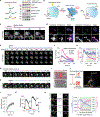
Figure 1.
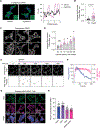
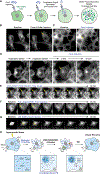
Figure 1.. WNK1 forms dynamic liquid-like condensates during hyperosmotic stress.
(A) Left: Phosphorylation-dependent regulation of the WNK1-SPAK/OSR1-NKCC/KCC system. Green phosphoproteins are activated, red are suppressed. Right: Increased endogenous pathway phosphorylation relative to isotonicity (iso), in response to 15min sorbitol stress in HEK cells. (B) Hyperosmotic stress is associated with WNK1 puncta formation. NKCC1 and KCC are phosphorylated, activating RVI. (C) Live cell time course of transfected eGFP-WNK1 in HEK cells, subjected to 50mM sorbitol. Representative of >30 experiments. (D) Fixed IF images of HEK cells transfected with mRuby2-WNK1 subjected to hyperosmotic stress (0.5M sorbitol × 5min), costained for endogenous SPAK and OSR1. (E-F) Live cell time course of a HEK cell expressing eGFP-WNK1, subjected to a low-level sorbitol stress series (12.5mM-37.5mM), with quantification of puncta number. Representative of 3 experiments. (G) Comparison of puncta size and number in an eGFP-WNK1 expressing cell subjected to 37.5 mM sorbitol, as shown in (E). 100s into the time course, puncta size stabilized while total number fell, consistent with fusion. (H) Fusion between two eGFP-WNK1 puncta 100s after 37.5mM sorbitol treatment. Bar= 2μm. (I) CLEM of a WNK1 condensate in fixed mRuby2-WNK1 transfected cells subjected to 0.1M sorbitol × 15min. Bar= 1μm. (J) Live cell imaging still of two cells expressing moderate and very high levels of eGFP-WNK1, subjected to 50mM KCl, demonstrating nucleation and spinodal decomposition, respectively. From Video S2. (K-L) FRAP images and corresponding recovery curve (N=6) of eGFP-WNK1 condensates in cells subjected to 50mM sorbitol. Bar= 2μm. (M) Reversibility of WNK1 puncta number over time in eGFP-WNK1 transfected cells subjected to osmotic challenges with 37.5 mM sorbitol, followed by H2O. Bar= 2μm. Representative of 3 experiments. (N) Quantification of eGFP droplet and cytosolic fluorescence intensity over time in transfected cells. All bars = 10μm except where indicated. See also Figure S1 and Videos S1–S2.
Figure 2.
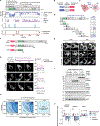
Figure 2.. Endogenous WNK1 forms hyperosmotic stress-induced condensates.
(A) Fixed WNK1 IF images in HEK cells under isotonic and hypertonic conditions (300mM sorbitol × 5min). Line scans = fluorescence intensities (FI) along the inset arrows on the left. (B) Quantification of average high intensity puncta size/confocal field in HEK cells under iso-(n=17 fields) and hypertonic conditions (n=34 fields). p<0.0001 by unpaired T-test. High intensity thresholded signal was kept constant across all conditions analyzed. (C) Fixed IF images of endogenous WNK1 in HEK cells subjected to various degrees of hypertonic stress (mM sorbitol). Thresholded high intensity signal is shown in red. (D) Quantification of average high-intensity puncta size/ confocal field in (C). n=10–26 confocal fields per condition; *p<0.0008 by one-way ANOVA, Dunnett’s post-hoc test vs isotonic control. (E-F) Live cell time course of mNG signal in mNG-WNK1 cells subjected to 50mM sorbitol, with quantification of high-intensity puncta number and size (measured across the entire field shown in (E)) over time. Representative of 10 experiments. (G-H) Colocalization of WNK-SPAK/OSR1 pathway components with mNG-WNK1 in fixed cells subjected to 300mM sorbitol. Colocalization was determined by Mander’s M1 overlap coefficient. N=29–33 confocal fields per component. All bars = 10μm. See also Figure S2–S3 and Video S4.
Figure 3.
Figure 3.. WNK1 phase separation is mediated by its intrinsically disordered CTD.
(A) Mammalian (Rat) WNK1 domain structure, with key domains color-coded on top. The kinase domain is flanked by an N-terminal domain (NTD) and a large C-terminal domain (CTD). Below is a to-scale analysis for protein disorder, low complexity regions (LCR) of short, medium, and long window length, Coiled-coil domains, and Prion-like regions. (B-C) Optogenetic WNK1 constructs, consisting of WT or E490G mutant (“Olig”) PHR domains, fused in-frame to mCherry-tagged WNK1 fragments. Blue light activation of PS-prone fragments triggers light-inducible phase separation (LIPS). (D) Analysis of PHR-WNK1-mCh fusions. Condensation-prone fragments are depicted with at “+”. (E) Still image examples from live cell LIPS experiments. Two fragments underwent LIPS (480–1242, Olig only; 1770–2126; WT & Olig). 1770–2126 also exhibited spontaneous dark state aggregation when fused to Olig (arrowheads). In contrast, 209–479 (kinase domain) did not undergo LIPS. Bars = 10μm (F) Full length and truncated N-terminal mRuby2-tagged WNK1 constructs, (G) Representative live cell images of cells expressing the constructs in (F), pre- and post-osmotic stress. Line scans depict normalized pre- and post-stress fluorescence intensities (FI) along the arrows depicted on the left. (H) In-cell phase diagrams depicting the phase behavior of the constructs in (F), as a function of FI and extracellular osmolality. (I-J) SPAK/OSR1/NKCC1/KCC activation in WNK1/WNK3 DKO cells expressing the constructs in (F), under iso- and hypertonic conditions (50mM sorbitol × 30min). p< *0.05 or **0.01 by one-way ANOVA, Sidak’s multiple comparison. See also Figures S4–S5 and Video S5.
Figure 4.
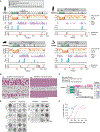
Figure 4.. C-terminal coiled coil domains augment WNK1 phase behavior and activity.
(A) Helical wheel and net diagrams of coiled coil (CC) heptad repeats. (B) Helical net diagram of the MidCC and CTCC domains in rat WNK1. Hydrophobic and Q residues within the a/d frame are circled. An “HQ” signature important for CTCC interactions resides within the a/d frame. To disrupt CC function, proline substitutions were introduced into the a/d register. (C) WNK1 double CC mutant (WNK1-CCmut). The proline substitutions disrupted predicted CCs without affecting disorder tendency. (D) Proline mutagenesis of the midCC and CTCC did not affect LIPS in the Cry2-PHR system. (E) Mutation of the midCC and CTCC in the context of full-length WNK1 (WNK1-CCmut) introduced a rightward shift of the binodal at low levels of hypertonic stress. (F) PS in sorbitol-stressed wild-type HEK cells expressing mRb2-tagged WT Full-length WNK1 and WNK1-CCmut. Despite similar pre-stress expression levels, the CC mutant formed smaller short-lived condensates. Intensities were pseudocolored using the Thermal lookup table in FIJI. (G-H) Pathway activation in WNK1/WNK3 DKO cells expressing WT-WNK1 or WNK1-CCmut, under isotonic and hypertonic conditions (50mM sorbitol × 30min). p< *0.05 or **0.01 by one-way ANOVA, Sidak’s multiple comparisons test.
Figure 5.
Figure 5.. Evolutionary conservation of WNK intrinsic disorder and phase behavior.
(A) Disorder, LCR, CC, and PLD analysis of human WNK1 (hWNK1), human WNK3 (hWNK3), D. melanogaster WNK (dmWNK), and C. elegans WNK (ceWNK). Sequence identity of hWNK3, dmWNK, and ceWNK versus hWNK1, divided into three regions: the NTD, the kinase domain, and the large C-terminal domain (CTD). (B) Amino acid sequences of the rat WNK1 and dmWNK CTDs. Glutamines in dmWNK are shown in magenta. Condensation-prone regions in rat WNK1 (Fig 3D) are highlighted in lilac. (C-D) dmWNK deletion analysis. Diagram of eGFP-tagged dmWNK truncation constructs, with glutamine residues shown in magenta. Apart from dmWNK 1–845, all constructs tested formed puncta during hypertonic stress (376 mOsm). (E) Compared to full-length dmWNK, dmWNK 1–1000 formed puncta in fewer cells at a given level of hyperosmotic stress. For dmWNK 1–2253, 252–669 cells were assessed per stress condition. For dmWNK 1–1000, 230–659 cells were assessed. See also Figure S6.
Figure 6.
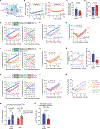
Figure 6.. WNK1 CTD augments NKCC1-dependent RVI.
(A) Cariporide-sensitive NHE1/anion exchanger (AE) and bumetanide-sensitive NKCC1/KCC RVI systems. To exclude NHE1-dependent effects, all RVI studies were conducted in the presence of cariporide. (B) Cell volume changes in WNK1/WNK3 DKO cells, transfected with full-length (FL) or 1-494 WNK1 and subjected to 50mM sorbitol (final = 350mOsm). (C) DKO cells expressing 1-494 WNK1 exhibit less % volume loss than cells expressing FL WNK1. p<0.001, unpaired T-test. (D) Cell size measurements in DKO cells expressing FL vs 1-494 WNK1, measured with an ImageStream system. N= # cells analyzed per condition. p<0.001, unpaired T-test. (E) RVI curves derived from the cell volume measurements in (B), expressed as % volume recovery following cell shrinkage. On the right is a magnification of the gray shaded area on the left graph. *p<0.05, #<0.01, or ^<0.001, repeated measures two-way ANOVA, Sidak’s multiple comparison. (F-G) RVI curves in DKO cells transfected with FL or 1-494 WNK1, +/− Bumetanide. (H) Bumetanide-sensitive RVI, calculated as the difference between the +/− bumetanide curves in (F) & (G). *p=0.0320 for FL vs 1-494 WNK1 expressing DKO cells @ 5min post stress, unpaired T-test. (I) RVI curves in DKO cells transfected with 1-1242 WNK1 vs FL WNK1. *p<0.05 or #<0.01, repeated measures two-way ANOVA, Sidak’s multiple comparison. (J) RVI curves in DKO cells transfected with 1-1242 WNK1, +/− Bumetanide. (K) RVI curves in DKO cells transfected with CCmut WNK1, vs FL WNK1. *p<0.05, repeated measures two-way ANOVA, Sidak’s multiple comparison. (L) RVI curves in DKO cells transfected with CCmut WNK1, +/− Bumetanide. (M) Summary of mean RVI traces in (E), (I), (K), and for the WNK1 1-494-FUS and -TDP-43 rescue chimeras detailed in Figure S7, presented without error bars. Cells expressing 1-1242 WNK1, CCmut WNK1, or the 1-494 chimeras exhibit an intermediate volume recovery phenotype. (N) Bumetanide-sensitive Rb+ fluxes in DKO cells transfected with FL or 1-494 WNK1, under near isotonic (310mOsm) or hypertonic (370mOsm) conditions. N=6 sets of fluxes per condition. **p=0.0010 by two-way ANOVA, Tukey’s multiple comparison. (O) Shrinkage-induced Bumetanide-sensitive Rb flux in DKO cells transfected with FL WNK1 or 1-494 WNK1. N=6 sets of flux measurements per condition. **p=0.0015 by unpaired T-test. See also Figures S5 and S7.
Figure 7.
Figure 7.. WNK1 is a molecular crowding sensor.
(A) Ficoll microinjection experiment. (B) Effect of “KH” K+ Acetate/HEPES vehicle control buffer microinjection into mNG WNK1 cells (C) Microinjection of Ficoll-containing KH buffer increased mNG-WNK1 puncta formation. (D) mNG-WNK1 cells subjected to hypertonic stress (50mM KCl), hypotonic cell swelling (1:1 water in KH buffer), followed by Ficoll microinjection. (E) 10min timecourse following Ficoll injection. Crowding agent induced localized long-lived puncta formation. (F) Ficoll injection into HEK-293 cells (WT background) expressing mRb2 full length WNK1 induced widespread sustained puncta formation over a 10min timecourse. (G) Cytosolic Ficoll injection into HEK-293 cells expressing mRb2-1-494 WNK1 resulted in no visible PS and dilution of cytoplasmic signal. The construct partially distributes into the nucleus; fluorescence intensity of this fraction remained unchanged over 10min. (H) WNK-SPAK/OSR1 activation during hyperosmotic stress. Hyperosmotic stress causes cell shrinkage and crowding. This triggers PS of the WNK-SPAK/OSR1 pathway. Pathway localization within condensates favors SPAK/OSR1 phosphoactivation. Material leaves the WNK condensates, permitting phosphorylation of NKCC1 and the KCCs at the plasma membrane, resulting in net ion influx and RVI. All bars = 10μm. See also Video S7.

Comment in

  • Controlling the crowd with a WNK.
    Holt LJ, Denes LT. Holt LJ, et al. Cell. 2022 Nov 23;185(24):4465-4467. doi: 10.1016/j.cell.2022.10.027. Cell. 2022. PMID: 36423576 Free PMC article.

References

    1. Acevedo SF, Peru y Colon de Portugal RL, Gonzalez DA, Rodan AR, and Rothenfluh A (2015). S6 Kinase Reflects and Regulates Ethanol-Induced Sedation. J Neurosci 35, 15396–15402. - PMC - PubMed
    1. Akella R, Humphreys JM, Sekulski K, He H, Durbacz M, Chakravarthy S, Liwocha J, Mohammed ZJ, Brautigam CA, and Goldsmith EJ (2021). Osmosensing by WNK Kinases. Mol Biol Cell 32, 1614–1623. - PMC - PubMed
    1. Alberti S, Gladfelter A, and Mittag T (2019). Considerations and Challenges in Studying Liquid-Liquid Phase Separation and Biomolecular Condensates. Cell 176, 419–434. - PMC - PubMed
    1. Andre AAM, and Spruijt E (2020). Liquid-Liquid Phase Separation in Crowded Environments. Int J Mol Sci 21. - PMC - PubMed
    1. Bhuiyan MI, Song S, Yuan H, Begum G, Kofler J, Kahle KT, Yang SS, Lin SH, Alper SL, Subramanya AR, et al. (2016). WNK-Cab39-NKCC1 signaling increases the susceptibility to ischemic brain damage in hypertensive rats. J Cereb Blood Flow Metab. - PMC - PubMed

Publication types

Substances