. 2022 Nov;10(11):e005548.
doi: 10.1136/jitc-2022-005548.

Deciphering molecular and cellular ex vivo responses to bispecific antibodies PD1-TIM3 and PD1-LAG3 in human tumors

Affiliations

Deciphering molecular and cellular ex vivo responses to bispecific antibodies PD1-TIM3 and PD1-LAG3 in human tumors

Marina Natoli et al. J Immunother Cancer. 2022 Nov.

Abstract

Background: Next-generation cancer immunotherapies are designed to broaden the therapeutic repertoire by targeting new immune checkpoints including lymphocyte-activation gene 3 (LAG-3) and T cell immunoglobulin and mucin-domain containing-3 (TIM-3). Yet, the molecular and cellular mechanisms by which either receptor functions to mediate its inhibitory effects are still poorly understood. Similarly, little is known on the differential effects of dual, compared with single, checkpoint inhibition.

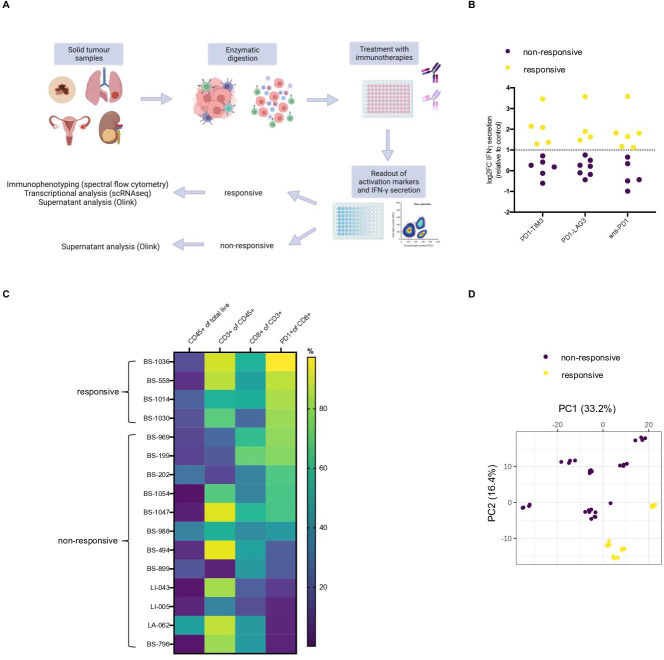
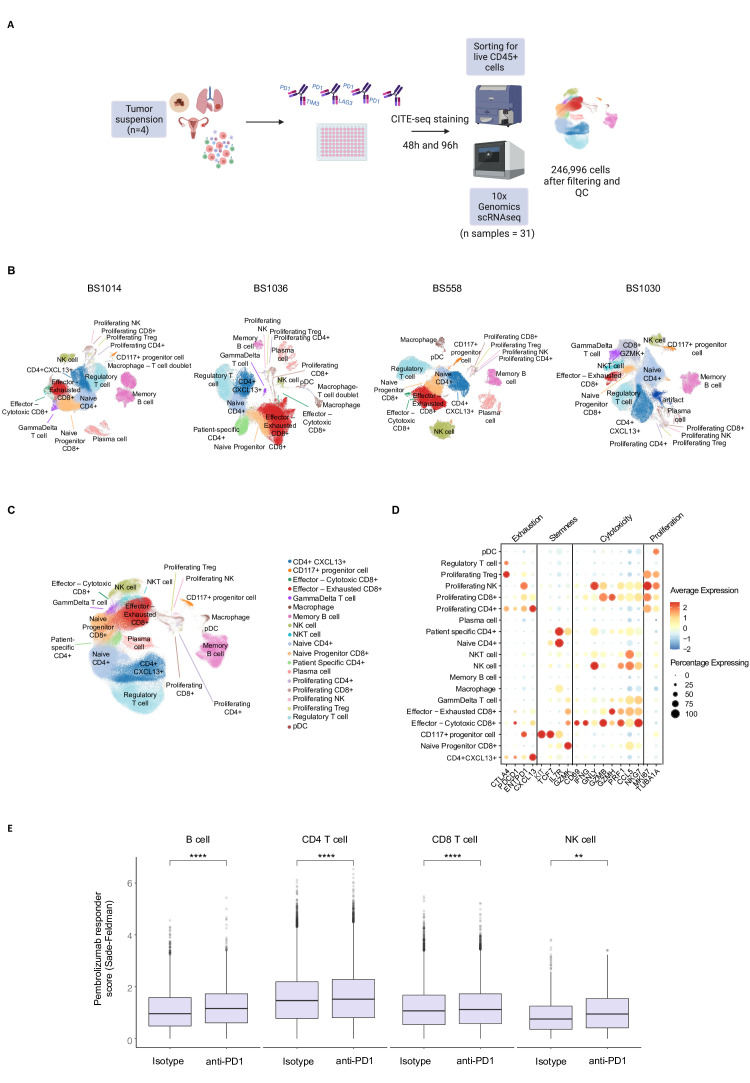
Methods: We here performed in-depth characterization, including multicolor flow cytometry, single cell RNA sequencing and multiplex supernatant analysis, using tumor single cell suspensions from patients with cancer treated ex vivo with novel bispecific antibodies targeting programmed cell death protein 1 (PD-1) and TIM-3 (PD1-TIM3), PD-1 and LAG-3 (PD1-LAG3), or with anti-PD-1.

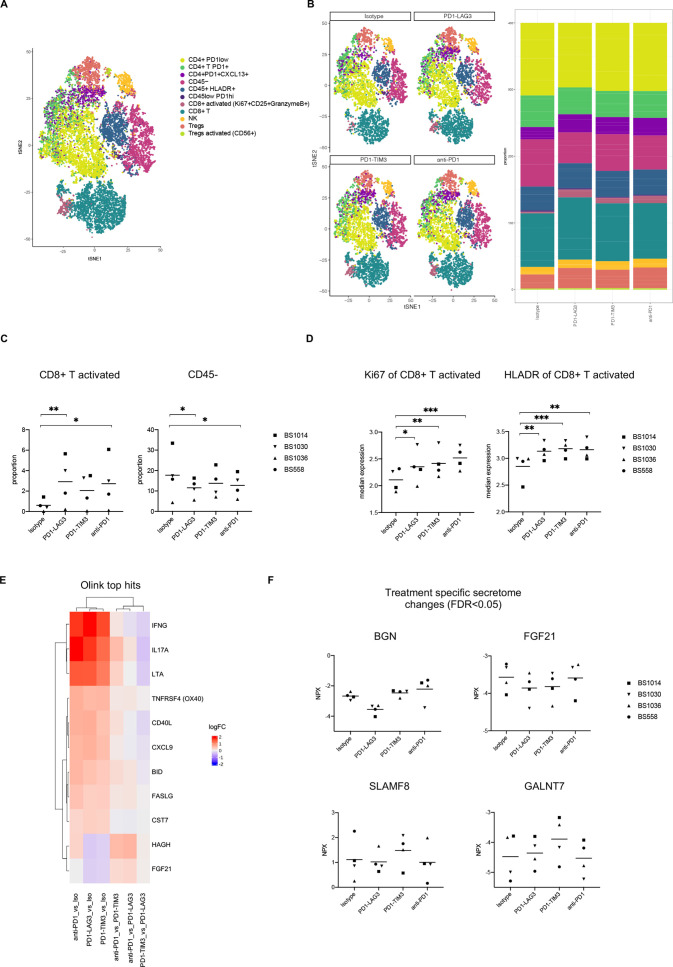
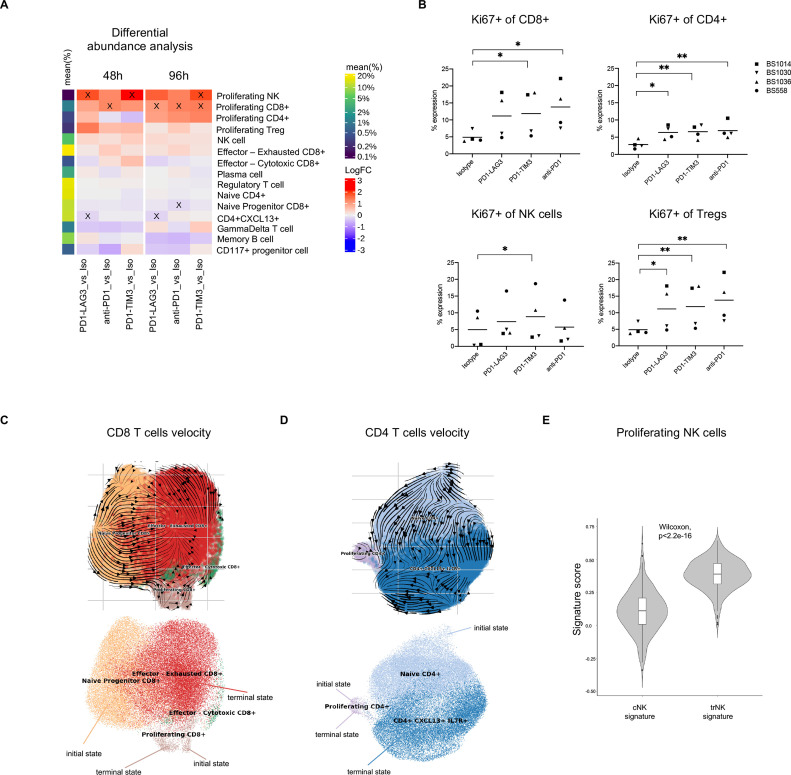
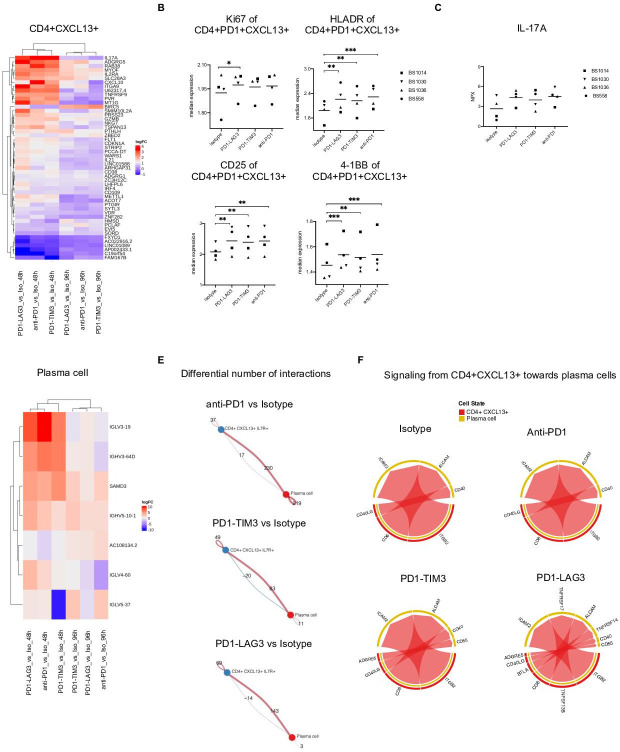
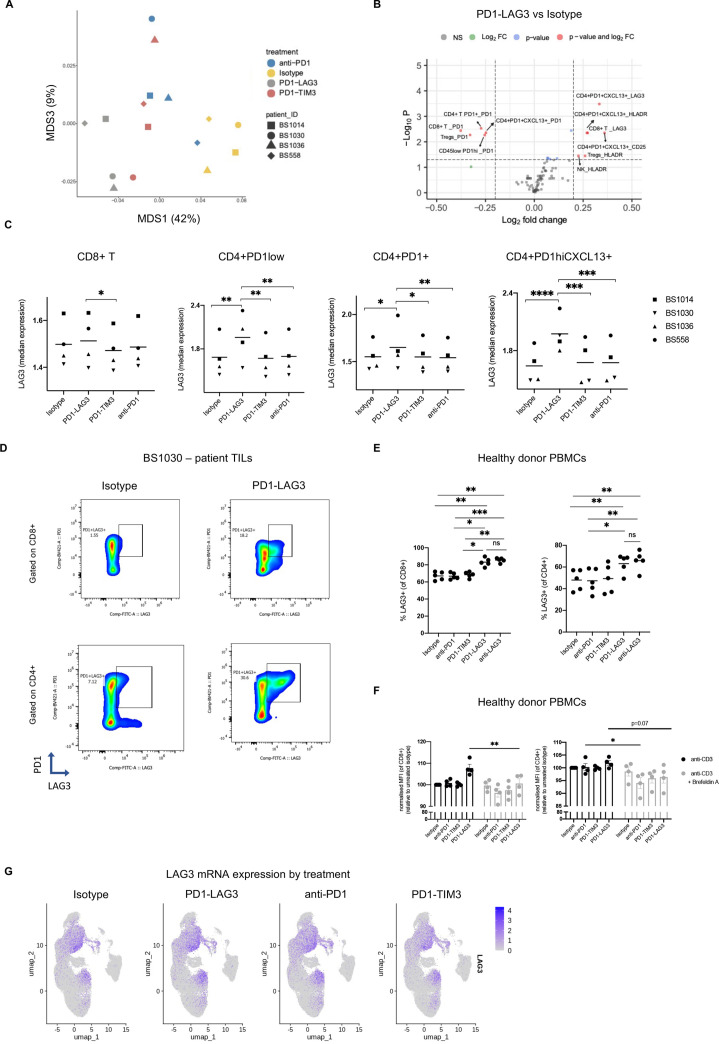
Results: We identified patient samples which were responsive to PD1-TIM3, PD1-LAG3 or anti-PD-1 using an in vitro approach, validated by the analysis of 659 soluble proteins and enrichment for an anti-PD-1 responder signature. We found increased abundance of an activated (HLA-DR+CD25+GranzymeB+) CD8+ T cell subset and of proliferating CD8+ T cells, in response to bispecific antibody or anti-PD-1 treatment. Bispecific antibodies, but not anti-PD-1, significantly increased the abundance of a proliferating natural killer cell subset, which exhibited enrichment for a tissue-residency signature. Key phenotypic and transcriptional changes occurred in a PD-1+CXCL13+CD4+ T cell subset, in response to all treatments, including increased interleukin-17 secretion and signaling toward plasma cells. Interestingly, LAG-3 protein upregulation was detected as a unique pharmacodynamic effect mediated by PD1-LAG3, but not by PD1-TIM3 or anti-PD-1.

Conclusions: Our in vitro system reliably assessed responses to bispecific antibodies co-targeting PD-1 together with LAG-3 or TIM-3 using patients' tumor infiltrating immune cells and revealed transcriptional and phenotypic imprinting by bispecific antibody formats currently tested in early clinical trials.

Keywords: biomarkers, tumor; clinical trials as topic; immunotherapy.


Conflict of interest statement

Competing interests: KH, PG, IID, FJ, DM, AZw, PW, SS, PU, CK, LC-D and HK are current or former employees of F. Hoffmann-La Roche and declare patent applications and stock ownership with Roche. AZ received consulting/advisor fees from Bristol-Myers Squibb, Merck Sharp & Dohme, Hoffmann-La Roche, NBE Therapeutics, Secarna, ACM Pharma and Hookipa and maintains further non-commercial research agreements with Secarna, Hookipa, Roche and Beyondsprings. All other authors declare they have no competing interests.

Figures

Figure 1
Figure 1
Tumor infiltrating immune cells from selected patients show increased cytokine secretion and T cell activation in response to anti-PD-1, PD1-TIM3 and PD1-LAG3. (A) Schematic depicting treatment of tumor infiltrating immune cells from solid tumor (n=19) and pleural effusion (n=2) samples with bsAbs, anti-PD-1 or control isotype. Treatment (96 hours) was followed by assessment of activation by flow cytometry or IFN-γ, classification into responsive or non-responsive samples and further characterization by immunophenotyping, single-cell transcriptional analysis or multiplex supernatant analysis. (B) Log2 fold change (log2FC) in IFN-γ secretion comparing each treated sample (with levels of secretion above limit of detection, n of patients=11) to the isotype control. A threshold of 1 log2FC (dotted line) was applied to identify patient samples to be considered responsive to in vitro treatment. One responsive patient-derived pleural effusion sample (BS199) was excluded from further analyses due to differences in sample preparation. (C) Heatmap showing percentage of expression of selected surface markers in each patient tumor suspension samples (n=16) used in the in vitro experiments containing measurable live CD45+ cells. (D) PCA plot showing separation of tumor suspension samples (n=11, samples with sufficient supernatant that passed quality check) based on multiplex Olink supernatant analysis of 659 protein markers. Classification into responsive or non-responsive is indicated by the color legend. bsAbs, bispecific antibodies; IFN, interferon; LAG-3, lymphocyte-activation gene 3; PCA, principal component analysis; PD-1, programmed cell death protein 1; TIM-3, T cell immunoglobulin and mucin-domain containing-3.
Figure 2
Figure 2
Multidimensional immune-profiling of tumor suspensions that show ex vivo responsiveness to bsAbs or anti-PD-1 treatment. (A) tSNE plots of pooled treatment conditions from the four responsive patients showing cell-type annotation (treatment of 96 hours; n patients=4, n treatments=4, total n analyzed samples=16). (B) tSNE plots showing identified cell types for pooled patient samples, split by treatment (left). Bar plots showing the proportion of each identified cell type out of all the cells in each treatment (patients are pooled, right). (C) Proportion of CD8+ T and CD45 cells from the four responsive tumor suspension in different treatment conditions. Clustering was conducted using FlowSOM (*p<0.05, **p<0.01, one-way ANOVA with multiple comparisons). (D) Median marker intensity of Ki67 and HLA-DR on the activated CD8+ population in the four responsive tumor suspensions in different treatment conditions. Clustering was conducted using FlowSOM (*p<0.05, **p<0.01, ***p<0.001, one-way ANOVA with multiple comparisons). (E) Heatmap of top significantly differentially regulated proteins, obtained by running a linear model using limma, from the multiplex supernatant analysis, in the four responsive tumor suspensions across different treatment versus control comparisons. (F) Normalized protein expression (NPX) of indicated soluble markers in the four responsive tumor suspensions which show significant differences (FDR <0.05) in different treatment versus control comparisons (BGN: comparing PD1-LAG3 with all other treatments; FGF21: comparing PD1-TIM3 or PD1-LAG3 with isotype or anti-PD1; GALNT7: comparing PD1-TIM3 with all other treatments; SLAMF8: comparing PD1-TIM3 with PD1-LAG3) measured by Olink analysis. ANOVA, analysis of variance; bsAbs, bispecific antibodies; BGN, Biglycan; CD40L, CD40-ligand; CXCL9, chemokine (C-X-C motif) ligand 9; FDR, false discovery rate; FGF21, fibroblast growth factor 21; GALNT7, GalNAc transferase 7; IFN, interferon; IL-17A, interleukin-17A; LAG-3, lymphocyte-activation gene 3; LOD, limit of detection; LTA, lymphotoxin; PD-1, programmed cell death protein 1; SLAMF8, SLAM Family Member 8; TIM-3, T cell immunoglobulin and mucin-domain containing-3; TNFRSF4, TNF Receptor Superfamily Member 4; tSNE, t-distributed stochastic neighbor embedding.
Figure 3
Figure 3
Single-cell transcriptional analysis of the activity of PD1-TIM3, PD1-LAG3 and anti-PD-1 in vitro. (A) Schematic depicting treatment of tumor suspensions from the four responsive solid tumor samples with bsAbs, anti-PD-1 or control isotype for 48 and 96 hours, followed by CITE-seq staining and sorting for CD45+ cells before running 10x Genomics 3’ scRNAseq protocol. After filtering and quality check, a total of 246 996 CD45+ cells were ultimately obtained from 31 individual samples, while one sample failed after 10x chip loading. (B) uniform manifold approximation and projection (UMAP) of CD45+ cells, split by each patient (indicated above). Cell types were annotated using a custom ‘overlapping cluster ID’ to then merge the samples deriving from different patients. (C) UMAP of final filtered and annotated cells, with all patients merged and batch adjusted as described in the methods. (D) Dot plot showing the average gene expression and the percentage of cells expressing the genes indicated at the bottom, per each annotated cell type. The genes were categorized as exhaustion, stemness, cytotoxicity and proliferation markers. (E) Box plots showing a significant difference (Wilcoxon paired signed rank test) in the PD-1 response score, calculated as indicated in the methods using previously published data, between the indicated cell types in the isotype control (left) or anti-PD-1-treated (right) conditions (**p<0.01, ****p<0.0001). bsAbs, bispecific antibodies; LAG-3, lymphocyte-activation gene 3; NK, natural killer; PD-1, programmed cell death protein 1; scRNAseq, single cell RNA sequencing; IM-3, T cell immunoglobulin and mucin-domain containing-3.
Figure 4
Figure 4
RNA velocity toward a proliferating state is enhanced in human tumor infiltrating immune cells treated with single or dual inhibitory receptor blockade. (A) Differential abundance analysis of cell types in different conditions and at different timepoints across patients. The heatmap shows the log fold change (logFC) between each treatment-control comparison indicated at the bottom (per timepoint). Significant (FDR <0.1) changes are indicated with an X. Mean frequency (%) of each cell type out of the total number of cells is also indicated in the color legend. (B) Percentage expression of Ki67 on different T cell or NK cell clusters, manually gated (*p<0.05, **p<0.01, one-way ANOVA with multiple comparisons). (C) UMAP of CD8+ T cell subsets from pooled conditions (all treated cells from the 96-hour timepoint) with projected RNA velocity vectors (top) and putative initial and terminal (bottom) states. (D) UMAP of conventional CD4+ T cell subsets (excluding Treg cells) from pooled conditions (all treated cells from the 96-hour timepoint) with projected RNA velocity vectors (top) and putative initial and terminal (bottom) states. (E) Violin plot showing cNK or trNK signature score distribution in cells from the proliferating NK cluster, calculated using AddModuleScore function within Seurat in R; p value was determined with a Wilcoxon paired test. ANOVA, analysis of variance; cNK, conventional NK; FDR, false discovery rate; NK, natural killer; trNK, tissue-resident NK; Treg, regulatory T cell.
Figure 5
Figure 5
Transcriptional changes are induced by single or dual checkpoint blockade within CD4+CXCL13+ cells which influence interaction with plasma cells. (A) Top differentially expressed genes showing strongest change among all contrasts (average logCPM >0, adjusted p value <0.05) in the CD4+CXCL13+ cluster. (B) Median marker intensity of Ki67, HLA-DR, 4-1BB and CD25 on the CD4+CXCL13+ population in the four responsive tumor suspension in different treatment conditions. Clustering was conducted using FlowSOM (*p<0.05, **p<0.01, ***p<0.001, one-way ANOVA with multiple comparisons). (C) of IL-17A measured by Olink technology in the supernatant of the four responsive tumor suspension across different treatment versus control comparisons (FDR <0.05, comparing each treatment with control isotype). (D) Top differentially expressed genes showing strongest change among all contrasts (average logCPM >0, adjusted p value <0.05) in the plasma cell cluster. (E) Circle plots showing the differential number of interactions between the CD4+CXCL13+ and the plasma cell clusters, in each treatment compared with control, at 96 hours. Calculated using Cellchat. (F) Chord diagram of ligand-receptor pairs were mediating the communications from CD4+CXCL13+ toward plasma cells, in each treatment or control condition, at 96 hours, calculated using Cellchat. ANOVA, analysis of variance; CPM, counts per million; FDR, false discovery rate; IL-17A, interleukin-17A; LAG-3, lymphocyte-activation gene 3; PD-1, programmed cell death protein 1; TIM-3, T cell immunoglobulin and mucin-domain containing-3.
Figure 6
Figure 6
LAG-3 surface upregulation is an anti-LAG-3-specific effect which does not require anti-PD-1. (A) Multidimensional scaling plots of each indicated sample, based on the scaled and transformed fluorescence intensities of each marker on all cell populations and batch-adjusting by patient (using ComBat in R40), indicating the distance in similarity between samples. (B) Volcano plot depicting differentially expressed markers (logFC >|1.5|, adjusted p value <0.05) within each cell subset across patients in the PD1-LAG3-treated condition compared with the isotype control. The color legend indicates significant values according to the indicated thresholds. The values were obtained by running a linear mixed model using the median marker intensities of each population based on FlowSOM clustering. (C) Median marker intensity of LAG-3 on different T cell populations in the four responsive tumor suspensions in different treatment conditions. Clustering was conducted using FlowSOM (*p<0.05, **p<0.01, ***p<0.001, ****p<0.0001, one-way ANOVA with multiple comparisons). (D) Representative dot plots showing expression of PD-1 and LAG-3 on CD8+ or CD4+ T cells from patient BS1030 tumor suspension in indicated treatment conditions. (E) Frequency of LAG-3+CD8+ (left) or CD4+ (right) T cells from healthy donor PBMCs, treated with isotype control, anti-PD-1, PD1-TIM3, PD1-LAG3 or an anti-LAG-3 antibody. P value was obtained by running two-way ANOVA with multiple comparisons (*p<0.05). Each dot indicates and independent PBMC donor (n=4). (F) Geometric MFI of LAG-3 surface expression on CD8+ (left) or CD4+ (right) T cells from anti-CD3 (clone OKT3) prestimulated healthy donor PBMCs, treated with isotype control, anti-PD-, PD1-TIM3 or PD1-LAG3 in the presence or absence of Brefeldin A. P value was obtained by running two-way ANOVA with multiple comparisons (*p<0.05). MFI is normalized to the isotype control, each dot indicates and independent PBMC donor (n=3). (G) UMAP projections showing average LAG-3 expression in all cells deriving from different treatment conditions. ANOVA, analysis of variance; FC, fold change; LAG-3, lymphocyte-activation gene 3; MFI, mean fluorescence intensity; PBMC, peripheral blood mononuclear cell; PD-1, programmed cell death protein 1; TIM-3, T cell immunoglobulin and mucin-domain containing-3.

References

    1. Wei SC, Duffy CR, Allison JP. Fundamental mechanisms of immune checkpoint blockade therapy. Cancer Discov 2018;8:1069–86. 10.1158/2159-8290.CD-18-0367 - DOI - PubMed
    1. Ribas A, Wolchok JD. Cancer immunotherapy using checkpoint blockade. Science 2018;359:1350–5. 10.1126/science.aar4060 - DOI - PMC - PubMed
    1. Huang AC, Zappasodi R. A decade of checkpoint blockade immunotherapy in melanoma: understanding the molecular basis for immune sensitivity and resistance. Nat Immunol 2022;23:660–70. 10.1038/s41590-022-01141-1 - DOI - PMC - PubMed
    1. Thommen DS, Schumacher TN. T cell dysfunction in cancer. Cancer Cell 2018;33:547–62. 10.1016/j.ccell.2018.03.012 - DOI - PMC - PubMed
    1. Baitsch L, Baumgaertner P, Devêvre E, et al. . Exhaustion of tumor-specific CD8⁺ T cells in metastases from melanoma patients. J Clin Invest 2011;121:2350–60. 10.1172/JCI46102 - DOI - PMC - PubMed

Publication types

MeSH terms

Substances