. 2022 Oct 1;93(10):101101.
doi: 10.1063/5.0097853.

Recent advances in microresonators and supporting instrumentation for electron paramagnetic resonance spectroscopy

Affiliations

Recent advances in microresonators and supporting instrumentation for electron paramagnetic resonance spectroscopy

Nandita Abhyankar et al. Rev Sci Instrum. .

Abstract

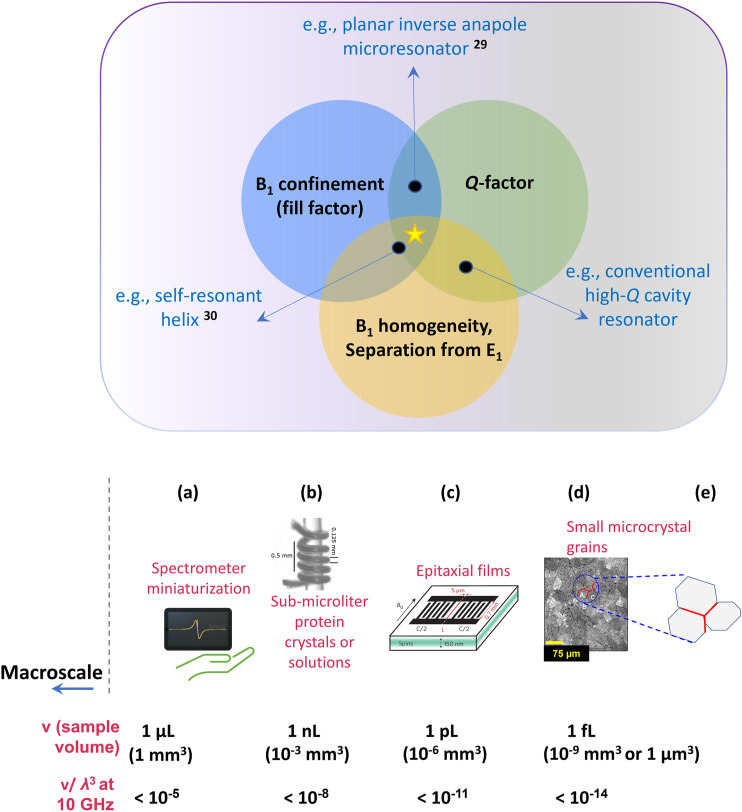
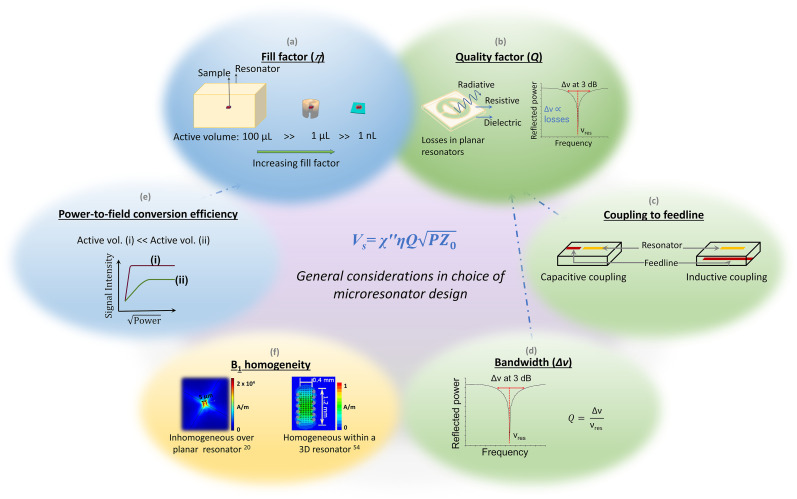
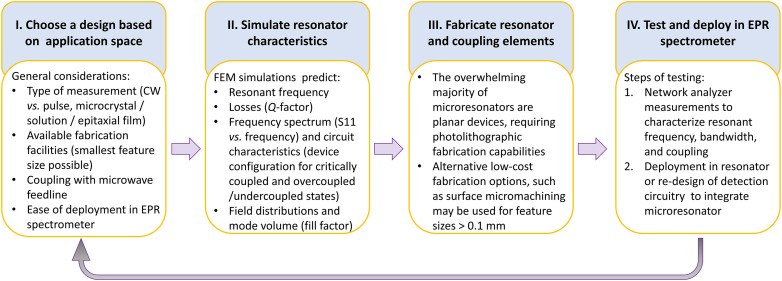
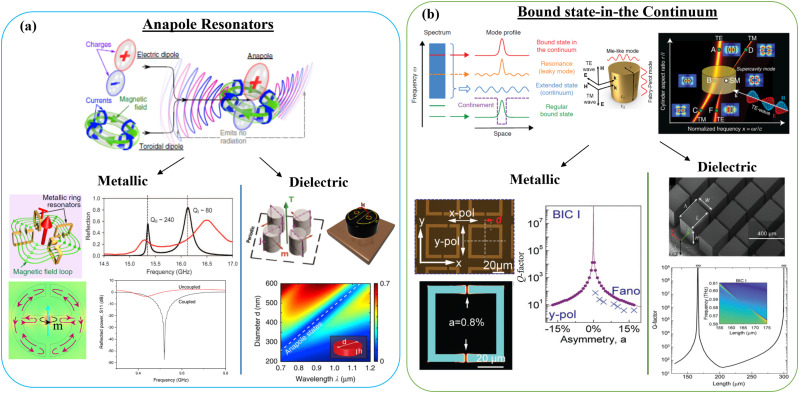
Electron paramagnetic resonance (EPR) spectroscopy characterizes the magnetic properties of paramagnetic materials at the atomic and molecular levels. Resonators are an enabling technology of EPR spectroscopy. Microresonators, which are miniaturized versions of resonators, have advanced inductive-detection EPR spectroscopy of mass-limited samples. Here, we provide our perspective of the benefits and challenges associated with microresonator use for EPR spectroscopy. To begin, we classify the application space for microresonators and present the conceptual foundation for analysis of resonator sensitivity. We summarize previous work and provide insight into the design and fabrication of microresonators as well as detail the requirements and challenges that arise in incorporating microresonators into EPR spectrometer systems. Finally, we provide our perspective on current challenges and prospective fruitful directions.


Figures

FIG. 1.
FIG. 1.
Overview of application space for microresonators over a range of sub-microliter to femtoliter sample volumes. The panel on the top shows the primary desirable characteristics of a microresonator: confinement of the excitation field B1 to a small volume matching the sample shape and size, optimal quality factor Q, i.e., reduced losses through non-magnetic mechanisms of microwave absorption (high Q is particularly important for CW EPR experiments), and desired field distribution characteristics, i.e., homogeneous distribution of B1 over the active volume (particularly important for quantitative CW EPR and pulse EPR experiments) and E1 minimum in the region of B1 maximum. A more detailed description of desired microresonator characteristics is in Fig. 2. Examples of microresonator impact are in the areas of (a) miniaturization of EPR spectrometers; (b) solutions of limited-quantity biomacromolecules; (c) characterization of dopants and defects in epitaxial materials, including materials used to create spin qubits; (d) microcrystals with dimensions ≈1–100 μm (volumes ≈1 fl to 1 nl); and (e) grain boundaries and interfaces between thin films. Figures in the lower part of the panel have been reproduced with permission from Rahmati et al., Surf. Sci. 595, 115 (2005). Copyright 2005 Elsevier; Bienfait et al., Nat. Nanotechnol. 11(3), 253–257 (2016). Copyright 2016 Springer Nature; and Sidabras et al., Sci. Adv. 5(10), eaay1394 (2019). Copyright 2019 Author(s), licensed under a Creative Commons Attribution 4.0 License.
FIG. 2.
FIG. 2.
General considerations in choice of microresonator design. The resonator performance is characterized by two main metrics—fill factor η (a) and quality factor Q (b)—that directly determine signal intensity. Additional considerations when choosing a design are the ease and variability of coupling to the microwave feedline (c). Higher Q favors easier coupling and is desirable for CW EPR experiments. On the other hand, a lower Q provides a larger bandwidth (d), which is desirable for pulse EPR experiments. To realize short pulse lengths that maximize spectral excitation bandwidth, pulse EPR also requires a high power-to-field conversion efficiency (e). Finally, B1 homogeneity (f) is most important for quantitative CW measurements and in pulse EPR. Surface or planar resonators provide high conversion efficiencies but suffer from poor B1 homogeneity. 3D helical or ring resonators can provide homogeneous B1 that is weak due to the relatively large sizes. In the case of pulse EPR, the effects of B1 inhomogeneity can in principle be mitigated by applying shaped pulses. Images in panel (f) adapted from Abhyankar et al., Sci. Adv. 6(44), eabb0620 (2020). Copyright 2020 Author(s), licensed under a Creative Commons Attribution 4.0 License and Sidabras et al., Sci. Adv. 5(10), eaay1394 (2019). Copyright 2019 Author(s), licensed under a Creative Commons Attribution 4.0 License.
FIG. 3.
FIG. 3.
Flowchart describing the microresonator design cycle. Stage I: A suitable resonator design that can be adapted to EPR spectroscopy (see general considerations delineated in Sec. II A 1) is chosen based on the application space, desired resonator characteristics, coupling mechanism, and fabrication capabilities available (see Sec. II A 3). Stage II: Simulations are performed to optimize resonator dimensions for the desired resonant frequency and coupling to the feedline. Stage III: Devices are fabricated by electroplating/etching, photolithography, or other nanofabrication techniques as per availability. Stage IV: Fabricated devices are characterized using a vector network analyzer (VNA). If the expected characteristics are not obtained, the cycle is repeated to adjust the resonator design and/or fabrication. When the expected resonator characteristics have been obtained, the resonator is combined with additional detection circuity (Secs. II A 4 and III) to enable EPR spectroscopy.
FIG. 4.
FIG. 4.
Summary of two classes of optical metamaterial resonators leveraging electromagnetic: (a) anapole modes, and (b) bound-state-in-the-continuum (BIC) modes. As illustrated in (a) top-panel, an anapole mode is excited through destructive interference in the far-field between an electric-dipole and the toroidal-dipole mode resulting in a device supporting extremely high Q-factors. Similarly, (b) top-panel illustrates the presence of a bound-state (red line) in the radiation continuum (blue region), that theoretically exhibits a Q-factor of infinity. Resonance frequency vs resonator size for an individual dielectric nanopillar resonator [(b), top-right] illustrates excitation of a various TE and TM modes with different field-distributions, including the excitation of a BIC mode that is characterized by a vanishing linewidth in the dispersion plot. Both anapole and BIC modes, through geometric engineering, can be excited in metallic [bottom-left panels in (a) and (b)] or dielectric [bottom-right panels in (a) and (b)] systems, and offer extremely high-Q factors in subwavelength modal volumes with mode-profile that could be geometrically engineered for application in EPR spectroscopy. Figures have been reproduced with permission from Savinov et al., Commun. Phys. 2, 69 (2019). Copyright 2019 Springer Nature; Abhyankar et al., Sci. Adv. 6(44), eabb0620 (2020). Copyright 2020 Author(s), licensed under a Creative Commons Attribution 4.0 License; Basharin et al., Phys. Rev. X 5, 011036 (2015). Copyright 2015 Author(s), licensed under a Creative Commons Attribution 3.0 Unported License; Kaelberer et al., Science 330(6010), 1510–1512 (2010). Copyright 2010 AAAS; Bogdanov et al., Adv. Photonics 1, 016001 (2019). Copyright 2019 Author(s), licensed under a Creative Commons Attribution 4.0 License; Totero Gongora et al., Nat. Commun. 8, 15535 (2017). Copyright 2017 Springer Nature; Hsu et al., Nat. Rev. Mater. 1(9), 16048 (2016). Copyright 2016 Springer Nature; Rybin et al., Phys. Rev. Lett. 119, 243901 (2017). Copyright 2017 American Physical Society; Yang et al., Adv. Opt. Mater. 7, 1900546 (2019). Copyright 2019 Wiley; and Shi et al., Adv. Mater. 31, 1901673 (2019). Copyright 2019 Wiley.
FIG. 5.
FIG. 5.
Examples of (a) capacitively coupled microresonator with feedline and single gap microstrip microresonator, (b) capacitively coupled microstrip line resonator with composite arrays, and [(c) and (d)] inductively coupled microresonators. Figures reproduced from Torrezan et al., Rev. Sci. Instrum. 80(7), 075111 (2009) with the permission of AIP Publishing; Mohebbi et al., J. Appl. Phys. 115(9), 094502 (2014) with the permission of AIP Publishing; and Twig et al., Rev. Sci. Instrum. 81(10), 104703 (2010) with the permission of AIP Publishing.
FIG. 6.
FIG. 6.
Simplified schematic of the microwave excitation and detection circuitry in a continuous wave EPR spectrometer. Excitation occurs along the transmit pathway (red arrows). Detection occurs along the receive pathway (blue arrows). The reference arm (green) combines with the receive pathway to ensure optimal detector biasing.
FIG. 7.
FIG. 7.
Simplified schematic diagram of the interface between the microwave excitation/detection circuitry and the feedline/resonator operated in the (left) reflection mode and (right) transmission mode.
FIG. 8.
FIG. 8.
Overview of different types of permanent magnet shapes: (a) Annular stray-field permanent magnet used in EPR spectroscopy using a non-resonant, near-field probe. Figure reproduced with permission from Campbell et al., Anal. Chem. 87(9), 4910–4916 (2015). Copyright 2015 American Chemical Society. (b) C-shaped center field permanent magnet. Center field 342.1 mT, pole gap distance 3.5 cm, weight ≈15 kg. Figure reproduced with permission from Überrück et al., J. Magn. Reson. 314, 106724 (2020). Copyright 2020 Elsevier. (c) Dipole center-field permanent magnet used for ODNP measurements. Top: CAD model courtesy of Maly. Bottom: Magnet with resonator placed inside laboratory incubator for temperature control. Photo credit Maly.
FIG. 9.
FIG. 9.
Different realizations of an annular Halbach magnet. (a) ideal magnet, (b) discretized version of (a) and (c) NMR-Mandhala with 16 elements, (d) octagonal magnet form trapezoidal pieces, and (e) wedge design. Figure reproduced with permission from H. Soltner and P. Blümler, Concepts Magn. Reson., Part A 36A, 211–222 (2010). Copyright 2010 John Wiley & Sons.

Similar articles

Cited by

References

    1. Weil J. A. and Bolton J. R., Electron Paramagnetic Resonance: Elementary Theory and Practical Applications, 2nd ed. (John Wiley & Sons, 2007).
    1. Roessler M. M. and Salvadori E., “Principles and applications of EPR spectroscopy in the chemical sciences,” Chem. Soc. Rev. 47(8), 2534–2553 (2018). 10.1039/c6cs00565a - DOI - PubMed
    1. Schweiger A. and Jeschke G., Principles of Pulse Electron Paramagnetic Resonance (Oxford University Press, 2001).
    1. Lenahan P. M. and J. F. Conley, Jr., “What can electron paramagnetic resonance tell us about the Si/SiO2 system?,” J. Vac. Sci. Technol. B 16(4), 2134 (1998). 10.1116/1.590301 - DOI
    1. Biskup T., “Doping of organic semiconductors: Insights from EPR spectroscopy,” Appl. Phys. Lett. 119(1), 010503 (2021). 10.1063/5.0054685 - DOI