. 2023 Apr 19;146(4):1483-1495.
doi: 10.1093/brain/awac389.

MCAM+ brain endothelial cells contribute to neuroinflammation by recruiting pathogenic CD4+ T lymphocytes

Affiliations

MCAM+ brain endothelial cells contribute to neuroinflammation by recruiting pathogenic CD4+ T lymphocytes

Marc Charabati et al. Brain. .

Abstract

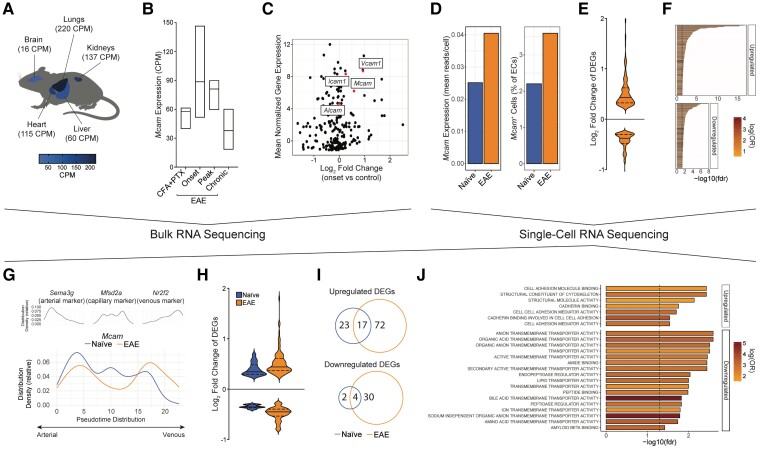
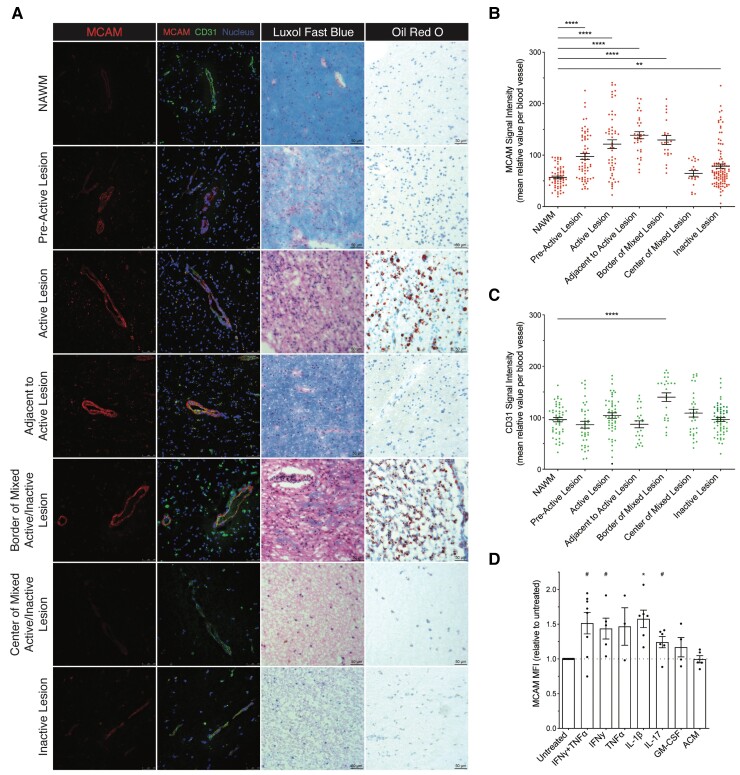
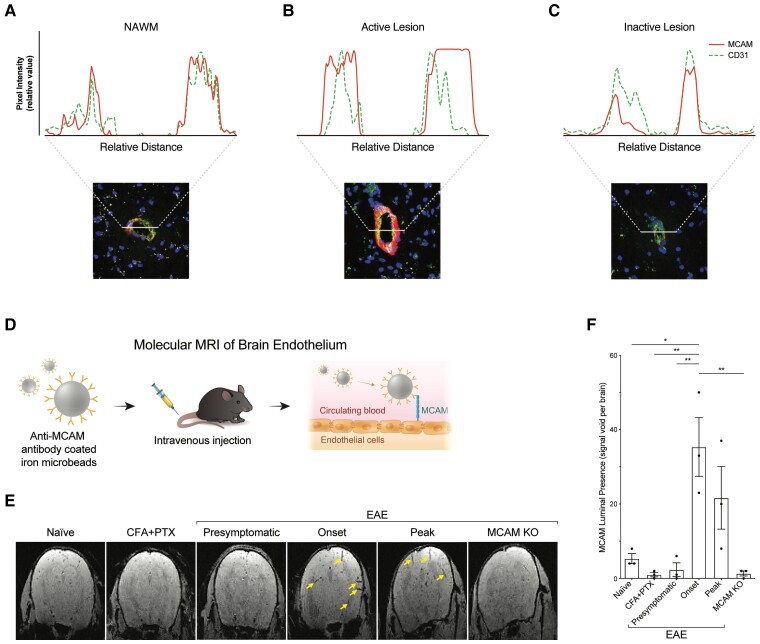
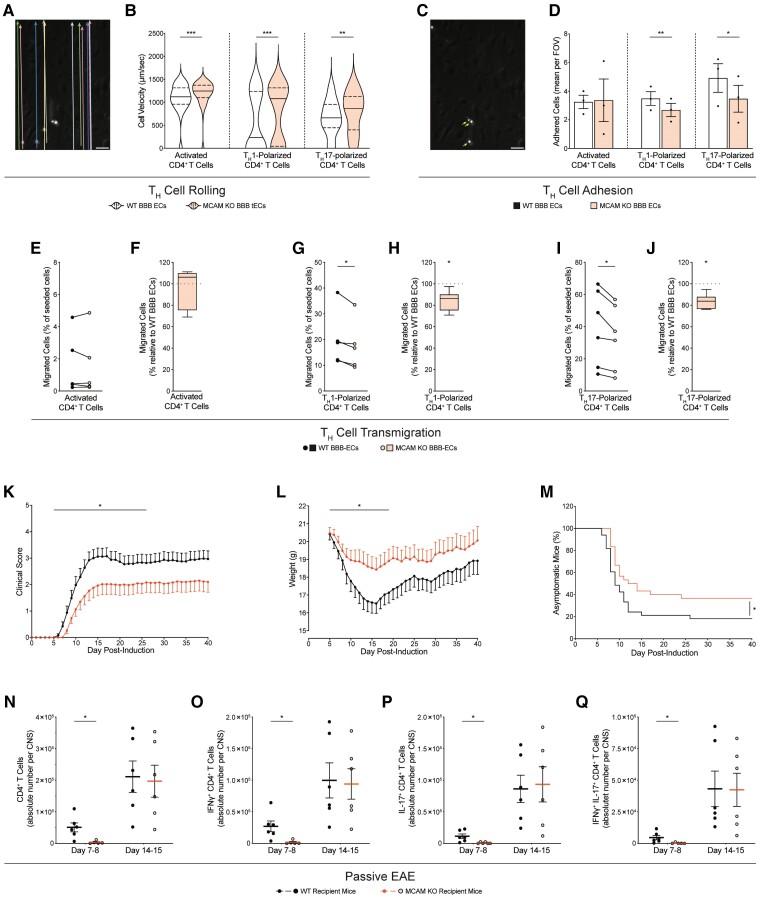
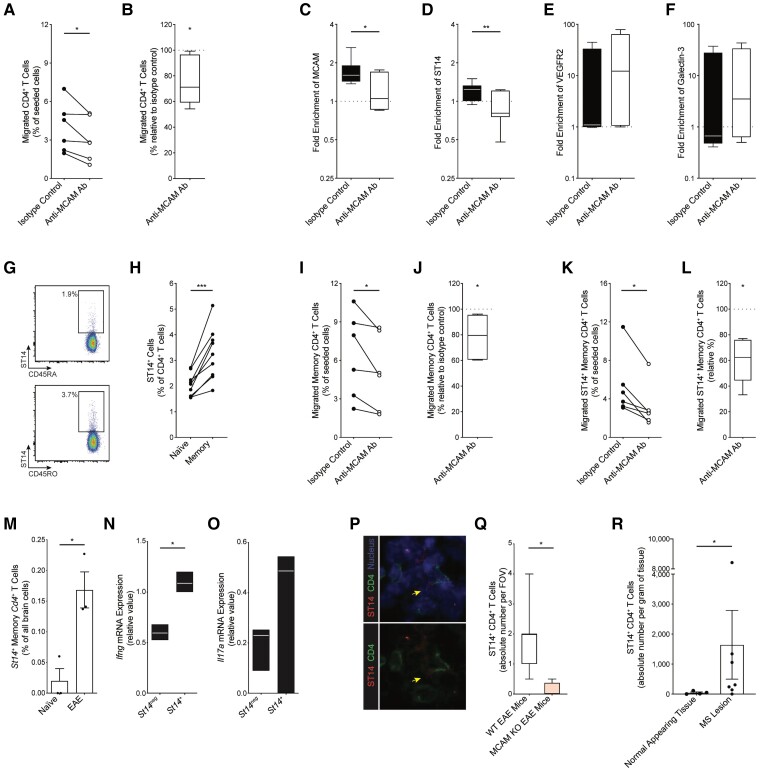
The trafficking of autoreactive leucocytes across the blood-brain barrier endothelium is a hallmark of multiple sclerosis pathogenesis. Although the blood-brain barrier endothelium represents one of the main CNS borders to interact with the infiltrating leucocytes, its exact contribution to neuroinflammation remains understudied. Here, we show that Mcam identifies inflammatory brain endothelial cells with pro-migratory transcriptomic signature during experimental autoimmune encephalomyelitis. In addition, MCAM was preferentially upregulated on blood-brain barrier endothelial cells in multiple sclerosis lesions in situ and at experimental autoimmune encephalomyelitis disease onset by molecular MRI. In vitro and in vivo, we demonstrate that MCAM on blood-brain barrier endothelial cells contributes to experimental autoimmune encephalomyelitis development by promoting the cellular trafficking of TH1 and TH17 lymphocytes across the blood-brain barrier. Last, we showcase ST14 as an immune ligand to brain endothelial MCAM, enriched on CD4+ T lymphocytes that cross the blood-brain barrier in vitro, in vivo and in multiple sclerosis lesions as detected by flow cytometry on rapid autopsy derived brain tissue from multiple sclerosis patients. Collectively, our findings reveal that MCAM is at the centre of a pathological pathway used by brain endothelial cells to recruit pathogenic CD4+ T lymphocyte from circulation early during neuroinflammation. The therapeutic targeting of this mechanism is a promising avenue to treat multiple sclerosis.

Keywords: BBB endothelial cells; CNS infiltration; MCAM; blood–brain barrier; experimental autoimmune encephalomyelitis; multiple sclerosis.


Conflict of interest statement

R.C., C.L., N.A. and A.P. are inventors on patents and patent applications related to MCAM modulation and uses thereof (CA2676962C, AU2009212789B2, US8293468B2 and US9017682B2). A.P. is an inventor on patents and patent applications related to DICAM-specific antibodies and uses thereof (US10428144B2, WO2016095046A1, EP3233919B1 and CA2971364A1). E.P. is currently an employee of Immunic AG and owns stock options of the parent company of Immunic AG.

Figures

Figure 1
Figure 1
Mcam expression in brain endothelial cells correlates with onset of neuroinflammation and is associated with a pro-migration gene signature. (AC) Analysis of bulk RNA sequencing dataset of peripheral and brain ECs. (A) Mcam mRNA expression [mean counts per million (CPM)] in ECs from lung, kidney, heart, liver and brain of naïve mice, projected on anatomical mouse sketch. (B) Mcam mRNA expression (mean CPM, min to max) in brain ECs from control mice injected with CFA and PTX and EAE mice at different disease stage. (C) Scatter plot showing the mean normalized expression of genes of immunoglobulin subtype at EAE disease onset and their log fold change at disease onset compared to control animals. (DJ) Analysis of single-cell RNA sequencing dataset of brain ECs in naïve and EAE mice. (D) Left and right bar charts show Mcam mRNA expression (mean read per cell ± SEM) in ECs and frequency of Mcam+ ECs (mean of total ECs ± SEM), respectively, in brains of naïve and EAE mice. (E) Violin plot (log2 fold change) and (F) GSEA of the DEGs in Mcam+ ECs in EAE; P < 0.05. (G) Distribution density (relative to 100% of cells per condition) along the arterovenous axis of brain ECs expressing markers of arterial, capillary and venous ECs (top), and Mcam in naïve and EAE mice (bottom). (H) Violin plot (log2 fold change) of the DEGs in Mcam+ brain capillary-to-venous ECs (relative to the remaining cells per condition). (I) Venn diagrams showing their overlap in naïve and EAE mice. (J) GSEA of the DEGs in Mcam+ brain capillary-to-venous ECs unique to EAE.
Figure 2
Figure 2
MCAM expression by BBB ECs is upregulated in multiple sclerosis lesions and by Inflammatory Stimuli. (AC) Immunofluorescence analysis of MCAM expression on BBB ECs; Adjacent to Active Lesion refers to the relatively NAWM found on the same tissue section as an active lesion; n = >5 patients with multiple sclerosis. (A) Representative images of multiple sclerosis brain tissue sections co-stained for MCAM, CD31 and nuclei and histologically classified by LFB/H&E and Oil Red O stainings; the histological characterization was performed on consecutive tissue sections from the same frozen tissue blocks. (B and C) Unbiased quantification of the signal intensity (mean relative value ± SEM) of (B) MCAM and (C) CD31 per cerebral blood vessel; n ≥ 18 blood vessel per condition; P by one-way ANOVA with Dunnett’s correction. (D) MCAM protein expression [mean fluorescence intensity (MFI) relative to untreated control ± SEM] on primary in vitro cultures of human BBB ECs after treatment with the specified conditions; ACM refers to astrocyte-conditioned media n ≥ 3 donors per condition; P by paired t-test after multiple testing correction using false discovery method; data were log transformed before statistical testing; # = 0.06.
Figure 3
Figure 3
Autoimmune neuroinflammation triggers the luminal presence of MCAM on cerebral blood vessels. (AC) Representative immunofluorescence analysis of the vascular localization of MCAM and CD31 in multiple sclerosis brain tissue sections co-stained for MCAM, CD31 and nuclei, and characterized histologically as (A) NAWM, (B) active lesion and (C) inactive lesion by LFB/H&E and Oil Red O stainings. (AC) Pixel intensity of each signal was measured across lines drawn to intercept the axis of each blood vessel. (D) Schematic representation, (E) representative images and (F) quantification of the presence (mean signal void per brain ± SEM) of MCAM on the luminal side of brain blood vessels, as measured by mMRI after injection of anti-MCAM antibody coated iron microbeads in mice with active EAE at different disease stages (presymptomatic, onset, peak) and in control mice (naïve, injected with CFA and PTX without MOG, EAE in MCAM KO); n = 3 mice per condition. (E) Yellow arrows indicate signal voids. (F) P by one-way ANOVA with Bonferroni correction.
Figure 4
Figure 4
MCAM on the BBB promotes the trafficking of TH1 and TH17 lymphocytes into the CNS and the development of EAE. (A) Representative image of the automated vectors used to unbiasedly track cell velocity, (B) quantification of cell velocity (mean μm/s ± SEM), (C) representative image of adhered cells (identified with arrows) and (D) quantification of adhesion [mean absolute number of adhered cells per field of view (FOV) ± SEM], of in vitro activated CD4+ T, Th1-polarized or Th17-polarized murine lymphocytes while dynamically flowing for 20 min over primary cultures of WT or MCAM KO BBB ECs. (AC) Representative of n = 3 independent experiments; P by Mann–Whitney test. (D) Pooled from n = 3 per group; P by paired t-test. (EJ) Migration of (EF) in vitro activated CD4+ T, (G and H) Th1-polarized and (I and J) Th17-polarized murine T lymphocytes, across primary cultures of WT or MCAM KO BBB ECs; pooled from n = 5–6 per group. (E, G and I) Absolute proportion (mean percentage of seeded cells ± SEM); P by paired t-test. (F, H and J) Normalized proportion (median percentage, min to max, relative to WT control); P by Wilcoxon signed-rank test. (KQ) Passive EAE in WT versus MCAM KO mice injected with in vitro polarized splenocytes from MOG35-55-immunized WT mice. (K) Disease development (clinical score ± SEM), (L) weights (g ± SEM) and (M) disease incidence (% of asymptomatic mice), as evaluated daily; pooled from n = 4 independent experiments with a total of 33 WT and 30 MCAM KO recipient animals. (K and L) P by Mann–Whitney test on area under the curve. (M) P by log rank test. (NQ) Quantification of CNS-infiltrating (N) total, (O) IFNγ+, (P) IL-17+ and (Q) double positive IFNγ+ IL-17+ CD4+ T lymphocytes (mean absolute number of cells per CNS ± SEM), at 7–8 and 14–15 days after EAE induction; pooled from n = 5–6 mice; P by Student’s t-test.
Figure 5
Figure 5
ST14+ CD4+ T cells preferentially migrate across inflamed MCAM+ BBB ECs and infiltrate the brain in EAE and multiple sclerosis. (A and B) Migration of human CD4+ T lymphocytes across primary cultures of human BBB ECs that were stimulated in vitro with IFNγ and TNFα and pretreated with isotype control or anti-MCAM antibody; n = 6 donors. (A) Absolute proportion (mean percentage, %, of seeded cells ± SEM); P by paired t-test. (B) Normalized proportion (median %, min to max, relative to isotype-treated control); P by Wilcoxon signed-rank test. (CF) Frequency ratio (mean expression ratio on migrated over non-migrated cells ± SEM) of (C) MCAM, (D) ST14, (E) VEGFR2 and (F) Galectin-3 in human CD4+ T lymphocytes, as measured by flow cytometry post-migration assay. (G) Representative density plots and (H) frequency (mean ± SEM) of ST14 protein expression on ex vivo naive CD45RA+ and memory CD45RO+ CD4+ T lymphocytes from healthy donors, as measured by flow cytometry; n = 9; P by paired t-test. (I–L) Migration of human (I and J) total and (K and L) ST14+ memory CD45RO+ CD4+ T lymphocytes across primary cultures of human BBB ECs that were stimulated in vitro with IFNγ and TNFα and pretreated with isotype control or anti-MCAM antibody; n = 6 donors. (I and K) Absolute proportion (mean % of seeded cells ± SEM); P by paired t-test. (J and L) Normalized proportion (median %, min to max, relative to isotype-treated control); P by Wilcoxon signed-rank test. (MO) Analysis of single-cell RNA sequencing dataset of brain cells in naïve and EAE mice (Fournier et al. 2022); n = 3 animals per condition. (M) Frequency (mean % of brain cells ± SEM) of St14+ memory Cd4+ T lymphocytes in naïve versus EAE mice; P by Student’s t-test. (N and O) Quantification (mean relative value, min to max) of Ifng and Il17a mRNA expression in St14+ versus St14neg memory Cd4+ T lymphocytes in the EAE brains; P by paired t-test. (P) Representative magnified image, and (Q) absolute number [median per field of view (FOV), min to max] of brain-infiltrating ST14+ CD4+ T cells at passive EAE disease onset, as evaluated by immunohistofluorescence staining of ST14, CD4 and nuclei on brain tissue sections from WT and MCAM KO recipient mice; n = 4; P by Student’s t-test. (R) Absolute number (mean per gram of tissue ± SEM) of ST14+ CD4+ T lymphocytes isolated from rapid autopsy multiple sclerosis normal appearing brain tissue or lesion, as measured by flow cytometry; n = 4–7 tissue samples from two donors; P by Student’s t-test.

Comment in

References

    1. Kuhlmann T, Ludwin S, Prat A, Antel J, Brück W, Lassmann H. An updated histological classification system for multiple sclerosis lesions. Acta Neuropathol. 2017;133:13–24. - PubMed
    1. Reich DS, Lucchinetti CF, Calabresi PA. Multiple sclerosis. N Engl J Med. 2018;378:169–180. - PMC - PubMed
    1. Daneman R, Prat A. The blood-brain barrier. Cold Spring Harb Perspect Biol. 2015;7:a020412. - PMC - PubMed
    1. Cramer SP, Simonsen H, Frederiksen JL, Rostrup E, Larsson HBW. Abnormal blood-brain barrier permeability in normal appearing white matter in multiple sclerosis investigated by MRI. Neuroimage Clin. 2014;4:182–189. - PMC - PubMed
    1. Miller DH, Leary SM. Primary-progressive multiple sclerosis. Lancet Neurol. 2007;6:903–912. - PubMed

Publication types

MeSH terms