. 2022 Nov 1;13(1):5926.
doi: 10.1038/s41467-022-33395-6.

Gut microbiome dysbiosis in antibiotic-treated COVID-19 patients is associated with microbial translocation and bacteremia

Collaborators, Affiliations

Gut microbiome dysbiosis in antibiotic-treated COVID-19 patients is associated with microbial translocation and bacteremia

Lucie Bernard-Raichon et al. Nat Commun. .

Abstract

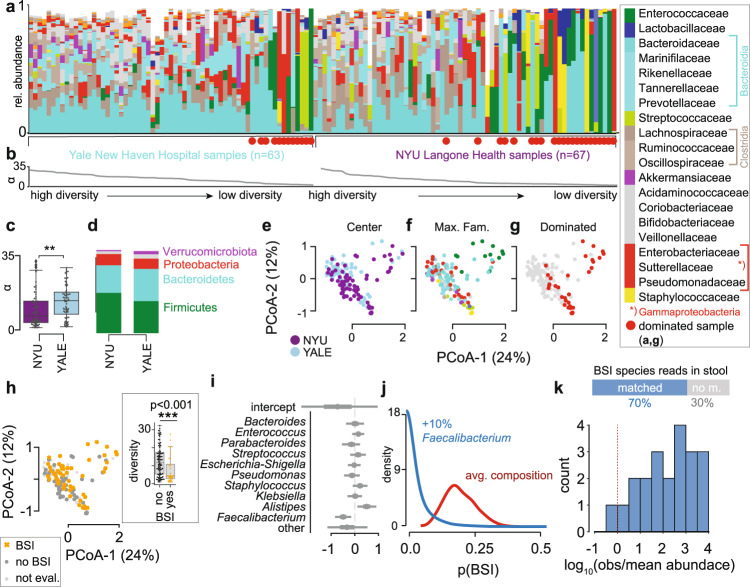
Although microbial populations in the gut microbiome are associated with COVID-19 severity, a causal impact on patient health has not been established. Here we provide evidence that gut microbiome dysbiosis is associated with translocation of bacteria into the blood during COVID-19, causing life-threatening secondary infections. We first demonstrate SARS-CoV-2 infection induces gut microbiome dysbiosis in mice, which correlated with alterations to Paneth cells and goblet cells, and markers of barrier permeability. Samples collected from 96 COVID-19 patients at two different clinical sites also revealed substantial gut microbiome dysbiosis, including blooms of opportunistic pathogenic bacterial genera known to include antimicrobial-resistant species. Analysis of blood culture results testing for secondary microbial bloodstream infections with paired microbiome data indicates that bacteria may translocate from the gut into the systemic circulation of COVID-19 patients. These results are consistent with a direct role for gut microbiome dysbiosis in enabling dangerous secondary infections during COVID-19.


Conflict of interest statement

K.C. has received research support from Pfizer, Takeda, Pacific Biosciences, Genentech, and Abbvie; consulted for or received an honoraria from Puretech Health, Genentech, and Abbvie; and is named as an inventor on U.S. patent 10,722,600 and provisional patents 62/935,035 and 63/157,225. J.S. is cofounder of Postbiotics Plus Research LLC. The remaining authors declare no competing interests.

Figures

Fig. 1
Fig. 1. SARS-CoV-2 infection causes gut microbiome alterations in mice.
K18-hACE2 mice were infected intranasally with 0 or 104 PFU of SARS-CoV-2. Fecal samples for microbiome analyses were collected daily from day 0 (before infection) until sacrifice; mice were sacrificed on days 5–7. Results show pooled data from three independent experiments with n = 3–5 mice per group. a Timelines of fecal microbiota composition measured by 16S rRNA gene sequencing. Bars represent the composition of the 15 most abundant bacterial families per sample for each day, blocks of samples correspond to an individual mouse’s time course from day 0 to day 6, as exemplified for the first mouse. b α-diversity (inverse Simpson index) per infection group in the beginning (tstart, n = 13 each for control and infected) and at the end (tend, n = 13 each for control and infected) of the experiment (n.s.: non-significant, **: p < 0.01, one-tailed, paired t-test; boxplots show median and quartile ranges). Comparison between infected and non-infected mouse microbiomes at the end of the experiment. c Principal coordinate plot of bacterial compositions in samples collected prior to infection (tstart, top) and at sacrifice (tend, bottom) of the experiment (Bray Curtis dissimilarity). d log10-relative family abundances at the final time point; boxplots show median and quartile ranges, whiskers extend to 1.5 times max- and min- quartile values, n.s.: not significant; *: p value < 0.05; **: p value < 0.01; ***: p value < 0.001; two-sided Wilcoxon rank-sum tests (n = 13 each for control and infected). e Analysis of microbiome composition trajectories in infected mice. Regression coefficients of the estimated changes in family abundances per day in mice infected with 104 PFU were obtained from linear mixed effects models with varying effects per mouse and per cage (only significant coefficient results shown, abbreviations and colors as per the bacterial family legend; Red: separate, analogous analysis for phylum Proteobacteria trajectories).
Fig. 2
Fig. 2. SARS-CoV-2 infection causes abnormalities in the gut epithelium of mice.
K18-hACE2 were inoculated intranasally with 104 PFU SARS-CoV-2 or mock treatment. a Representative H&E-stained section of the ileum depicting crypt-villus axes from mice at the end of the experiment. Green arrows indicate goblet cells, scale bars correspond to 25 μm. Bottom panels show high magnification images of the indicated crypt with black arrowheads pointing at Paneth cells, scale bars correspond to 10 μm. b Representative anti-lysozyme immunofluorescence images of the ileal crypt (two images per group). White and orange dotted circles delineate normal and abnormal Paneth cells, respectively. Abnormality is characterized by distorted, depleted, or diffuse lysozyme distribution patterns in Paneth cells. Lysozyme = red, DAPI = blue, scale bars correspond to 10 μm. c Quantification of goblet cell number per villus (left), Paneth cells per crypt (middle left) and ratio of goblet cell number / Paneth cell number (middle right) based on H&E staining, and frequency of normal versus abnormal Paneth cell lysozyme distribution pattern based on the immunofluorescence staining as depicted in b (right). Dots represent the mean cell number per crypt-villus unit in each mouse, 50 units were counted per mouse. Results were pooled from three independent experiments with n = 3–5 mice per group for each experiment (n = 8–14 control mice, 12–14 infected mice). Some mice were excluded from the analysis when quality of the slides was too poor. Boxplots indicate median and interquartile ranges (ns = non-significant, p < 0.05; **, p < 0.01; ***, p < 0.001; ****, p < 0.0001 two-sided Mann-Whitney U test). d Correlation of Goblet cell number per villus (left, two-sided Pearson correlation r = −0.48, p = 0.015), Paneth cells per crypt (middle, r = 0.14, p value = 0.483) and frequency of abnormal Paneth cell lysozyme distribution pattern (right, r = −0.5528, p = 0.014) for the mice shown in c with α-diversity (inverse Simpson) of the gut microbiome measured at the last day before sacrifice. e Correlation of Goblet cell number per villus (left, r = 0.63, p < 0.001), Paneth cells per crypt (middle, r = −0.29, p = 0.149) and frequency of abnormal Paneth cell lysozyme distribution pattern (right, r = 0.65, p value = 0.003) for the mice shown in c with log10-relative abundances of Akkermansia in fecal samples from the last day before sacrifice; lines: univariate linear regression, shaded region: 95% CI.
Fig. 3
Fig. 3. The dysbiotic gut microbiome in COVID-19 in patients from NYU Langone Health (n = 60) and Yale New Haven Hospital (n = 36) is associated with secondary bloodstream infections.
a Bacterial family composition in stool samples (Yale, n = 63 samples; NYU, n = 67) identified by 16S rRNA gene sequencing; bars represent the relative abundances of bacterial families; red circles indicate samples with single taxa >50%. Samples are sorted by center and bacterial α-diversity (inverse Simpson index, b). c α-diversity in samples from NYU Langone Health and Yale New Haven Hospital; p = 0.0065, two-sided T-test. d Average phylum level composition per center. Principal coordinate plots of all samples shown in a, labeled by center (e), most abundant bacterial family (f) and domination status of the sample (g), and BSI status; inset: boxplot of inverse Simpson index diversity by BSI (h). i Coefficients from a Bayesian logistic regression with most abundant bacterial genera as predictors of BSI status (circle: posterior mean, lines: 95% HDI). j Counterfactual posterior predictions of BSI risk based on bacterial composition contrasting the predicted risk of the average composition across all samples (red) with the risk predicted from a composition where Faecalibacterium was increased by 10% (blue). k Shotgun metagenomic reads matched the species identified in clinical blood cultures in 70% of all investigated cases; the histogram shows the distribution of log10-ratios of relative abundances of matched species in corresponding stool samples to their corresponding mean abundances across all samples.

Update of

References

    1. Fajgenbaum DC, June CH. Cytokine storm. N. Engl. J. Med. 2020;383:2255–2273. doi: 10.1056/NEJMra2026131. - DOI - PMC - PubMed
    1. Lucas C, et al. Longitudinal analyses reveal immunological misfiring in severe COVID-19. Nature. 2020;584:463–469. doi: 10.1038/s41586-020-2588-y. - DOI - PMC - PubMed
    1. Zuo T, et al. Alterations in gut microbiota of patients with COVID-19 during time of hospitalization. Gastroenterology. 2020;159:944–955.e8. doi: 10.1053/j.gastro.2020.05.048. - DOI - PMC - PubMed
    1. Yeoh YK, et al. Gut microbiota composition reflects disease severity and dysfunctional immune responses in patients with COVID-19. Gut. 2021;70:698–706. doi: 10.1136/gutjnl-2020-323020. - DOI - PMC - PubMed
    1. Gu S, et al. Alterations of the gut microbiota in patients with coronavirus disease 2019 or H1N1 influenza. Clin. Infect. Dis. 2020;71:2669–2678. doi: 10.1093/cid/ciaa709. - DOI - PMC - PubMed

Publication types

Substances