. 2022 Nov 1;13(1):6529.
doi: 10.1038/s41467-022-34051-9.

Unsupervised learning of aging principles from longitudinal data

Affiliations

Unsupervised learning of aging principles from longitudinal data

Konstantin Avchaciov et al. Nat Commun. .

Abstract

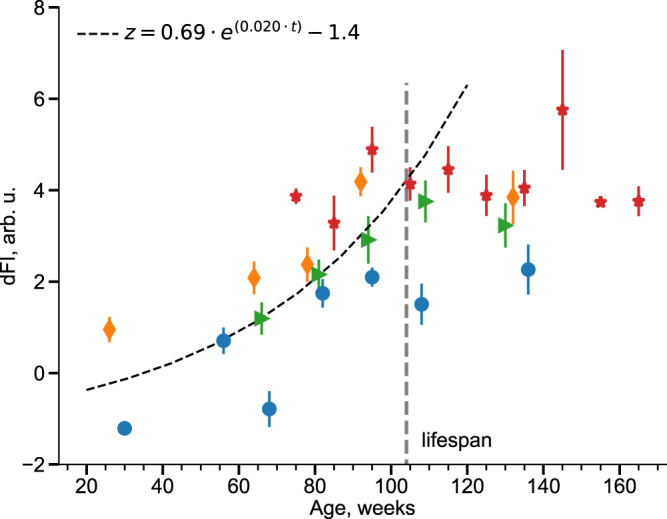
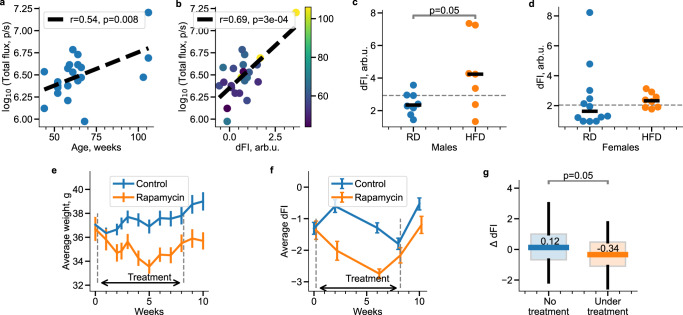
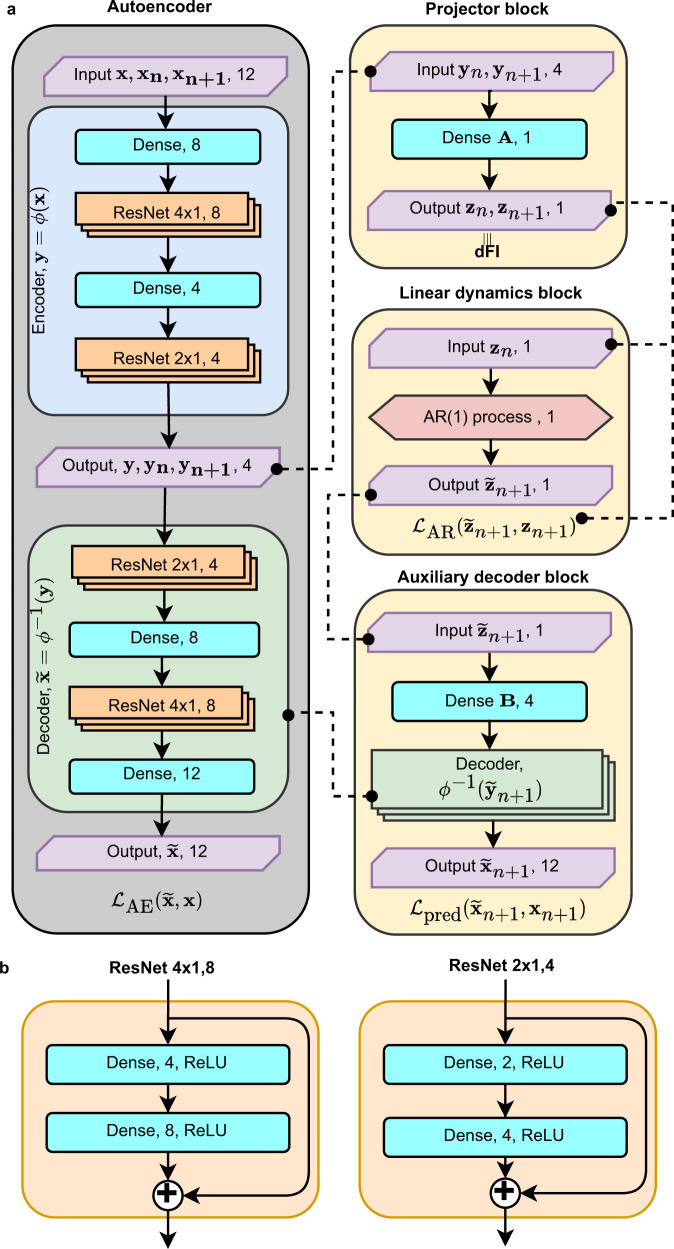
Age is the leading risk factor for prevalent diseases and death. However, the relation between age-related physiological changes and lifespan is poorly understood. We combined analytical and machine learning tools to describe the aging process in large sets of longitudinal measurements. Assuming that aging results from a dynamic instability of the organism state, we designed a deep artificial neural network, including auto-encoder and auto-regression (AR) components. The AR model tied the dynamics of physiological state with the stochastic evolution of a single variable, the "dynamic frailty indicator" (dFI). In a subset of blood tests from the Mouse Phenome Database, dFI increased exponentially and predicted the remaining lifespan. The observation of the limiting dFI was consistent with the late-life mortality deceleration. dFI changed along with hallmarks of aging, including frailty index, molecular markers of inflammation, senescent cell accumulation, and responded to life-shortening (high-fat diet) and life-extending (rapamycin) treatments.


Conflict of interest statement

P.O.F is a shareholder of Gero PTE. LTD. A.V.G. is a member of Gero PTE. LTD. Advisory Board. K.A., A.E.T., L.I.M., O.B., and P.O.F. are employees of Gero PTE. LTD. A.V.G. is co-founder and shareholder of Genome Protection. E.I.A. is employee of Genome Protection. M.P.A. has no competing interests. The study was funded by Gero PTE. LTD.

Figures

Fig. 1
Fig. 1. Hierarchical clustering and Principal Component (PC) Analysis of complete blood count (CBC) measurements from The Mouse Phenome Database.
a Clustering of CBC features and PC scores in the training dataset. The colors represent Pearson’s correlation coefficient (absolute value) as indicated by the scale on the right. b The graphs represent the average of the PC scores in subsequent age groups (the error bars are standard deviations). The inset shows that the variance for all PC scores increases with age. Two-sided p values were calculated for the Pearson correlation coefficient in the sample size of n = 1448 animals.
Fig. 2
Fig. 2. Auto-correlation property of the dynamic frailty indicator (dFI).
Correlation between age-adjusted dFI values across sampling intervals Δt of 14 (blue circles, animals n = 40) and 28 (orange squares, animals n = 19) weeks in the validation MA0072 dataset. Two-sided p values were calculated for the Pearson correlation coefficient.
Fig. 3
Fig. 3. The dynamic frailty indicator (dFI) as a function of age.
The dependence of the dFI from age in the validation datasets from the experiments: MA0071 (males, orange diamonds), MA0071 (females, blue circles), and MA0072 (green triangles). The black dashed line is the exponential fit in the age groups younger than the average lifespan of NIH Swiss mice (indicated by the vertical grey dashed line). Red stars mark the average dFI in age-matched groups of frail animals from the MA0073 cohort. All data are presented as Mean ± SEM.
Fig. 4
Fig. 4. Late-life mortality deceleration in mice.
a The Kaplan-Meier survival curve (solid blue line) in female mice cohorts from ref. . The orange dashed line represent the best Gompertz fits. b The Nelson–Aalen estimator of total mortality (solid blue line) and the 95% confidence intervals are filled in blue. The grey dashed line corresponds to the mortality level according to the theoretical prediction M(tt¯)=α.
Fig. 5
Fig. 5. Correlation of dFI with other biomarkers of aging.
a Correlation between the dFI and the physiological frailty index (PFI). Colors represent animals from the test dataset, where blue, orange and green circles are females in MA0071, males in MA0071 and males in MA0072, respectively. b Volcano plot representation of the dFI correlation with the extended set of biomarkers in the test datasets MA0071 and MA0072. Features with correlation above and below significance level p < 0.001 are shown with grey and blue circles, respectively. The most significant correlations (excluded dFI components) were between dFI and C-reactive protein (CRP), red cell distribution width (RDW), body weight (BW), and murine chemokine CXCL1 (KC). Two-sided p values were calculated for the Pearson correlation coefficient and the sample size of n = 282 animals.
Fig. 6
Fig. 6. dFI is associated with senescent cells burden and responds to lifespan modulating interventions.
Total flux (TF) in log scale represents p16-dependent luciferase reporter activity, is a quantitative indicator of senescent cells burden, and shows statistically significant correlations with age (Pearson’s r = 0.54, two-sided p = 0.008, n = 23 animals) (a) and with dFI (Pearson’s r = 0.69, two-sided p = 0.0003, n = 23 animals) (b) in old mice (>50 weeks). The colorbar in b represents animal age in weeks. dFI responds to the lifespan-modifying effect of high-fat diet (HFD): the dFI values (dots) were obtained late in life (at week 78) for male (c) and female (d) mice fed with RD or HFD. The horizontal bar and the dashed lines indicate the mean values in the groups and for all animals, respectively. dFI was significantly higher in males with HFD (n = 7 animals) vs RD (two-sided p = 0.05, Student’s t test, n = 8 animals), but there was no significant difference between HFD (n = 8 animals) and RD (n = 12 animals) groups of female mice. The dFI measurements are consistent with life-shortening and neutral effects of HFD in males and female animals in the same experiment, as reported in ref. . Effects of 8 week-long rapamycin treatment on body weight and dFI. Body weight (e) and dFI (f) were measured every 1 and 2 weeks, respectively. All the data are presented as the mean ± SEM (n = 48 and n = 12 mice in control and rapamycin groups, respectively). g The statistics of the dFI increments in pairs of consecutive measurements are different by the presence or the absence of the treatment (the blue box, including both the control and rapamycin-treated group after cessation of the treatment, n = 204 animals, vs. the treated group, the orange box, n = 36 animals). Boxplots indicate median, 25th and 75th percentiles, whiskers indicate 5th and 95th percentiles. The dFI increments between the subsequent measurements were significantly lower under treatment (p = 0.05, Student’s two-tailed t test), thus suggesting lifespan increasing effects of rapamycin.
Fig. 7
Fig. 7. The schematic representation of the network architecture used to train dFI.
a The network includes of nonlinear auto-encoder (AE) and the auto-regression model (AR), the linear projector, and the decoder blocks. The output of the projector block was designated as dFI. b Schematic representations of the residual network (ResNet) blocks.

References

    1. Horvath S. DNA methylation age of human tissues and cell types. Genome Biol. 2013;14:R115. doi: 10.1186/gb-2013-14-10-r115. - DOI - PMC - PubMed
    1. Levine ME, et al. An epigenetic biomarker of aging for lifespan and healthspan. Aging. 2018;10:573. doi: 10.18632/aging.101414. - DOI - PMC - PubMed
    1. Antoch MP, et al. Physiological frailty index (pfi): quantitative in-life estimate of individual biological age in mice. Aging. 2017;9:615. doi: 10.18632/aging.101206. - DOI - PMC - PubMed
    1. Putin E, et al. Deep biomarkers of human aging: application of deep neural networks to biomarker development. Aging. 2016;8:1021. doi: 10.18632/aging.100968. - DOI - PMC - PubMed
    1. Pyrkov, T. V. et al. Longitudinal analysis of blood markers reveals progressive loss of resilience and predicts ultimate limit of human lifespan. Nat. Commun.12, 2765 (2019). - PMC - PubMed

Publication types