Biophysical analysis of gelatin and PLGA nanoparticle interactions with complex biomimetic lung surfactant models
- PMID: 36320247
- PMCID: PMC9523518
- DOI: 10.1039/d2ra02859j
Biophysical analysis of gelatin and PLGA nanoparticle interactions with complex biomimetic lung surfactant models
Abstract
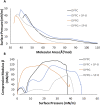
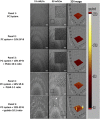
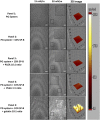
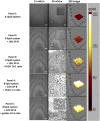
Biocompatible materials are increasingly used for pulmonary drug delivery, and it is essential to understand their potential impact on the respiratory system, notably their effect on lung surfactant, a monolayer of lipids and proteins, responsible for preventing alveolar collapse during breathing cycles. We have developed a complex mimic of lung surfactant composed of eight lipids mixed in ratios reported for native lung surfactant. A synthetic peptide based on surfactant protein B was added to better mimic the biological system. This model was used to evaluate the impact of biocompatible gelatin and poly(lactic-co-glycolic acid) nanoparticles. Surface pressure-area isotherms were used to assess lipid packing, film compressibility and stability, whereas the lateral organization was visualized by Brewster angle microscopy. Nanoparticles increased film fluidity and altered the monolayer collapse pressure. Bright protruding clusters formed in their presence indicate a significant impact on the lateral organization of the surfactant film. Altogether, this work indicates that biocompatible materials considered to be safe for drug delivery still need to be assessed for their potential detrimental impact before use in therapeutic applications.
This journal is © The Royal Society of Chemistry.
Conflict of interest statement
The authors declare that they have no conflicts of interest with the contents of this article.
Figures


Similar articles
-
Differential interactions of gelatin nanoparticles with the major lipids of model lung surfactant: changes in the lateral membrane organization.J Phys Chem B. 2015 Apr 30;119(17):5356-66. doi: 10.1021/jp5122239. Epub 2015 Apr 17. J Phys Chem B. 2015. PMID: 25844805
-
Vaping additives negatively impact the stability and lateral film organization of lung surfactant model systems.Nanomedicine (Lond). 2022 May;17(12):827-843. doi: 10.2217/nnm-2021-0398. Epub 2022 Apr 19. Nanomedicine (Lond). 2022. PMID: 35437998
-
The effect of repeated lateral compression and expansions mimicking blinking on selected tear film polar lipid monofilms.Biochim Biophys Acta Biomembr. 2017 Mar;1859(3):319-330. doi: 10.1016/j.bbamem.2016.12.010. Epub 2016 Dec 16. Biochim Biophys Acta Biomembr. 2017. PMID: 27993563
-
Computer simulations of lung surfactant.Biochim Biophys Acta. 2016 Oct;1858(10):2431-2440. doi: 10.1016/j.bbamem.2016.02.030. Epub 2016 Feb 27. Biochim Biophys Acta. 2016. PMID: 26922885 Review.
-
Pulmonary Surfactant: A Unique Biomaterial with Life-saving Therapeutic Applications.Curr Med Chem. 2022;29(3):526-590. doi: 10.2174/0929867328666210825110421. Curr Med Chem. 2022. PMID: 34525915 Review.
Cited by
-
Gelatin/Poly (Lactic-Co-Glycolic Acid)/Attapulgite Composite Scaffold Equipped with Teriparatide Microspheres for Osteogenesis in vitro and in vivo.Int J Nanomedicine. 2025 Jan 13;20:581-604. doi: 10.2147/IJN.S495204. eCollection 2025. Int J Nanomedicine. 2025. PMID: 39839456 Free PMC article.
References
LinkOut - more resources
Full Text Sources

