Review
. 2022 Sep 13;13(37):11009-11029.
doi: 10.1039/d2sc02981b. eCollection 2022 Sep 28.

Emerging nanosensor platforms and machine learning strategies toward rapid, point-of-need small-molecule metabolite detection and monitoring

Affiliations
Review

Emerging nanosensor platforms and machine learning strategies toward rapid, point-of-need small-molecule metabolite detection and monitoring

Shi Xuan Leong et al. Chem Sci. .

Abstract

Speedy, point-of-need detection and monitoring of small-molecule metabolites are vital across diverse applications ranging from biomedicine to agri-food and environmental surveillance. Nanomaterial-based sensor (nanosensor) platforms are rapidly emerging as excellent candidates for versatile and ultrasensitive detection owing to their highly configurable optical, electrical and electrochemical properties, fast readout, as well as portability and ease of use. To translate nanosensor technologies for real-world applications, key challenges to overcome include ultralow analyte concentration down to ppb or nM levels, complex sample matrices with numerous interfering species, difficulty in differentiating isomers and structural analogues, as well as complex, multidimensional datasets of high sample variability. In this Perspective, we focus on contemporary and emerging strategies to address the aforementioned challenges and enhance nanosensor detection performance in terms of sensitivity, selectivity and multiplexing capability. We outline 3 main concepts: (1) customization of designer nanosensor platform configurations via chemical- and physical-based modification strategies, (2) development of hybrid techniques including multimodal and hyphenated techniques, and (3) synergistic use of machine learning such as clustering, classification and regression algorithms for data exploration and predictions. These concepts can be further integrated as multifaceted strategies to further boost nanosensor performances. Finally, we present a critical outlook that explores future opportunities toward the design of next-generation nanosensor platforms for rapid, point-of-need detection of various small-molecule metabolites.


Conflict of interest statement

The authors declare no competing interests.

Figures

Fig. 1
Fig. 1. Current and emerging research strategies to enhance sensitivity and selectivity, achieve multiplex detection capabilities and facilitate analysis of complex, high-dimensional datasets for small-molecule metabolite detection using various nanosensor platforms across diverse applications. They are broadly categorized into (1) customization of platform modifications and designer platform configurations, (2) development of hybrid techniques involving two or more analytical techniques, and (3) complementary use of machine learning algorithms. Adapted and reprinted with permission from ref. .
Fig. 2
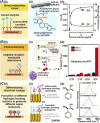
Fig. 2. Chemical analyte capturing strategies. (A) (i) Use of chemical interactions to bring metabolites close to nanosensor for enhanced signals. (ii) Depiction of effective capture and detection of pathogen-induced polyphenol secretion by soybean (Glycine max) culture using polyethylene glycol-phospholipid single-walled carbon nanotube (PEG-PL-SWCNT)-based fluorescent sensors via hydrogen bonding. (iii) Nanosensor response against purified polyphenol extract from Tococa spp., showing a decrease in NIR fluorescence and concurrent redshift of emission wavelengths (mean ± SD, n = 3, colored line = hyperbolic fit). (B) (i) Achieving chemoselectivity via targeted receptor-metabolite chemical interactions. (ii) Schematic illustration of UV light-activatable ATP sensing mechanism of the nanosensor, whereby ATP selectively hybridizes to the aptamer, likely via multivalent H bonding. (iii) Response of aptamer-modified upconversion nanoparticles to 5 mM of different nucleoside triphosphates with and without 365 nm light irradiation, showing selective fluorescence only in the presence of ATP. (C) (i) Differentiation of structural analogs via formation of different hydrogen bonding systems. (ii) Pictorial representation of proposed differentiation mechanisms. (iii) Different 4-mercaptophenylboronic acid (MPBA) SERS spectra in the 1540–1620 cm−1 region in the presence of d- and l-mandelic acid. Reprinted and adapted with permission from (A) ref. , (B) ref. and (C) ref. . Copyright 2020 Wiley-VCH. Copyright 2021 R. Niβler, A.T. Müller, F. Dohrman. Angew. Chem., Int. Ed. Published by Wiley-VCH GmbH. Copyright 2017 American Chemical Society.
Fig. 3
Fig. 3. Physical confinement strategies and multifunctional platforms synergizing both chemical and physical-based strategies. (A) (i) Schematic illustration of the analyte concentrating effect on superhydrophobic (SPHB) platforms. (ii) Sensitive detection of pregnane at sub-nanomolar concentrations (ppt levels) on SPHB SERS substrate using 4-mercaptophenylboronic acid (MPBA)-functionalized Ag nanocubes. Corresponding structures for MPBA-pregnane and MPBA-tetrahydrocortisone, another urine biomarker, are included. (B) (i) Schematic illustration of the key advantages in physically modifying nanosensors with sorbent porous frameworks. (ii) Resistance changes (where Ra and Rg are the resistances in the absence and presence of the target gas) to 50 ppm of H2, C6H6, C7H8, C2H5OH and CH3COCH3 gases at 200 °C using bare ZnO, Pd/ZnO and ZIF-8 coated Pd/ZnO nanowires. (C) (i) Illustration of selective confinement and enrichment by synergizing chemical and physical modification strategies. (ii) Relative intensities of 1623 cm−1 peak indexed to imine CN stretching of the cross-linked product when exposed to different functional groups, illustrating the selectivity of gold superparticles coated with ZIF-8 (GSP@ZIF-8). The schematic representation of GSP@ZIF-8 and the selective Schiff-base reaction between ATP and aldehydes is included as inset. Reprinted and adapted with permission from (A) ref. , (B) ref. . (C) ref. . Copyright 2017 Wiley-VCH. Copyright 2018, 2020 American Chemical Society.
Fig. 4
Fig. 4. Array-based techniques for differentiation of complex metabolites mixtures. (A) Schematic depiction of high-dimensional pattern fingerprints generated from array-based configurations. (B) (i) Illustration of chemiresistive nanoarray for COVID-19 detection comprising of 8 sensor elements. (ii) Representative response of one sensor in a chemiresistive array to three different breath samples: infected COVID-19 patient A; recovered COVID-19 patient A; and a healthy control. Each unit represents one sensor cycle. (C)(i) Representative SERS spectra of each probe (MBA: 4-mercaptobenzoic acid, MPY: 4-mercaptopyridine, ATP: 4-aminothiophenol) in the presence of COVID-positive and COVID-negative breath samples. A total of 74 COVID-positive (31 asymptomatic) and 427 COVID-negative samples are measured. Schematic of multiprobe SERS-based sensor is included as inset. (ii) Multiprobe Ag nanocube platform demonstrates enhanced classification sensitivity and specificity for COVID-19 infection status. (D) Color difference maps of 18 representative volatile organic compound vapors using paper-based optoelectronic noses (OENs) fabricated from gold and nanoparticles modified with 8 different capping agents. Reprinted and adapted with permission from (B) ref. , (C) ref. and (D) ref. . Copyright 2019, 2020, 2022 American Chemical Society.
Fig. 5
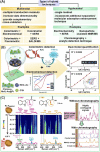
Fig. 5. Hybrid techniques combining two or more analytical methods. (A) Schematic summary of different types of hybrid techniques, including multimodal and hyphenated techniques. SERS: surface-enhanced Raman scattering; SALDI/MS: surface-assisted laser desorption/ionization-mass spectrometry; NMR: nuclear magnetic resonance. (B) Schematic illustration of dual-modal colorimetric-electrochemical nanosensor platform for detection of ochratoxin A (OTA) using a sandwiched complex of chitosan-functionalized MoS2–Au@Pt and Au NP-supported MnO2 nanoflowers respectively labelled with aptamers (left), and corresponding quantification models for cross-validation (right). (C) Electrochemical-SERS differentiation of l- and d-tryptophan (TRP), where the enantiomers exhibited identical spectra without Vapplied and showcased differential spectral changes at Vapplied = −0.6 V. (D) Schematic illustration of coupling paper chromatography for analyte separation prior to SERS measurements to obtain distinct SERS fingerprints, using a mixture of 4 organic dyes as a proof-of-concept. Reprinted and adapted with permission from (B) ref. , (C) ref. and (D) ref. . Copyright 2021 Elsevier B.V. Copyright 2018, 2021 American Chemical Society.
Fig. 6
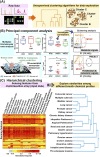
Fig. 6. Application of unsupervised machine learning algorithms. (A) Workflow schematic which describes the use of unsupervised machine learning (ML) algorithms to uncover hidden interrelationships or construct prediction models for metabolite identification and/or quantification. (B) Application of principal component analysis (PCA) in conjunction with multiplex metabolite and proliferation-metastatic biomolecular cue signal analysis e.g. glucose, pyruvate and phenylalanine to investigate the prediction of metastasis onset using SERS. SERS spectra of metastatic (MCSC), premetastatic (PMCSC) and nonmetastatic (NMCSC) cancer stem-like cells from a highly metastatic cancer phenotype obtained on a 3D-assembled nanoprobe metasensor are used as input data. (C) Application of hierarchical clustering to explore the similarities in sensor response profiles (and thus breath profiles) among subjects suffering from 17 different diseases. 59 numerical sensing features obtained from multi-sensor nanoarray exposed to different breath samples, namely relative change of sensor's resistance at the beginning, middle and end of breath exposure, and the area under the curve for each sensor element, are used as input data. Reprinted and adapted with permission from (B) ref. and (C) ref. . Copyright 2016, 2021 American Chemical Society.
Fig. 7
Fig. 7. Application of supervised machine learning algorithms. (A) Workflow schematic which describes the use of supervised machine learning (ML) algorithms to construct prediction models for metabolite identification and/or quantification. (B) (left) Construction of a partial least-squares (PLS) regression model for multiplex quantification of pregnane % (relative pregnane/tetrahydrocortisone ratio) by mixing various pregnane % (at 10−10 M) using nonpregnant women's urine samples. Predicted pregnane % from 20 ongoing pregnancy (blue) and 20 spontaneous miscarriage (pink) urine samples are included. (right) Comparison of relative pregnane % measured from the surface-enhanced Raman scattering (SERS) nanosensor against liquid chromatography-mass spectrometry (LC-MS) analyses for the aforementioned ongoing pregnancy (S1–S20) and miscarriage (M1–M20) samples. The brief workflow from urine sample preparation to SERS measurement is included as an inset. (C) ML-driven SERS optophysiology to reveal multiplexed metabolite gradients near healthy and cancerous cells. SERS spectra acquired from 7 pure aqueous metabolite solutions, or the CO2-independent cell culture medium (background) were obtained, randomly separated into 60/20/20% train/test/validation sets for model training with a 1D convolutional neural network. Only representative SERS spectra are shown. The model was used to predict the metabolite counts near living cells, where those of ATP, ADP, glutamine and urea were shown for cancerous HeLa cells. Reprinted and adapted with permission from (B) ref. and (C) ref. . Copyright 2019, 2020 American Chemical Society.

Similar articles

Cited by

References

    1. Lamichhane S., Sen P., Dickens A. M., Hyötyläinen T. and Orešič M., in Comprehensive Analytical Chemistry, ed. J. Jaumot, C. Bedia and R. Tauler, Elsevier, 2018, vol. 82, pp. 387–413
    1. Ramirez T. Daneshian M. Kamp H. Bois F. Y. Clench M. R. Coen M. Donley B. Fischer S. M. Ekman D. R. Fabian E. Guillou C. Heuer J. Hogberg H. T. Jungnickel H. Keun H. C. Krennrich G. Krupp E. Luch A. Noor F. Peter E. Riefke B. Seymour M. Skinner N. Smirnova L. Verheij E. Wagner S. Hartung T. van Ravenzwaay B. Leist M. ALTEX. 2013;30:209–225. - PMC - PubMed
    1. Beger R. D. Schmidt M. A. Kaddurah-Daouk R. Metabolites. 2020;10:129. - PMC - PubMed
    1. Jia Z. Patra A. Kutty V. K. Venkatesan T. Metabolites. 2019;9:52. - PMC - PubMed
    1. Deng L. Ismond K. Liu Z. Constable J. Wang H. Alatise O. I. Weiser M. R. Kingham T. P. Chang D. Cancer Epidemiol., Biomarkers Prev. 2019;28:1283–1291. - PMC - PubMed