. 2022 Oct 3;13(40):11863-11868.
doi: 10.1039/d2sc04271a. eCollection 2022 Oct 19.

H-bond cooperativity: polarisation effects on secondary amides

Affiliations

H-bond cooperativity: polarisation effects on secondary amides

Daniil O Soloviev et al. Chem Sci. .

Abstract

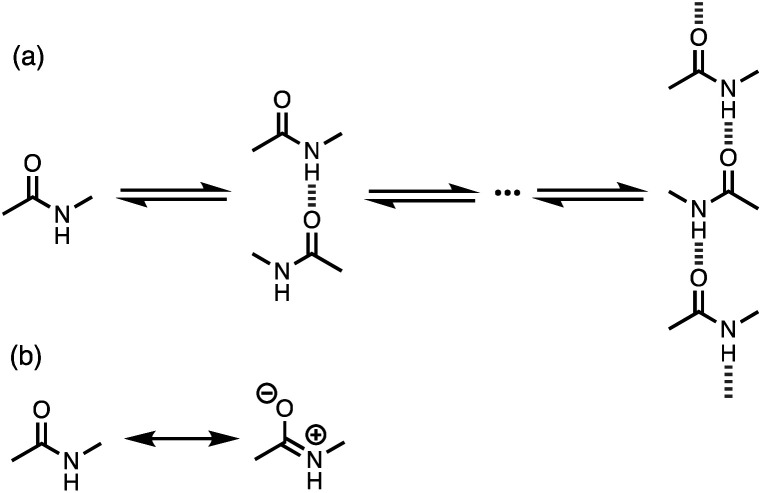
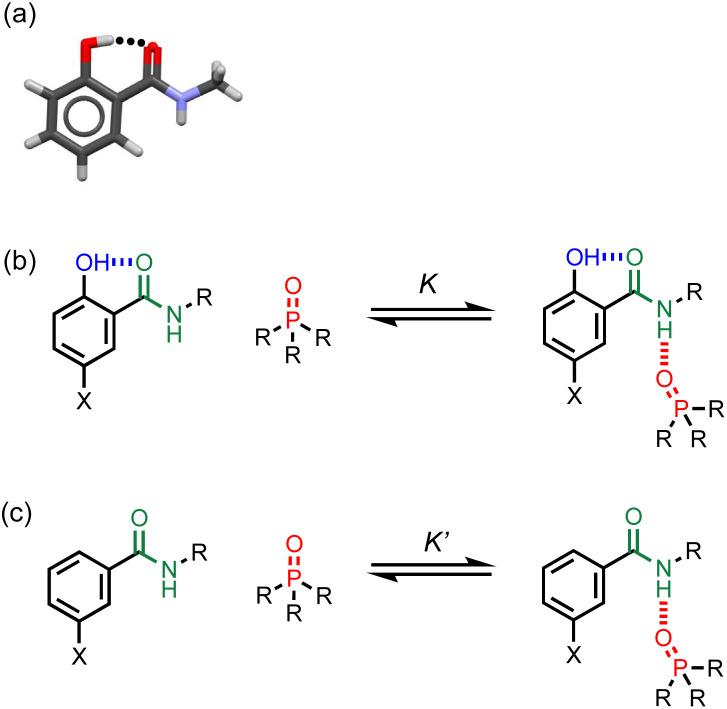
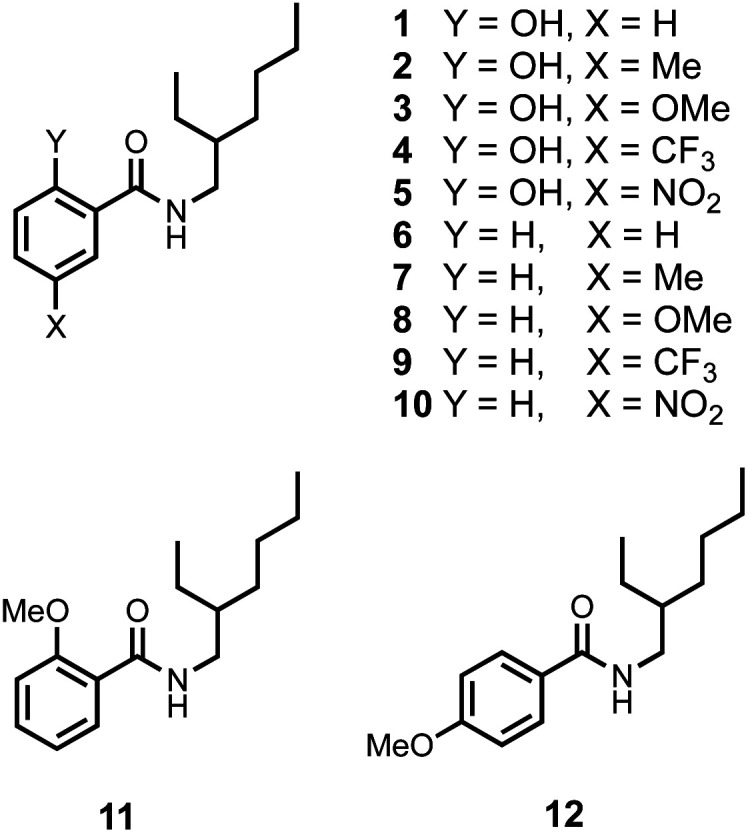
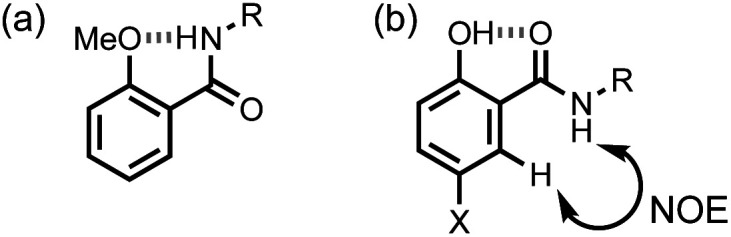
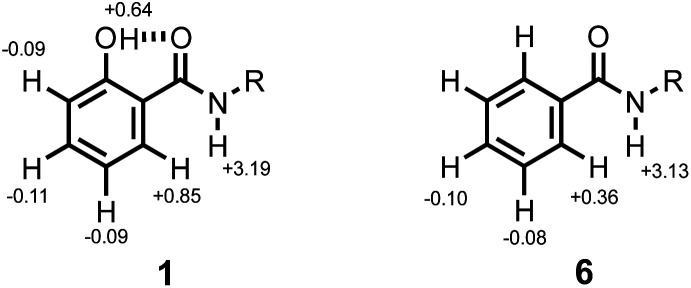
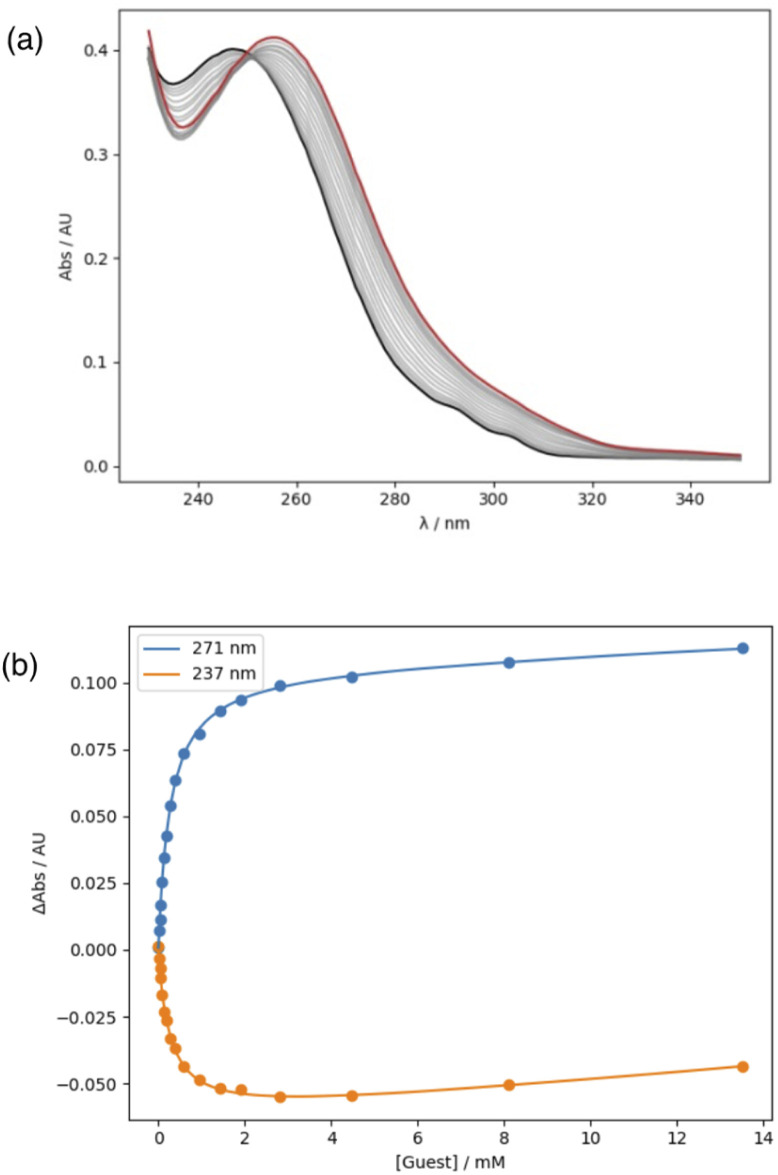
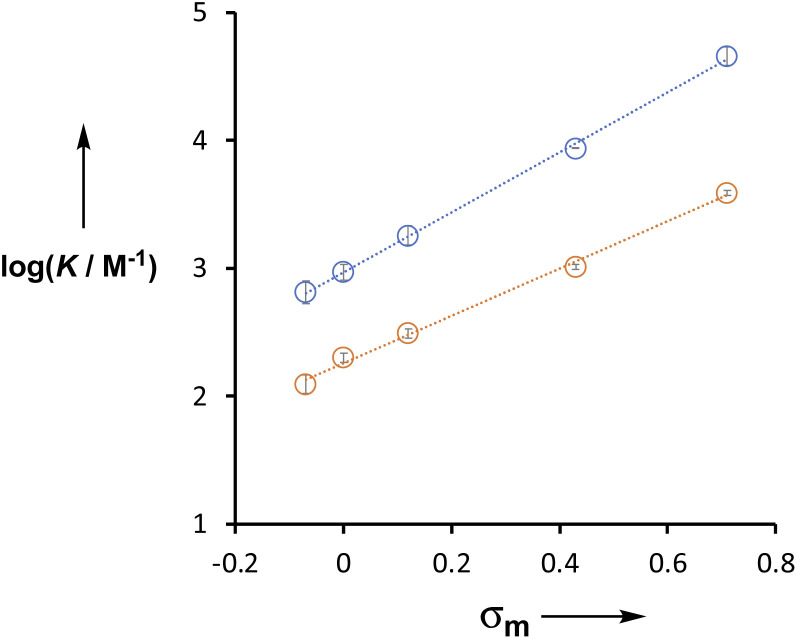
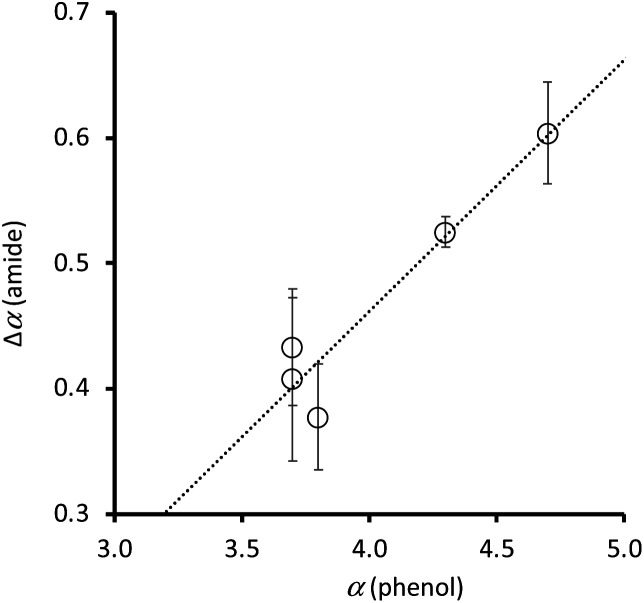
Formation of a H-bond with an amide carbonyl oxygen atom increases the strength of subsequent H-bonds formed by the amide NH, due to polarisation of the bond. The magnitude of this effect has been quantified by measuring association constants for the formation of 1 : 1 complexes of 2-hydroxylbenzamides with tri-n-butyl phosphine oxide. In 2-hydroxybenzamides, there is an intramolecular H-bond between the phenol OH group and the carbonyl oxygen atom. Comparison of the association constants measured for compounds with and without the 2-hydroxy group allows direct quantification of the effect of the intramolecular H-bond on the H-bond donor properties of the amide NH group. Substituents were used to modulate the strength of the intramolecular and intermolecular H-bonds. The presence of an intramolecular H-bond increases the strength of the intermolecular H-bond by more than one order of magnitude in n-octane solution. The increase in the H-bond donor parameter used to describe the amide NH group is directly proportional to the H-bond donor parameter of the phenol OH group that makes the intramolecular H-bond. These polarisation effects will lead to substantial cooperativity in complex systems that feature networks of non-covalent interactions, and the measurements described here provide a quantitative basis for understanding such phenomena.


Conflict of interest statement

There are no conflicts to declare.

Figures

Fig. 1
Fig. 1. (a) Supramolecular polymerisation of secondary amides. (b) Neutral and zwitterionic amide resonance structures.
Fig. 2
Fig. 2. (a) X-ray crystal structure showing the intramolecular phenol-amide H-bond when X = H and R = Me (CSD ref code KUSVUP). (b) Interaction of a H-bonded amide with a phosphine oxide. (c) Reference interaction of a non-H-bonded amide with a phosphine oxide. X is a substituent that modulates the H-bond donor properties of the phenol, and R is a solubilising group.
Fig. 3
Fig. 3. Chemical structures of compounds 1–12.
Fig. 4
Fig. 4. (a) Intramolecular H-bond in compound 11. (b) Cross peak observed in the NOESY spectrum of compound 5 in deuterochloroform at 298 K.
Fig. 5
Fig. 5. Limiting complexation-induced changes in 1H NMR chemical shift (ppm) for formation of 1 : 1 complexes with tri-n-butyl phosphine oxide in n-octane at 298 K.
Fig. 6
Fig. 6. (a) UV/Vis absorption spectra for titration of tri-n-butyl phosphine oxide (guest) into 10 in n-octane at 298 K. The initial spectrum is shown in black, and the final spectrum in red. (b) Changes in absorbance at 271 and 237 nm are shown as points, and the lines are the best fit to a 1 : 1 binding isotherm.
Fig. 7
Fig. 7. Relationship between the association constants for formation of 1 : 1 complexes with tri-n-butyl phosphine oxide in n-octane at 298 K (log K) and the Hammett parameter σm for substituent X. Compounds 1–5 are shown in blue (Y = OH), and the equation of the line is y = 2.35x + 2.97. Compounds 6–10 are shown in orange (Y = H), and the equation of the line is y = 1.89x + 2.21.
Fig. 8
Fig. 8. Relationship between the H-bond donor properties of 4-X-phenols, α(phenol), and the change in H-bond donor properties of the amide group in compounds 1–5 due to the intramolecular H-bond, Δα(amide). The best fit line is y = 0.20x − 0.34.
Fig. 9
Fig. 9. Comparison of calculated and experimental values of α for compounds 1–10. The line is y = x.

References

    1. Hunter C. A. Angew. Chem., Int. Ed. 2004;43:5310. doi: 10.1002/anie.200301739. - DOI - PubMed
    1. Akiyama M. Torii H. Spectrochim. Acta, Part A. 2000;56:137. doi: 10.1016/S1386-1425(99)00126-2. - DOI - PubMed
    1. Graham L. L. Chang C. Y. J. Phys. Chem. 1971;75:776. doi: 10.1021/j100676a009. - DOI
    1. Pralat K. Jadzyn J. Balanicka S. J. Phys. Chem. 1983;87:1385. doi: 10.1021/j100231a022. - DOI
    1. Kobko N. Dannenberg J. J. J. Phys. Chem. A. 2003;107:10389. doi: 10.1021/jp0365209. - DOI