

A senolysis-based theragnostic prodrug strategy towards chronic renal failure
- PMID: 36320912
- PMCID: PMC9580481
- DOI: 10.1039/d2sc03525a
A senolysis-based theragnostic prodrug strategy towards chronic renal failure
Abstract
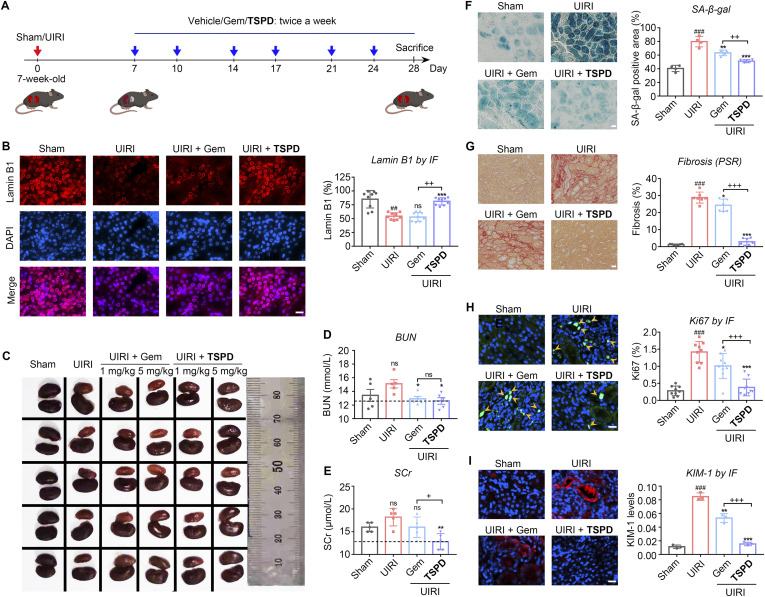
Selective elimination of senescent cells (senolysis) has become a promising therapeutic strategy for the management of chronic renal failure (CRF), but the senolytic molecular pathways towards CRF therapy are limited. Here, we present for the first time a senescence-associated β-galactosidase (SA-β-gal) activatable theragnostic prodrug strategy to pertinently and effectively treat CRF in mice with the aid of fluorescence-guided senolysis. The signs of premature senescence, including the overexpression of β-gal, have been found in kidneys of mice with CRF, making this enzyme particularly suitable as a trigger of prodrugs for CRF therapy. With this unique design, our pioneering prodrug TSPD achieved the activation of a fluorophore for tracking and the specific release of the parent drug, gemcitabine, in β-gal-enriched cells after activation with SA-β-gal. In mice with CRF, abdominal administration of TSPD was effective for improvement of the kidney functions, supporting the feasibility of the SA-β-gal-dependent senolysis therapy towards CRF.
This journal is © The Royal Society of Chemistry.
Conflict of interest statement
The authors declare that they have no competing financial interests.
Figures
Similar articles
-
Senolysis Enabled by Senescent Cell-Sensitive Bioorthogonal Tetrazine Ligation.Angew Chem Int Ed Engl. 2024 Feb 26;63(9):e202315425. doi: 10.1002/anie.202315425. Epub 2024 Jan 30. Angew Chem Int Ed Engl. 2024. PMID: 38233359 Free PMC article.
-
Cellular senescence imaging and senolysis monitoring in cancer therapy based on a β-galactosidase-activated aggregation-induced emission luminogen.Acta Biomater. 2024 Apr 15;179:340-353. doi: 10.1016/j.actbio.2024.03.027. Epub 2024 Mar 30. Acta Biomater. 2024. PMID: 38556136
-
Photoactivatable senolysis with single-cell resolution delays aging.Nat Aging. 2023 Mar;3(3):297-312. doi: 10.1038/s43587-023-00360-x. Epub 2023 Feb 2. Nat Aging. 2023. PMID: 37118423
-
Senolytic Prodrugs: A Promising Approach to Enhancing Senescence-Targeting Intervention.Chembiochem. 2024 Nov 18;25(22):e202400355. doi: 10.1002/cbic.202400355. Epub 2024 Sep 18. Chembiochem. 2024. PMID: 39058554 Review.
-
Cellular senescence in cardiac diseases.J Cardiol. 2019 Oct;74(4):313-319. doi: 10.1016/j.jjcc.2019.05.002. Epub 2019 Jun 12. J Cardiol. 2019. PMID: 31202488 Review.
Cited by
-
Advances in acid-degradable and enzyme-cleavable linkers for drug delivery.Curr Opin Chem Biol. 2025 Feb;84:102552. doi: 10.1016/j.cbpa.2024.102552. Epub 2024 Dec 5. Curr Opin Chem Biol. 2025. PMID: 39642424 Free PMC article. Review.
-
Frosted DNA: β-Galactosidase Control of Oligonucleotide Activity.Chemistry. 2025 Apr;31(24):e202500347. doi: 10.1002/chem.202500347. Epub 2025 Mar 30. Chemistry. 2025. PMID: 40084398 Free PMC article.
-
Unlocking the Potential of Senolytic Compounds: Advancements, Opportunities, and Challenges in Ageing-Related Research.Subcell Biochem. 2024;107:91-116. doi: 10.1007/978-3-031-66768-8_5. Subcell Biochem. 2024. PMID: 39693021 Review.
-
Senolysis Enabled by Senescent Cell-Sensitive Bioorthogonal Tetrazine Ligation.Angew Chem Int Ed Engl. 2024 Feb 26;63(9):e202315425. doi: 10.1002/anie.202315425. Epub 2024 Jan 30. Angew Chem Int Ed Engl. 2024. PMID: 38233359 Free PMC article.
-
Towards precision medicine using biochemically triggered cleavable conjugation.Commun Chem. 2025 Apr 2;8(1):100. doi: 10.1038/s42004-025-01491-5. Commun Chem. 2025. PMID: 40175511 Free PMC article. Review.
References
LinkOut - more resources
Full Text Sources