Spatial consistency in drivers of population dynamics of a declining migratory bird
- PMID: 36321197
- PMCID: PMC10099983
- DOI: 10.1111/1365-2656.13834
Spatial consistency in drivers of population dynamics of a declining migratory bird
Abstract
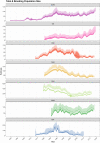
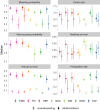
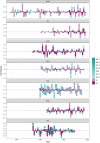
Many migratory species are in decline across their geographical ranges. Single-population studies can provide important insights into drivers at a local scale, but effective conservation requires multi-population perspectives. This is challenging because relevant data are often hard to consolidate, and state-of-the-art analytical tools are typically tailored to specific datasets. We capitalized on a recent data harmonization initiative (SPI-Birds) and linked it to a generalized modelling framework to identify the demographic and environmental drivers of large-scale population decline in migratory pied flycatchers (Ficedula hypoleuca) breeding across Britain. We implemented a generalized integrated population model (IPM) to estimate age-specific vital rates, including their dependency on environmental conditions, and total and breeding population size of pied flycatchers using long-term (34-64 years) monitoring data from seven locations representative of the British breeding range. We then quantified the relative contributions of different vital rates and population structure to changes in short- and long-term population growth rate using transient life table response experiments (LTREs). Substantial covariation in population sizes across breeding locations suggested that change was the result of large-scale drivers. This was supported by LTRE analyses, which attributed past changes in short-term population growth rates and long-term population trends primarily to variation in annual survival and dispersal dynamics, which largely act during migration and/or nonbreeding season. Contributions of variation in local reproductive parameters were small in comparison, despite sensitivity to local temperature and rainfall within the breeding period. We show that both short- and long-term population changes of British breeding pied flycatchers are likely linked to factors acting during migration and in nonbreeding areas, where future research should be prioritized. We illustrate the potential of multi-population analyses for informing management at (inter)national scales and highlight the importance of data standardization, generalized and accessible analytical tools, and reproducible workflows to achieve them.
Keywords: LTRE; annual survival; comparative analysis; environmental effects; full annual cycle; integrated population model; multi-population; pied flycatcher.
© 2022 The Authors. Journal of Animal Ecology published by John Wiley & Sons Ltd on behalf of British Ecological Society.
Conflict of interest statement
The authors have no conflict of interest.
Figures


References
-
- Bailey, L. D. , van de Pol, M. , Adriaensen, F. , Arct, A. , Barba, E. , Bellamy, P. E. , Bonamour, S. , Bouvier, J.‐C. , Burgess, M. D. , & Charmantier, A. (2022). Bird populations most exposed to climate change are less sensitive to climatic variation. Nature Communications, 13, 1–10. - PMC - PubMed
-
- Both, C. , Bouwhuis, S. , Lessells, C. M. , & Visser, M. E. (2006). Climate change and population declines in a long‐distance migratory bird. Nature, 441, 81–83. - PubMed
-
- Both, C. , Burger, C. , Ouwehand, J. , Samplonius, J. M. , Ubels, R. , & Bijlsma, R. G. (2017). Delayed age at first breeding and experimental removals show large non‐breeding surplus in pied flycatchers. Ardea, 105, 43–60.
-
- Both, C. , Robinson, R. A. , & van der Jeugd, H. P. (2012). Long‐distance dispersal in migratory pied flycatchers Ficedula hypoleuca is relatively common between the UK and The Netherlands. Journal of Avian Biology, 43, 193–197.
-
- Burgess, M. D. (2014). Restoring abandoned coppice for birds: Few effects of conservation management on occupancy, fecundity and productivity of hole nesting birds. Forest Ecology and Management, 330, 205–217.
Publication types
MeSH terms
LinkOut - more resources
Full Text Sources
Miscellaneous

