. 2022 Dec;45(6):652-663.
doi: 10.1002/nur.22268. Epub 2022 Nov 2.

Delirium detection using GAMMA wave and machine learning: A pilot study

Affiliations

Delirium detection using GAMMA wave and machine learning: A pilot study

Malissa Mulkey et al. Res Nurs Health. 2022 Dec.

Abstract

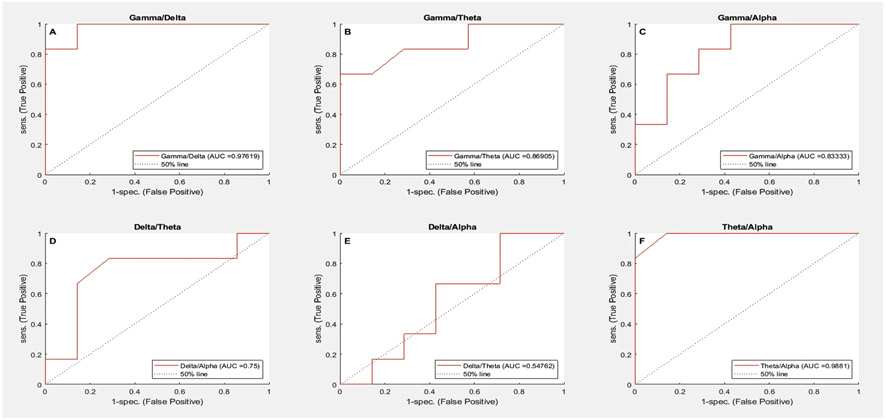
Delirium occurs in as many as 80% of critically ill older adults and is associated with increased long-term cognitive impairment, institutionalization, and mortality. Less than half of delirium cases are identified using currently available subjective assessment tools. Electroencephalogram (EEG) has been identified as a reliable objective measure but has not been feasible. This study was a prospective pilot proof-of-concept study, to examine the use of machine learning methods evaluating the use of gamma band to predict delirium from EEG data derived from a limited lead rapid response handheld device. Data from 13 critically ill participants aged 50 or older requiring mechanical ventilation for more than 12 h were enrolled. Across the three models, accuracy of predicting delirium was 70 or greater. Stepwise discriminant analysis provided the best overall method. While additional research is needed to determine the best cut points and efficacy, use of a handheld limited lead rapid response EEG device capable of monitoring all five cerebral lobes of the brain for predicting delirium hold promise.

Keywords: biological rhythms; clinical; cognition; instrument development and validation; mental states; physiological states.


Figures

Figure 1.
Figure 1.
EEG Processing
Figure 2.
Figure 2.
This figure contains 12 boxplots for the power ratio types and their corresponding values. Each power ratio type is compared between the delirium positive subject group and the delirium negative subject group. This figure shows that the overall variability of the delirium positive subject group is lower than the delirium negative subject group. The overall values of the power ratios trended higher in the delirium negative subject group for the power ratio types that included gamma. This was not consistent in the other power ratio types.
Figure 3.
Figure 3.
This figure shows six subplots illustrating the ROC curve for each frequency power ratio using the SWDLA classification. Plots 3A, 3B, and 3C all show the ROC curves for the frequency power ratios that include the gamma frequency band (gamma/delta, gamma/theta, and gamma/alpha). These ROC curves yield an AUC of roughly 0.976, 0.869, and 0.833, respectively. Plots 3D, 3E, and 3F show the ROC curves for the power ratios that include the delta, theta, and alpha bands (delta/theta, delta/alpha, and theta alpha). These power ratios yielded an AUC of roughly 0.750, 0.548, and 0.988, respectively. These six subplots show that the power ratios that include gamma had consistently accurate results. However, none of the other frequency bands produced power ratios that were consistently high. The theta/alpha power ratio also produced a high AUC that was consistent throughout all classification methods.
Figure 4.
Figure 4.
This figure shows six subplots illustrating the ROC curve for each frequency power ratio using the SVM classification. Plots 4A, 4B, and 4C all show the ROC curves for the frequency power ratios that include the gamma frequency band (gamma/delta, gamma/theta, and gamma/alpha). These ROC curves yield an AUC of roughly 0.821, 0.783, and 0.571, respectively. Plots 4D, 4E, and 4F show the ROC curves for the power ratios that include the delta, theta, and alpha bands (delta/theta, delta/alpha, and theta alpha). These power ratios yielded an AUC of roughly 0.452, 0, and 0.738, respectively. These six subplots show that the power ratios that include gamma had consistently higher accuracies compared to power ratios that did not include gamma. The theta/alpha power ratio also produced a higher AUC that was consistent throughout all classification methods. However, all of the ROC curves produced an AUC that was lower than the ROC curves that were generated using SWLDA. This SVM classification still confirms the higher accuracy when using the gamma frequency band.
Figure 5.
Figure 5.
This figure shows six subplots illustrating the ROC curve for each frequency power ratio using the random forest classification. Plots 5A, 5B, and 5C all show the ROC curves for the frequency power ratios that include the gamma frequency band (gamma/delta, gamma/theta, and gamma/alpha). These ROC curves yield an AUC of roughly 0.845, 0.690, and 0.619, respectively. Plots 5D, 5E, and 5F show the ROC curves for the power ratios that include the delta, theta, and alpha bands (delta/theta, delta/alpha, and theta alpha). These power ratios yielded an AUC of roughly 0.476, 0.083, and 0.833, respectively. These six subplots show that the power ratios that include gamma had consistently higher accuracies compared to power ratios that did not include gamma. The theta/alpha power ratio also produced a higher AUC that was consistent throughout all classification methods. However, all of the ROC curves produced an AUC that was lower than the ROC curves that were generated using SWLDA. The ROC curves generated by the random forest classification are very similar to those generated by the SVM classification. This random forest classification also confirms the higher accuracy when using the gamma frequency band.

References

    1. American Geriatric Society. (2015). American Geriatrics Society abstracted clinical practice guideline for postoperative delirium in older adults. J Am Geriatr Soc, 63(1), 142–150. 10.1111/jgs.13281 - DOI - PMC - PubMed
    1. American Psychiatric Association. (1987). Diagnostic and Statistical Manual of Mental Disorders: DSM-III-R (3rd, rev. ed.). American Psychiatric Association.
    1. American Psychiatric Association. (1998). Diagnostic and Statistical Manual of Mental Disorders : DSM-IV (4th [rev.] ed.). American Psychiatric Association.
    1. American Psychiatric Association. (2013). Diagnostic and Statistical Manual of Mental Disorders: DSM-5.
    1. Amoretti S, Mezquida G, Rosa AR, Bioque M, Cuesta MJ, Pina-Camacho L, Garcia-Rizo C, Barcones F, González-Pinto A, Merchán-Naranjo J, Corripio I, Vieta E, Baeza I, Cortizo R, Bonnín CM, Torrent C, & Bernardo M (2021). The functioning assessment short test (FAST) applied to first-episode psychosis: Psychometric properties and severity thresholds. Eur Neuropsychopharmacol. 10.1016/j.euroneuro.2021.02.007 - DOI - PubMed

Publication types